Embed Size (px)
Citation preview

© 2015 Belden Inc. | belden.com | @BeldenInc
August 2015
Belden Leading the Way to an Interconnected World

© 2015 Belden Inc. | belden.com | @BeldenInc 2
Belden’s Business Transformation
2005
2008
2012
2015
Strategy, Culture and Values
BUILD The Foundation
Belden Business System
POSITION For Accelerated Value Creation
Market and Geographic Footprint
Consistent Financial Performance
Portfolio Expansion
Talent/ Leadership
SCALE THE BUSINESS PLATFORMS AROUND
THE CUSTOMER
Belden TODAY
Belden’s transformation has resulted in a… Global Signal Transmission Solutions Company

© 2015 Belden Inc. | belden.com | @BeldenInc 3
Driving Value Through Consistent Financial Performance
2005 2014
Revenues1 1,246 2,320 7.2% CAGR
EBITDA Margin 9.4% 16.3%2 +690 bps
Free Cash Flow Exceed Net Income3 110% 101%
Achieved for 10 Straight
Years
Return on Invested Capital4 4.1% 13.0% +890 bps
1. Adjusted results. See appendix for reconciliation to comparable GAAP results. 2. Q4 2014 EBITDA margin. Adjusted results. See appendix for reconciliation to comparable GAAP results. 3. As a percentage of Net Income. Adjusted results. See appendix for reconciliation to comparable GAAP results. 4. Excluding excess cash,
Increased Enterprise Value by 5X since 2005

© 2015 Belden Inc. | belden.com | @BeldenInc 4
Connectivity Peers
Cable Peers
A Common Misperception About Belden
“Belden is a Wire and Cable company.”
10.0%
20.0%
30.0%
40.0%
50.0%
2005 2006 2007 2008 2009 2010 2011 2012 2013 2014
Belden Gross Profit Percentage1 Improvement of
1,470 bps
Belden’s Gross Profit Margin Exceeds Connectivity Peers
1. Adjusted results. See appendix for reconciliation to comparable GAAP results.

© 2015 Belden Inc. | belden.com | @BeldenInc 5
Five Business Platforms Delivering Innovative Connectivity Solutions
Broadcast Enterprise Industrial Connectivity
Industrial IT Solutions
Network Security
• Industrial and I/O Connectors
• Industrial Cable • Distribution Boxes • Customized
Connectivity Solutions
• Ethernet Switches • Wireless Systems • Routers and
Gateways • Security Devices • Network Management
Software
• Copper and Fiber Connectivity
• Racks and Enclosures • Ethernet, Fiber Optic
and Coaxial Cabling • Custom Infrastructure
Solutions
• Routers and Interfaces • Broadcast Connectors • Broadband
Connectivity • Multi-Viewers and
Monitoring and Control Systems
• Playout Systems
• Vulnerability Assessment
• Security Configuration Management
• Log Intelligence • Analytics and
Reporting

© 2015 Belden Inc. | belden.com | @BeldenInc 6
A Global Signal Transmission Solutions Company
Broadcast Enterprise Connectivity
Industrial Connectivity Industrial IT Network
Security
Served Available Market Size $4.9B $3.3B $4.0B $1.3B $4.3B
Long-term Market Growth Rate1 3 - 5% 1 - 3% 2 - 4% 4 - 6% 10 - 12%
TTM Revenue2 $942.8M $448.1M $658.7M $268.4M $165.0M Market Share2 20% 14% 17% 20% 4% TTM EBITDA Margin3 15.1% 14.9% 16.1% 19.0% 24.3%
Key Markets
• Broadcast Studios
• Broadband Connectivity
• Finance • Healthcare
• Discrete • Process • Energy • Transportation
• Security and Vulnerability
Applications
Creation
Aggregation
Delivery
Data Center
Local Area Network
Machine Control
Operation Technology
Network Security
Payment Systems
Utilities / Energy
Healthcare
Retail Data
1. Served addressable market. 2. Based on TTM revenues plus impact of acquisitions 3. Based on TTM. Adjusted results. See appendix for reconciliation to comparable GAAP results.

© 2015 Belden Inc. | belden.com | @BeldenInc 7
Balanced Exposure to Attractive End Markets
Industrial markets correlate to industrial capital expenditures
Enterprise markets correlate to non-residential construction and IT spend
Broadcast markets correlate to the 4-Year Broadcast IT cycle and residential construction
End Market Business Cycles
Industrial Enterprise Broadcast
Lower Volatility of Consolidated Revenues
Independence of each market provides consistency
Industrial markets correlate to industrial capital expenditures
Enterprise markets correlate to non-
residential construction and IT spend
Broadcast markets correlate to the 4-Year Broadcast IT cycle and residential construction
© 2015 Belden Inc. | belden.com | @BeldenInc 8
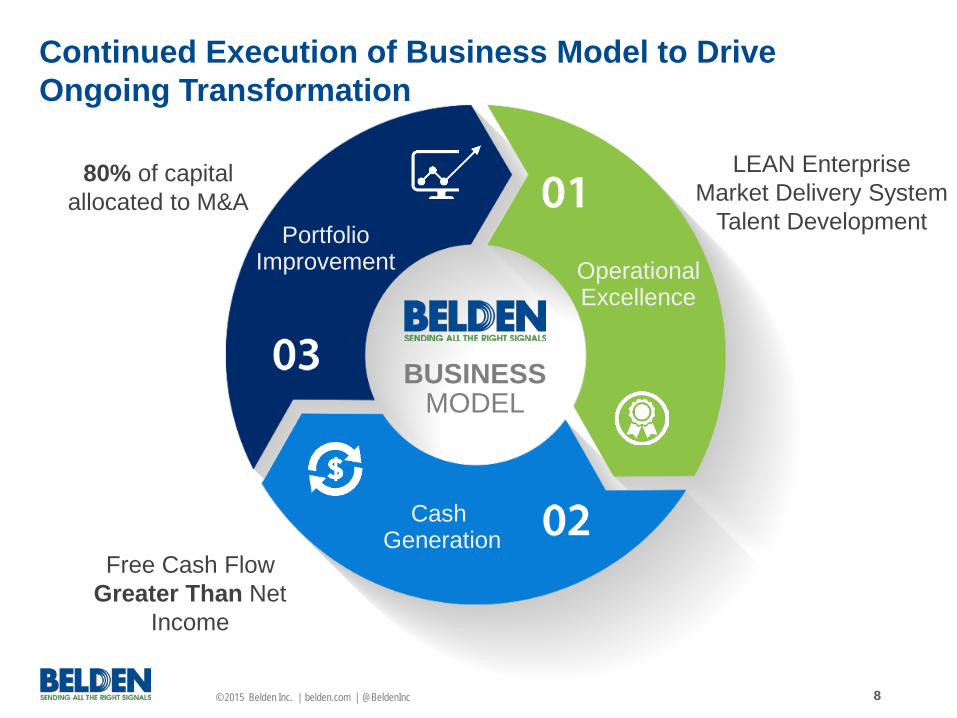
Operational Excellence
BUSINESS MODEL
Free Cash Flow Greater Than Net
Income
LEAN Enterprise Market Delivery System
Talent Development
80% of capital allocated to M&A
Continued Execution of Business Model to Drive Ongoing Transformation
Cash Generation
Portfolio Improvement

© 2015 Belden Inc. | belden.com | @BeldenInc 9
Operational Excellence
LEAN Enterprise
Market Delivery System
Talent Development
Operational efficiency through continuous improvement on a
company-wide basis
Four inter-related processes that provide
the foundation for organic growth
Create and enhance career opportunities for
talented new and current associates
LEAN metrics are utilized company-wide;
not just in manufacturing
A global commercial team capable of solving
complex networking applications
98% retention rate of high-potential
associates 75% internal fill rate

© 2015 Belden Inc. | belden.com | @BeldenInc 10
$-
$50
$100
$150
$200
2005 2008 2011 2014
Cash Generation
High quality earnings fuel the transformation
FCF1($)
Working Capital Efficiency
Leverage on Growth
Fixed Asset Efficiency
1. Adjusted results. See appendix for reconciliation to comparable GAAP results.
20% CAGR

© 2015 Belden Inc. | belden.com | @BeldenInc 11
1 4
2
3
Portfolio Improvement
$2.8B 80% $2.8B deployed since 2007
80% of capital towards M&A
Cash ROIC >13% >13%
Accretive to Growth
Market Leadership
Accretive to Margins
Acquire
Realize Synergies
Continuous Improvement
And the process continues……
Cost Synergies
Tax Synergies
Commercial Synergies
LEAN Enterprise

© 2015 Belden Inc. | belden.com | @BeldenInc 12
2005 2008 2011 2014
Strong Track Record of Value Creation
Revenue EBITDA1 EPS1
Continuing the Transformation
1. Adjusted results. See appendix for reconciliation to comparable GAAP results.

© 2015 Belden Inc. | belden.com | @BeldenInc 13
CREATE A FOUNDATION
AMPLIFY Middle Innings of Transformation
$-
$400
$800
$1,200
$1,600
Base Years 1 - 3 Years 4 - 6 Years 7 - 9 Years 10 - 12 Years 13 - 15 Years 16 - 18
BUY & BUILD
Similar Trajectory as Aspirational Peer
Aspire To Peer Belden
EBIT
DA
($ millions)

© 2015 Belden Inc. | belden.com | @BeldenInc 14
Disciplined Approach Enables Perpetual Value Creation
CREATE A FOUNDATION
BUY & BUILD
AMPLIFY
2005 2008 2011 2014 2017 2020 Years 1 - 3 Years 4 - 6 Years 7 - 9 Years 10 - 12 Years 13 - 15
Aspire To Peer
Organic
M&A
**Please note that these potential scenarios illustrate outcomes of our strategic plan. These scenarios which are subject to risks and uncertainties, should not be treated as forward looking statements.
$-
$400
$800
$1,200
EBIT
DA
($ millions)

© 2015 Belden Inc. | belden.com | @BeldenInc 15
• Product innovation • Productivity
improvement • Capital expenditure
A Disciplined Capital Deployment Strategy
Innovation and Market Expansion
Share Repurchase M&A
Invest in growth opportunities
Repurchase Belden stock at attractive prices
Identify product and market opportunities, and acquire with
a disciplined approach
• Repurchased 6.7 million shares at $46.54 average
• ~14% of outstanding shares
• $311M spent since 2011
• $2.8 billion spent since 2007
• >15% Cash ROIC on acquisitions made before 2011
Deploy capital to highest ROIC project
2014 ROIC* = 13.0%
* ROIC excluding excess cash
© 2015 Belden Inc. | belden.com | @BeldenInc 16
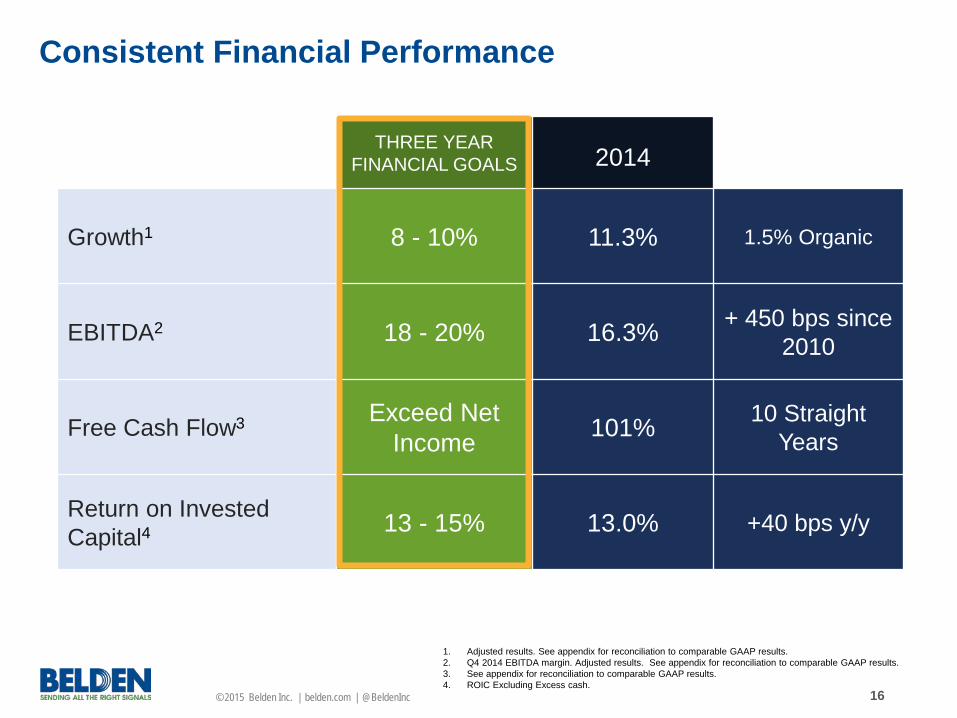
Consistent Financial Performance
1. Adjusted results. See appendix for reconciliation to comparable GAAP results. 2. Q4 2014 EBITDA margin. Adjusted results. See appendix for reconciliation to comparable GAAP results. 3. See appendix for reconciliation to comparable GAAP results. 4. ROIC Excluding Excess cash.
THREE YEAR FINANCIAL GOALS
2014
Growth1 8 - 10% 11.3% 1.5% Organic
EBITDA2 18 - 20% 16.3% + 450 bps since 2010
Free Cash Flow3 Exceed Net Income 101% 10 Straight
Years
Return on Invested Capital4 13 - 15% 13.0% +40 bps y/y

© 2015 Belden Inc. | belden.com | @BeldenInc 17
Driving Further Multiple Expansion
4x
8x
12x
16x
EV/E
BIT
DA
Mul
tiple
10% 15% 20% 25% 30% 5% EBITDA-Capex Margin
D C
E
A B
Best In Class Peers
A
B
C Legacy Peers 2005
Increased EBITDA - Capex margin drives multiple expansion

© 2015 Belden Inc. | belden.com | @BeldenInc 18
Accelerating Shareholder Value with Strong Financial Performance
Balanced
Profitable
Well Capitalized
Value Creating
Consistent growth and balance across regions and platforms drives predictable results
Business transformation delivering an improved business model
Excellent cash flow generation, low cost of capital creates significant strategic advantage
Disciplined approach to deploying capital creates shareholder value

© 2015 Belden Inc. | belden.com | @BeldenInc
2015 Broadcast Market Conditions

© 2015 Belden Inc. | belden.com | @BeldenInc 20
Broadcast Platform
Broadcast Platform
Broadcast Cable
Broadband Connectivity
Broadcast IT
42%
40%
18%
15%
35%
50%
20%
20%
16% 8%
10%
6%
21%
Routers and Interfaces
Digital Media & Workflow (i.e. Content manager, graphics, branding)
Monitoring & Control
Editing Systems
Software & Services
Grass Valley
Content Creation 68%
Playout 32%
Switchers, Cameras, Editing, DM&W, Routers & Interfaces, S&S
Monitoring & Control, Routers & Interfaces, S&S, DM&W

© 2015 Belden Inc. | belden.com | @BeldenInc 21
Changes Within the Grass Valley Market
Combined, these dynamics have created a perfect storm in 2015
Decreasing U.S. Advertising
Spend Impacts Capex
Decisions
Increased Digital/OTT
Viewing Impacts Capex
Decisions
Macro-Economic Headwinds Impacting
International Demand

© 2015 Belden Inc. | belden.com | @BeldenInc 22
Restructured the business for regional outlook $30M of annual savings
Macro-Economic Headwinds Impact International Demand
What is happening? What does this mean for Grass Valley?
International Revenues
• Stronger USD reducing purchasing power
• Govt-sponsored broadcasters impacted by austerity measures and oil prices
~60% of Grass Valley (20%)
Upgrade cycle is elongated Long-Term
Short-Term
USD/EUR Oil Prices

© 2015 Belden Inc. | belden.com | @BeldenInc 23
Live 48%
News 20%
Playout 32%
Decreased U.S. Advertising Spend Impacts Capex Decisions
What is happening? What does this mean for Grass Valley?
68% of product portfolio to Live Environment Content creation continues in high demand Long-
Term
Short-Term
Live 48%
News 20%
Playout 32%
National TV Advertising Growth1
1. Standard Media Index

© 2015 Belden Inc. | belden.com | @BeldenInc 24
Over the Top (OTT)
Increased Digital/OTT Viewing Impacts Capex Decisions
Creators Aggregators Distributors
Network Operators Broadcasters Studios
Consumers
Complexity of the infrastructure and delivery model
200+
Dev
ices

© 2015 Belden Inc. | belden.com | @BeldenInc 25
Increased Digital/OTT Viewing Impacts Capex Decisions
What is happening? What does this mean for Grass Valley?
30%
43%
49%
58% 61%
64%
10%
30%
50%
70%
2009 2010 2011 2012 2013 2014E
Percent of Video Over Internet1
Organic investment in Digital Media applications Content creation continues in high demand Long-
Term
Short-Term
Live 48%
News 20%
Playout 32%
Investment shifted to OTT platforms by current GV customers
1. Sandvine Global Internet Phenomena Report
Live 48%
News 20%
Playout 32%

© 2015 Belden Inc. | belden.com | @BeldenInc 26
However, OTT Consumption Requires Faster Internet Speeds
Online M r
10 a.m. 2 p.m.
6 p.m. 10 p.m.
2 a.m.
Streaming 64%
Current Home Infrastructure
We provide unique, patented solutions for in-home connectivity. As consumption increases, the home and distribution network will need upgrades.
Average Broadband Speed is 16 Mbps
48 Mbps Average Fixed Broadband speed by 2018
Belden Entry
Not Belden

© 2015 Belden Inc. | belden.com | @BeldenInc 27
Q2 2015 Earnings Release Conference Call Presentation

© 2015 Belden Inc. | belden.com | @BeldenInc 28
• Generated revenues of $598.5 million; • Achieved record gross profit margins of 41.7%, increasing 470
basis points from 37.0% in the year-ago period; • Expanded EBITDA margins to a record 16.7%, increasing 190
basis points from 14.8% in the year-ago period; • Generated income from continuing operations per diluted share
of $1.21, up 15.2% over last year’s $1.05; and • Reduced the expected range of full-year revenues to $2.360 -
$2.390 billion, and adjusted income from continuing operations per diluted share to $4.70 – 4.90.
Q2 2015 Highlights
Adjusted results. See Appendix for reconciliation to comparable GAAP results.

© 2015 Belden Inc. | belden.com | @BeldenInc 29
Revenue $39.6M
EBITDA Margin 22.1%
Revenue $61.3M
EBITDA Margin 16.6%
Revenue $117.3M
EBITDA Margin 18.0%
Revenue $160.9M
EBITDA Margin 17.8%
2nd Quarter Segment Overview Revenue $219.4M
EBITDA Margin 14.4% Broadcast
Enterprise Connectivity
Industrial Connectivity
Industrial IT
Network Security
Camera Mounted Fiber Solutions
Signal Processing & Routing
Precision A/V Cable and Connectivity
Monitoring Systems
Automation Playout & Branding Systems
Industrial and I/O Connectors
Industrial Cables
IP/Networking Cables
I/O Modules/ Active
Distribution Boxes
Customer-Specific Wiring
Copper and Fiber Connectivity
Racks and Enclosures
Ethernet, Fiber Optic and Coaxial
Cables, Security & Routing Wireless Switches Connectivity
Vulnerability Assessment Targeted Attack Detection Threat Analytics
Adjusted results. See Appendix for reconciliation to comparable GAAP results.

© 2015 Belden Inc. | belden.com | @BeldenInc 30
Q2 2015 Q1 2015 Q2 2014
Revenue $598.5M $569.5M $605.1M
Gross profit $249.5M $231.0M $223.8M
Gross profit percentage 41.7% 40.6% 37.0%
EBITDA $100.1M $88.5M $89.8M
EBITDA percentage 16.7% 15.5% 14.8%
Income from continuing operations $52.2M $43.3M $46.5M
Income from continuing operations per diluted share $1.21 $1.00 $1.05
Q2 2015 Financial Summary
Adjusted results. See Appendix for reconciliation to comparable GAAP results.

© 2015 Belden Inc. | belden.com | @BeldenInc 31
Segment Results
Broadcast Enterprise Connectivity
Industrial Connectivity Industrial IT Network
Security Consolidated
Q2 2015 Revenue $219.4M $117.3M $160.9M $61.3M $39.6M $598.5M
EBITDA(1) $31.6M $21.1M $28.7M $10.2M $8.8M $100.1M
EBITDA Margin 14.4% 18.0% 17.8% 16.6% 22.1% 16.7%
Q1 2015 Revenue $213.6M $104.7M $153.0M $61.1M $37.1M $569.5M
EBITDA(1) $29.2M $13.9M $24.2M $11.1M $9.9M $88.5M
EBITDA Margin 13.7% 13.3% 15.8% 18.2% 26.7% 15.5%
Q2 2014(2) Revenue $252.3M $121.3M $178.2M $53.3M $605.1M
EBITDA(1) $31.3M $19.7M $29.5M $8.8M $89.8M
EBITDA Margin 12.4% 16.2% 16.5% 16.5% 14.8%
Adjusted results. See Appendix for reconciliation to comparable GAAP results. (1) Consolidated results include income from our equity method investment. (2) Consolidated results for these periods exclude the impact of Security as Tripwire acquisition was completed in 2015
© 2015 Belden Inc. | belden.com | @BeldenInc 32
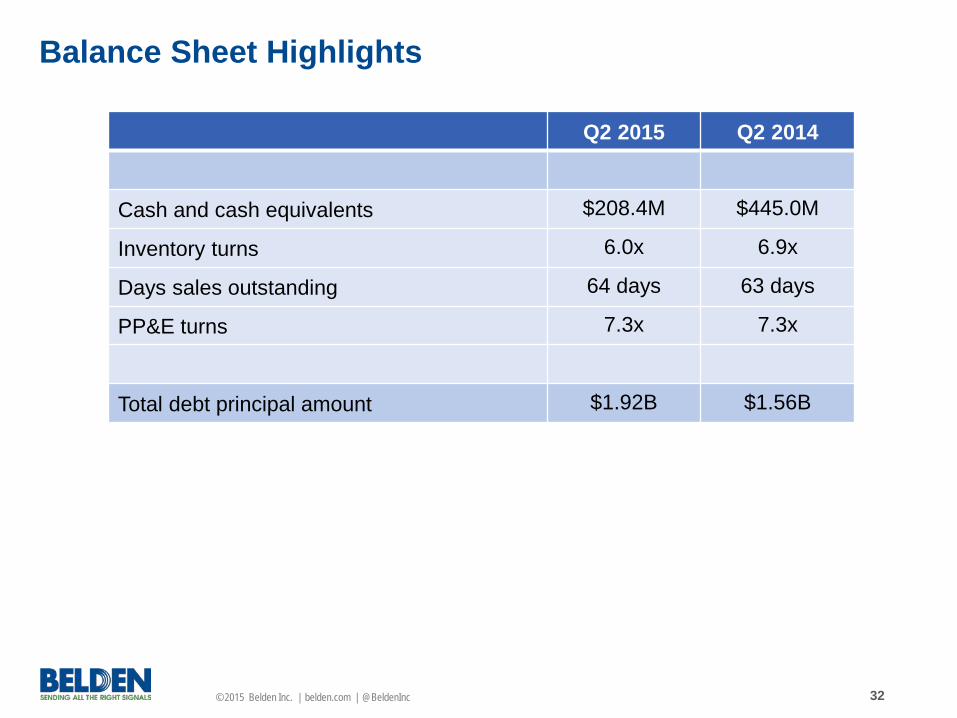
Q2 2015 Q2 2014
Cash and cash equivalents $208.4M $445.0M
Inventory turns 6.0x 6.9x
Days sales outstanding 64 days 63 days
PP&E turns 7.3x 7.3x
Total debt principal amount $1.92B $1.56B
Balance Sheet Highlights

© 2015 Belden Inc. | belden.com | @BeldenInc 33
Cash Flow Highlights
(1) Adjusted for cash payment of $12.8M in Q2 2014 related to the integration of Grass Valley. See Appendix for reconciliation to comparable GAAP results. (2) Capital expenditures, net of proceeds from the disposal of tangible assets. See Appendix for reconciliation. (3) Free cash flow is not a term defined by generally accepted accounting principles (GAAP) and our definition may or may not be used consistently with other companies that define this term. See Appendix
for reconciliation to comparable GAAP results. (4) Net of cash acquired.
Q2 2015 Q2 2014
Cash flows from operating activities $ 53.3M $ 43.7M(1)
Less: Net capital expenditures(2) $ 11.7M $ 10.6M
Free cash flow (3) $ 41.6M $ 33.1M
Cash used to acquire businesses(4) $ 0.0M $ 306.8M
Share repurchases and dividends $ 2.1M $ 33.4M

© 2015 Belden Inc. | belden.com | @BeldenInc 34
Q3 2015(1)
• Revenue of $580 - $600 million
• Income from continuing operations per diluted share of $1.05 - $1.15
Outlook
2015 Full Year(1)
• Revenue of $2.360 - $2.390 billion
• Income from continuing operations per diluted share of $4.70 - $4.90
(1) Adjusted outlook. See Appendix for reconciliation to comparable GAAP outlook.

© 2015 Belden Inc. | belden.com | @BeldenInc 35
Appendix

© 2015 Belden Inc. | belden.com | @BeldenInc 36
Statements of Operations and Comprehensive Income (Unaudited)
June 28, 2015 June 29, 2014 June 28, 2015 June 29, 2014
Revenues $ 585,755 $ 600,891 $ 1,132,712 $ 1,088,581 Cost of sales (351,479) (396,506) (690,787) (708,479) Gross profit 234,276 204,385 441,925 380,102 Selling, general and administrative expenses (127,927) (145,902) (268,743) (240,750)Research and development (36,632) (31,618) (72,831) (52,189)Amortization of intangibles (25,917) (15,795) (52,421) (27,536)Income from equity method investment 343 1,256 1,111 2,210 Operating income 44,143 12,326 49,041 61,837 Interest expense, net (24,769) (18,092) (48,615) (36,762) Income (loss) from continuing operations before taxes 19,374 (5,766) 426 25,075 Income tax benefit 2,303 5,781 1,615 96 Income from continuing operations 21,677 15 2,041 25,171 Loss from disposal of discontinued operations, net of tax (86) - (86) (562) Net income $ 21,591 $ 15 $ 1,955 $ 24,609
Weighted average number of common shares and equivalents: Basic 42,655 43,603 42,596 43,559 Diluted 43,233 44,292 43,224 44,293
Basic income (loss) per share: Continuing operations $ 0.51 $ - $ 0.05 $ 0.58 Discontinued operations - - - (0.01) Net income $ 0.51 $ - $ 0.05 $ 0.57
Diluted income (loss) per share: Continuing operations $ 0.50 $ - $ 0.05 $ 0.57 Discontinued operations - - - (0.01) Net income $ 0.50 $ - $ 0.05 $ 0.56
Comprehensive income $ 19,562 $ 13,894 $ 13,839 $ 27,175
Dividends declared per share $ 0.05 $ 0.05 $ 0.10 $ 0.10
Three Months Ended Six Months Ended
(In thousands, except per share data)

© 2015 Belden Inc. | belden.com | @BeldenInc 37
Balance Sheet June 28, 2015 December 31, 2014
(Unaudited)
Current assets:Cash and cash equivalents 208,419$ 741,162$ Receivables, net 412,251 379,777 Inventories, net 233,100 228,398 Deferred income taxes 21,188 22,157 Other current assets 72,388 42,656
Total current assets 947,346 1,414,150
Property, plant and equipment, less accumulated depreciation 319,455 316,385 Goodwill 1,418,031 943,374 Intangible assets, less accumulated amortization 713,484 461,292 Deferred income taxes 24,049 40,652 Other long-lived assets 80,278 86,974
3,502,643$ 3,262,827$
Current liabilities:Accounts payable 225,891$ 272,439$ Accrued liabilities 267,910 250,420 Current maturities of long-term debt 2,500 2,500
Total current liabilities 496,301 525,359
Long-term debt 1,918,695 1,765,422 Postretirement benefits 115,806 122,627 Deferred income taxes 115,060 10,824 Other long-term liabilities 36,275 31,409 Stockholders’ equity:
Common stock 503 503 Additional paid-in capital 598,264 595,389 Retained earnings 619,593 621,896 Accumulated other comprehensive loss (34,147) (46,031) Treasury stock (363,707) (364,571)
Total stockholders’ equity 820,506 807,186
3,502,643$ 3,262,827$
LIABILITIES AND STOCKHOLDERS’ EQUITY
(In thousands)
ASSETS

© 2015 Belden Inc. | belden.com | @BeldenInc 38
Cash Flow Statement (Unaudited)
June 28, 2015 June 29, 2014
Cash flows from operating activities: Net income $ 1,955 $ 24,609 Adjustments to reconcile net income to net cash provided by operating activities: Depreciation and amortization 75,654 48,433 Share-based compensation 9,891 9,524 Income from equity method investment (1,111) (2,210) Tax benefit related to share-based compensation (5,288) (4,894) Changes in operating assets and liabilities, net of the effects of currency exchange rate changes and acquired businesses: Receivables (6,250) (33,762) Inventories (11,837) 7,605 Accounts payable (43,689) (4,584) Accrued liabilities (4,363) (32,271) Accrued taxes (10,214) (13,226) Other assets (625) 7,212 Other liabilities 923 4,119 Net cash provided by operating activities 5,046 10,555
Cash flows from investing activities: Cash used to acquire businesses, net of cash acquired (695,345) (311,467) Capital expenditures (27,224) (20,963)
Payments related to the disposal of a business - (956) Proceeds from disposal of tangible assets 80 13 Net cash used for investing activities (722,489) (333,373)
Cash flows from financing activities:Borrowings under credit arrangements 200,000 200,000
Tax benefit related to share-based compensation 5,288 4,894 Payments under share repurchase program - (31,197)
Payments under borrowing arrangements (625) (625) Debt issuance costs paid (643) (5,702) Cash dividends paid (4,235) (4,358) Proceeds (payments) from exercise of stock options, net of withholding tax payments (11,439) (7,741) Net cash provided by financing activities 188,346 155,271
Effect of foreign currency exchange rate changes on cash and cash equivalents (3,646) (792)
Decrease in cash and cash equivalents (532,743) (168,339)Cash and cash equivalents, beginning of period 741,162 613,304 Cash and cash equivalents, end of period $ 208,419 $ 444,965
(In thousands)
Six Months Ended

© 2015 Belden Inc. | belden.com | @BeldenInc 39
Free Cash Flow GAAP to Non-GAAP Reconciliation
(Unaudited)
June 28, 2015 June 29, 2014 June 28, 2015 June 29, 2014
GAAP net cash provided by operating activities 53,251$ 30,970$ 5,046$ 10,555$ Capital expenditures, net of proceeds from
the disposal of tangible assets (11,694) (10,606) (27,144) (20,950) Cash paid for severance and other costs for the
integration of our acquisition of Grass Valley - 12,768 - 12,768 Non-GAAP free cash flow 41,557$ 33,132$ (22,098)$ 2,373$
Three Months Ended Six Months Ended
We define free cash flow, which is a non-GAAP financial measure, as net cash provided by operating activities adjusted forcapital expenditures net of the proceeds from the disposal of tangible assets, and cash payments for severance and other costsfor the integration of our 2014 acquisition of Grass Valley. We believe free cash flow provides useful information to investorsregarding our ability to generate cash from business operations that is available for acquisitions and other investments, service of debt principal, dividends and share repurchases. We use free cash flow, as defined, as one financial measure to monitor andevaluate performance and liquidity. Non-GAAP financial measures should be considered only in conjunction with financialmeasures reported according to accounting principles generally accepted in the United States. Our definition of free cash flowmay differ from definitions used by other companies.
(In thousands)

© 2015 Belden Inc. | belden.com | @BeldenInc 40
GAAP to Non-GAAP Reconciliation - Consolidated (Unaudited)
June 28, 2015 June 29, 2014 June 28, 2015 June 29, 2014
GAAP revenues 585,755$ 600,891$ 1,132,712$ 1,088,581$ Deferred revenue adjustments 12,758 4,163 35,252 4,780
Adjusted revenues 598,513$ 605,054$ 1,167,964$ 1,093,361$
GAAP gross profit 234,276$ 204,385$ 441,925$ 380,102$ Severance, restructuring, and integration costs 1,783 8,035 3,174 7,986 Purchase accounting effects related to acquisitions - 7,442 267 7,442 Deferred gross profit adjustments 13,440 3,915 35,098 4,365 Accelerated depreciation 25 - 100 -
Adjusted gross profit 249,524$ 223,777$ 480,564$ 399,895$
GAAP gross profit margin 40.0% 34.0% 39.0% 34.9%Adjusted gross profit margin 41.7% 37.0% 41.1% 36.6%
GAAP operating income 44,143$ 12,326$ 49,041$ 61,837$ Severance, restructuring, and integration costs 4,907 38,208 19,390 39,651 Amortization of intangible assets 25,917 15,795 52,421 27,536 Purchase accounting effects related to acquisitions - 8,163 9,422 9,015 Deferred gross profit adjustments 13,440 3,915 35,098 4,365 Accelerated depreciation 42 - 182 - Total operating income adjustments 44,306 66,081 116,513 80,567 Depreciation expense 11,650 11,400 23,051 20,897
Adjusted EBITDA 100,099$ 89,807$ 188,605$ 163,301$
GAAP operating income margin 7.5% 2.1% 4.3% 5.7%Adjusted EBITDA margin 16.7% 14.8% 16.1% 14.9%
GAAP income from continuing operations 21,677$ 15$ 2,041$ 25,171$ Operating income adjustments from above 44,306 66,081 116,513 80,567 Tax effect of adjustments (13,768) (19,635) (23,077) (23,855)
Adjusted income from continuing operations 52,215$ 46,461$ 95,477$ 81,883$
GAAP income from continuing operations per diluted share 0.50$ -$ 0.05$ 0.57$ Adjusted income from continuing operations per diluted share 1.21$ 1.05$ 2.21$ 1.85$
GAAP and Adjusted diluted weighted average shares 43,233 44,292 43,224 44,293
Three Months Ended Six Months Ended
(In thousands, except percentages and per share amounts)
In addition to reporting financial results in accordance with accounting principles generally accepted in the United States, we provide non-GAAP operating results adjustedfor certain items, including: asset impairments; accelerated depreciation expense due to plant consolidation activities; purchase accounting effects related to acquisitions,such as the adjustment of acquired inventory and deferred revenue to fair value and transaction costs; revenue and cost of sales deferrals for certain acquired product linessubject to software revenue recognition accounting requirements; severance, restructuring, and acquisition integration costs; gains (losses) recognized on the disposal ofbusinesses and tangible assets; amortization of intangible assets; gains (losses) on debt extinguishment; discontinued operations; and other costs. We utilize the adjustedresults to review our ongoing operations without the effect of these adjustments and for comparison to budgeted operating results. We believe the adjusted results are useful to investors because they help them compare our results to previous periods and provide important insights into underlying trends in the business and how managementoversees our business operations on a day-to-day basis. Adjusted results should be considered only in conjunction with results reported according to accounting principlesgenerally accepted in the United States.

© 2015 Belden Inc. | belden.com | @BeldenInc 41
Segment Operating Information (Unaudited)
Broadcast Solutions
Enterprise Connectivity
Industrial Connectivity
Industrial IT
Network Security Total Segments
For the three months ended June 28, 2015
Segment Revenues $ 219,415 $ 117,335 $ 160,875 $ 61,270 $ 39,618 598,513$ Segment EBITDA 31,614 21,101 28,680 10,178 8,772 100,345 Segment EBITDA margin 14.4% 18.0% 17.8% 16.6% 22.1% 16.8%
Depreciation expense 4,373 2,947 2,869 584 919 11,692 Amortization of intangibles 12,889 135 807 1,479 10,607 25,917 Severance, restructuring, and acquisition integration costs 3,283 83 1,163 - 378 4,907 Deferred gross profit adjustments (924) - - - 14,364 13,440
For the three months ended June 29, 2014
Segment Revenues $ 252,278 $ 121,272 $ 178,244 $ 53,260 -$ 605,054$ Segment EBITDA 31,318 19,667 29,462 8,806 - 89,253 Segment EBITDA margin 12.4% 16.2% 16.5% 16.5% n/a 14.8%
Depreciation expense 4,609 3,799 2,458 534 - 11,400 Amortization of intangibles 14,424 167 271 933 - 15,795 Severance, restructuring, and acquisition integration costs 27,524 1,821 8,144 719 - 38,208 Purchase accounting effects of acquisitions 7,148 147 250 618 - 8,163 Deferred gross profit adjustments 3,915 - - - - 3,915
For the three months ended March 29, 2015
Segment Revenues $ 213,586 $ 104,695 $ 152,972 $ 61,073 $ 37,125 569,451$ Segment EBITDA 29,232 13,881 24,173 11,087 9,901 88,274 Segment EBITDA margin 13.7% 13.3% 15.8% 18.2% 26.7% 15.5%
Depreciation expense 4,185 3,002 2,851 559 944 11,541 Amortization of intangibles 12,720 138 823 1,410 11,413 26,504 Severance, restructuring, and acquisition integration costs 11,538 557 1,773 (52) 667 14,483 Purchase accounting effects of acquisitions - - 267 - 9,155 9,422 Deferred gross profit adjustments 3,294 - - - 18,364 21,658
(In thousands, except percentages)

© 2015 Belden Inc. | belden.com | @BeldenInc 42
Segment Operating Information
(Unaudited)
June 28, 2015 June 29, 2014 March 29, 2015
Total Segment Revenues $ 598,513 $ 605,054 $ 569,451 Deferred revenue adjustments (12,758) (4,163) (22,494)
Consolidated Revenues $ 585,755 $ 600,891 $ 546,957
Total Segment EBITDA $ 100,345 $ 89,253 $ 88,274 Income from equity method investment 343 1,256 768 Eliminations (589) (702) (536)
Consolidated Adjusted EBITDA (1) 100,099 89,807 88,506 Amortization of intangibles (25,917) (15,795) (26,504)Deferred gross profit adjustments (13,440) (3,915) (21,658)Severance, restructuring, and acquisition integration costs (4,907) (38,208) (14,483)Depreciation expense (11,692) (11,400) (11,541)Purchase accounting effects related to acquisitions - (8,163) (9,422)
Consolidated operating income 44,143 12,326 4,898 Interest expense, net (24,769) (18,092) (23,846)
Consolidated income (loss) from continuing operations before taxes $ 19,374 $ (5,766) $ (18,948)
(1) Consolidated Adjusted EBITDA is a non-GAAP metric. See Reconciliation of Non-GAAP Measures for additional information.
Three Months Ended
(In thousands)

© 2015 Belden Inc. | belden.com | @BeldenInc 43
Reconciliation of Non-GAAP Measures 2015 Revenue and Earnings Guidance
Year Ended Three Months EndedDecember 31, 2015 September 27, 2015
Adjusted revenues $2.360 - $2.390 billion $580 - $600 millionDeferred revenue adjustments ($57 million) ($13 million)
GAAP revenues $2.303 - $2.333 billion $567 - $587 million
Adjusted income from continuing operations per diluted share $4.70 - $4.90 $1.05 - $1.15Amortization of intangible assets ($1.82) ($0.50)Deferred gross profit adjustments ($0.97) ($0.24)Severance, restructuring, and acquisition integration costs ($0.81) ($0.47)Purchase accounting effects of acquisitions ($0.16) $0.00
GAAP income (loss) from continuing operations per diluted share $0.94 - $1.14 ($0.16 - $0.06)
Our guidance for revenues and income from continuing operations per diluted share is based upon the extent of information currently available regarding eventsand conditions that will impact our future operating results for 2015. Our actual results are likely to be impacted by other additional events for which informationis not available, such as asset impairments, purchase accounting effects related to acquisitions, severance and other restructuring costs, gains (losses) recognizedon the disposal of tangible assets, gains (losses) on debt extinguishment, discontinued operations, and other gains (losses) related to events or conditions that arenot yet known.