Embed Size (px)
Citation preview

VICTORIA OIL & GAS PLC
UNAUDITED INTERIM CONDENSED CONSOLIDATED
FINANCIAL STATEMENTS FOR THE SIX MONTHS TO
30 NOVEMBER 2014

2
CHAIRMAN’S STATEMENT
Dear Shareholder, On behalf of the Board I am pleased to report our unaudited results for the six months to 30 November 2014 and to update you on company developments beyond the financial period. During the six months to 30 November 2014, the Group’s objectives were to:
Increase gas production and to make Gaz du Cameroun S.A. (“GDC”) operationally cash positive;
Strengthen our Board and corporate profile;
Stabilise operations and processes and develop our people within the Group;
Build strong working relationships with our Logbaba partners RSM Production Corporation (“RSM”) and Société Nationale des Hydrocarbures (“SNH”);
Secure major new supply contracts involving power generation for the National Grid in Cameroon. The management teams of Victoria Oil & Gas Plc (“VOG” or “the Company”) and GDC excelled during 2014, meeting all of the above objectives for the reporting period and delivering positive results in the areas of engineering, sales and corporate developments. Logbaba Gas Project, Cameroon Following extensive planning and negotiations during the reporting period, GDC signed a legally binding term sheet with ENEO Cameroon S.A. ("ENEO"), Cameroon's integrated utility company, in late December 2014, to supply gas to two power stations, located in the city of Douala. Logbaba and Bassa power stations will generate up to 50MW from Gensets, supplied by Altaaqa Alternative Solutions Projects DWC-LLC (“Altaaqa”). The agreement includes ‘take-or-pay’ consumption rates and allows GDC to establish a secure level of gas sales at an attractive price of $9/mmbtu. The power stations’ minimum gas consumption will be approximately 9mmscf/d in the January-June dry season and 3mmscf/d in the July-December wet season. The contract is for two years and extendable by mutual agreement. This project could treble GDC’s current gas production. We expect average annual production for the 2015 calendar year to be about 10.4mmscf/d. In the release of our 2014 Annual Report we quoted our 7 day week July 2014 production of 3.9mmscf/d at GDC. Since then, from August 2014 to January 2015 inclusive, our monthly average daily rate based on a 7 day week has ranged from 3.9 to 4.4mmscf/d. For the same period our monthly average daily rate based on a 5 day working week has ranged from 4.1 to 4.6mmscf/d and the monthly daily peak production rates have ranged from 4.5 to 5.3mmscf/d. I am proud to report that GDC has substantially completed its scope of work for the ENEO project construction phase and safely built and tested gas pipelines to both stations. We have issued a completion certificate for the Bassa station and expect to complete the Logbaba station within two weeks. The project is scheduled to be online by the end of Q1 2015 and if this is achieved, as we expect, it will represent a remarkable success for the GDC, ENEO and Altaaqa teams. Progressing from signing legally binding terms sheets in late December 2014 to delivering 50MW to the grid approximately three months later is outstanding. The period was not without its challenges, such as securing the release of gas-fired electricity generations sets (“Gensets”) from the local customs and the delay on the Wouri River crossing. However GDC now has access to a wide base of thermal gas customers on the Bonaberi side of the river. GDC is also in the process of making final connections to the Dangote cement plant, a business located on the Douala shore and a major thermal supply customer. Total pipe laid to date in Douala is now 31.3km. During the period, VOG maintained a good working relationship with Logbaba Field development partners RSM and SNH. Following a settlement agreement between VOG and RSM in January 2014, a cost review process overseen by Akintola Williams Deloitte, Nigeria was undertaken to look at retrospective development expenditure. The review resulted in RSM paying significant development contributions ($10.1 million) and both companies are now working together to unlock the full potential of the Logbaba Field. An additional $6.9 million was received from RSM in February 2015. One of the most important tasks undertaken during 2014 was the development of our people. At the beginning of the reporting period, we appointed a business-training company, Gallop Solutions International Ltd, to work with us to create an effective workforce with the right skill sets to deliver value for VOG. Our teams within VOG and GDC are now a cohesive, effective team working to build cash flow and a brand synonymous with safe, reliable gas supply.

3
Post period, in January 2015, the GDC subsurface team successfully conducted a rigless workover of Well La-106. The work utilised specialist coiled tubing, high-pressure pumping and wireline equipment to perform cement remediation work on the well. Initial well flow-tests of Well La-106 were at 5 to 6mmscf/d and the well can provide back-up for Well La-105. In February 2015, we took the opportunity to utilise the specialist equipment and personnel used on the Well La-106 workover to add perforations to Well La-105. We perforated the sands above the Upper Logbaba D Sand, which has been our main producing reservoir in La-105 since start-up. In total, 57 metres of additional perforations were shot. After shooting the perforations, a production log was run in Well La-105 to determine the contributions of the new zones to flow and a baseline for future logs. The newly perforated zones are performing well and will significantly contribute to production in the future as the lower sands deplete. The Company is also making plans for the drilling of future wells at Logbaba that are aimed at increasing reserves and production to meet the growing gas demand in Cameroon. In operations, VOG will make a number of key decisions over the next six months concerning where best to allocate gas supply. With strong increased demand rates expected in the first half of 2015, through the ENEO deal, the Board is now looking at the most effective ways to increase both margin and consumption within GDC. Corporate Developments In addition to developing our operational capabilities, we have taken significant steps to enhance our corporate structure and profile. VOG strengthened its Board of Directors with the appointment of James McBurney who joined the Board as an independent Non-Executive Director in June. James has over 25 years' experience advising many of the U.S.'s largest power and gas companies. John Bryant was also appointed as an independent Non-Executive Director in December 2014. John has commercial and financial experience in developing and managing new businesses with over 40 years' experience in the oil, gas and energy services, both in the U.S. and the U.K. These appointments give the VOG Board important and valuable independent guidance. During October 2014, Numis Securities Ltd (“Numis”) was appointed as sole broker to VOG. Numis is one of the premier broking houses in London and we are working closely with their team to provide the market with guidance on VOG, with the intention of building further investor support as we expand operations. After consulting with Numis and a number of other advisors and institutional investors we took the decision to conduct a 40 to 1 share consolidation in the Company’s equity. Following the fundraisings from 2011 to 2013, which were needed to support the commercialisation of the Logbaba project, VOG had over four billion shares on issue and this was felt to be unattractive to potential investors. We implemented the consolidation and sub-division of the Company’s share capital effective 27 November 2014, following shareholder approval granted at the AGM. Since then, the Company has announced consistent positive news flow and our share price has performed solidly despite very challenging equity markets. West Medvezhye, Russia The Company has continued to pursue ways to derive value for its 100%-owned West Medvezhye field, Russia, through farm-out, joint venture or sale. West Medvezhye has significant gas and gas condensate reserves but the current state of relations between Russia and the West, combined with a low oil price, makes near-term development of the asset challenging and divestiture is a more prudent course. With our focus on the expanding operations in Cameroon, the Board has taken the decision to fully impair the Russian asset, writing it down by $49.8 million. The Company will continue to seek partners to derive value from the asset. I would like to thank the Board and our teams for their work and also our shareholders who have been supportive, allowing us to drive the Group forward to where it is today. I believe 2015 will be a year when GDC is able to expand its gas sales within a region in great need of reliable sources of energy. Kevin Foo Executive Chairman 27 February 2015

4
FINANCIAL REVIEW
Revenue and Results The Group’s revenue for the period was $11.6 million, compared to $6.0 million for the six months to 30 November 2013 and adjusted EBITDA (shown below) increased by $1.2 million. In all relevant periods, the revenue was derived from the Logbaba gas and condensate field in Cameroon. The primary revenue stream was gas sold to industrial customers for thermal energy production and electricity generation, with revenue also generated from the sale of condensate, a by-product from gas production and processing. The total gas sold during the period was 716mmscf, and 13,221bbls of condensate were produced. While gas prices remained unchanged throughout the period because of the fixed price contracts we have with our customers, the global downturn in oil prices has negatively affected the condensate sales price, as this is linked directly to the price of Brent Crude. The loss on ordinary activities after taxation of the Group for the six months to 30 November 2014 amounted to $53.4 million (six months to 30 November 2013: $2.5 million profit; year ended 31 May 2014: $1.7 million loss). The current period loss includes an impairment charge of $49.8 million against the Group’s Russian asset, discussed in more detail below and in Note 5. It should also be noted that the comparative period results included historical adjustments as a consequence of the decision in the arbitration between the Group and RSM Production Corporation (“RSM”). The adjustments reflect RSM’s share of prior period operating expenses, as the arbitration decision was that RSM had not forfeited its 40% interest in the Logbaba gas and condensate project. The Directors believe that EBITDA (net of this adjustment and the impairment provision) provides context for the results in the current period and comparative periods.
6 months ended
30 November 2014
6 months ended
30 November 2013
12 months ended
31 May 2014
EBITDA net of RSM arbitration and impairment adjustments $1.4 million $0.2 million ($5.8 million)
Impairment of Russian Asset (West Medvezhye) At the end of the current period, the Directors took the decision to fully impair the Group’s exploration and evaluation asset, being the Russian West Medvezhye (“West Med”) asset. The impairment increased the loss for the period by $49.8 million, with corresponding balance sheet reductions of the same value. The impairment provision was made as it was considered that the political issues in Russia, combined with the weakness in the world price of oil, make realising the carrying value of the asset through the current marketing process significantly more difficult. Balance Sheet Intangible Assets The West Med exploration and evaluation asset was fully impaired at the end of the period, as described above and in Note 5. Unlisted investments The movement in unlisted investments relates to the repayment to the Company of loans that were acquired as part of the original investment. Deferred tax assets As a result of the taxable profits generated by the Cameroon segment during the period, the deferred tax asset was reduced by $1.6 million and a corresponding debit to income tax expense was recorded on the income statement. Trade and other receivables Trade and other receivables at 30 November 2014 included $18.2 million due from RSM. This relates to RSM’s funding obligation for its 40% participating interest in the Logbaba Concession. It reflects RSM’s share of all assets, liabilities and costs relating to the Logbaba concession in the post-exploration period. Following the end of the period, $17.0 million was received from RSM. The period end receivable balance includes a further $1.2 million, which remains outstanding at the date of publication of these results. Further details are provided in the ‘Cash Flow’ section below and in Note 10.

5
Translation reserve The devaluation of the Russian Rouble resulted in an $8.3 million movement in the translation reserve. The translation reserve movements arose because the financial accounts of the Group’s Russian subsidiary are maintained in Russian Roubles. Cash Flow Operating activities The Group’s operations in Cameroon are conducted through a joint operation with RSM. During the period under review, RSM did not make any payments for its 40% share of project expenditures, with all such payments from RSM suspended pending the issue of a final report by Akintola Williams Deloitte, Nigeria (“Deloitte Nigeria”) (refer Note 10). The Group was required to fund 100% of the operational cash flows, and therefore the cash used in operating activities was substantially more than the Group’s share. As reported in Note 10, the claim against RSM was resolved subsequent the end of the period, and RSM settled the amounts owing for the period covered by Deloitte Nigeria’s report ($10.1 million). An additional $6.9 million was received from RSM in February 2015 for its share of incurred expenses subsequent to the period covered by Deloitte Nigeria’s report. The period end receivable balance includes a further $1.2 million, which remains outstanding at the date of publication of these results. Investing activities Investing activities related primarily to the expansion of the pipeline network in Cameroon, with payments of $3.7 million for property, plant and equipment (six months to 30 November 2013: $9.5 million). Additionally, the Company received $1.4 million from its unlisted investments, in the form of loan repayments. Financing activities Financing cash flows in the period related solely to the repayment of debts. Going Concern The Directors are satisfied that the Group has sufficient resources to continue operations for the foreseeable future, being a period of not less than twelve months from the date of this report. Accordingly, they continue to adopt the going concern basis in preparing the condensed financial information. Robert Palmer Finance Director 27 February 2015

6
UNAUDITED CONDENSED CONSOLIDATED INCOME STATEMENT
FOR THE SIX MONTHS ENDED 30 NOVEMBER 2014
6 months ended
30 November 2014
6 months ended
30 November 2013
12 months ended
31 May 2014
Unaudited Unaudited Audited Notes $000 $000 $000 Continuing operations 3
Revenue 11,562 6,014 14,729 Cost of sales Production royalties (2,441) (1,928) (3,953) Other cost of sales (5,947) (2,906) (6,295)
(8,388) (4,834) (10,248)
Gross profit 3,174 1,180 4,481 Other income 103 4 11 Sales and marketing expenses (872) (817) (620) Administrative expenses (5,032) (1,700) (9,303) Other gains/(losses) 820 (130) (3,978) Impairment of exploration and evaluation assets 5 (49,775) – – Adjustment resulting from arbitration decision – 5,169 6,543
Operating profit/(loss) (51,582) 3,706 (2,866) Finance revenue 19 142 146 Finance costs (173) (1,308) (2,004)
Profit/(loss) before taxation (51,736) 2,540 (4,724) Income tax (expense)/credit (1,652) – 3,059
Profit/(loss) after taxation for the period (53,388) 2,540 (1,665)
Cents
Cents
Cents
Earnings/(loss) per share – basic 4 (50.73) 2.47* (1.58)* Earnings/(loss) per share – diluted 4 (50.73) 2.47* (1.58)*
*Comparative period earnings/(loss) per share has been restated as a result of the Capital Reorganisation detailed in Note 8.
UNAUDITED CONDENSED CONSOLIDATED STATEMENT OF COMPREHENSIVE INCOME
FOR THE SIX MONTHS ENDED 30 NOVEMBER 2014
6 months ended
30 November 2014
6 months ended
30 November 2013
12 months ended
31 May 2014
Unaudited Unaudited Audited
$000 $000 $000 Profit/(loss) for the financial period (53,388) 2,540 (1,665) Exchange differences on translation of foreign operations (8,331) (1,702) 1,348
Total comprehensive income/(loss) for the period (61,719) 838 (317)

7
UNAUDITED CONDENSED CONSOLIDATED BALANCE SHEET AS AT 30 NOVEMBER 2014
30 November
2014 30 November
2013 31 May
2014 Unaudited Unaudited Audited
Notes $000 $000 $000 Assets: Non-current assets
Intangible assets 6 27 58,035 57,797 Property, plant and equipment 7 122,168 121,680 121,772 Unlisted investments 5,155 6,600 6,600 Deferred tax assets 1,668 – 3,297
129,018 186,315 189,466
Current assets
Inventories 38 13 38 Trade and other receivables 24,080 30,337 14,026 Cash and cash equivalents 5,809 1,372 17,018
29,927 31,722 31,082
Total assets 158,945 218,037 220,548
Liabilities: Current liabilities
Trade and other payables 10,505 12,458 12,452 Borrowings 12,367 6,964 10,563
22,872 19,422 23,015
Net current assets/(liabilities) 7,055 12,300 8,067
Non-current liabilities
Borrowings 30 247 86 Deferred tax liabilities 6,599 6,599 6,599 Provisions 9,791 9,325 9,551
16,420 16,171 16,236
Net assets 119,653 182,444 181,297
Equity:
Called-up share capital 8 34,240 34,240 34,240 Share premium 229,556 229,556 229,556 ESOP Trust reserve (1,090) (1,138) (1,165) Translation reserve (18,394) (13,113) (10,063) Other reserves 4,062 4,162 4,197 Retained earnings – deficit (128,721) (71,263) (75,468)
Total equity 119,653 182,444 181,297

8
UNAUDITED CONDENSED CONSOLIDATED STATEMENT OF CHANGES IN EQUITY
FOR THE SIX MONTHS ENDED 30 NOVEMBER 2014
Share
capital Share
premium
ESOP Trust
reserve Translation
reserve Other
reserve
Retained earnings /
(accumulated deficit) Total
$000 $000 $000 $000 $000 $000 $000
At 31 May 2013 34,240 229,556 (1,061) (11,411) 4,583 (74,504) 181,403
Exchange adjustments – – (77) – – – (77)
Transfer expired warrants to retained earnings – – – – (701) 701 –
Warrants issued – – – – 280 – 280
Total comprehensive income/(loss) for the period – – – (1,702) – 2,540 838
At 30 November 2013 34,240 229,556 (1,138) (13,113) 4,162 (71,263) 182,444
Exchange adjustments – – (27) – – – (27)
Warrants issued – – – – 35 – 35
Total comprehensive income/(loss) for the period – – – 3,050 – (4,205) (1,155)
At 31 May 2014 34,240 229,556 (1,165) (10,063) 4,197 (75,468) 181,297
Exchange adjustments – – 75 – – – 75
Transfer expired warrants to retained earnings – – – – (135) 135 –
Total comprehensive income/(loss) for the period – – – (8,331) – (53,388) (61,719)
At 30 November 2014 34,240 229,556 (1,090) (18,394) 4,062 (128,721) 119,653

9
UNAUDITED CONDENSED CONSOLIDATED CASH FLOW STATEMENT
FOR THE HALF YEAR ENDED 30 NOVEMBER 2014
6 months Ended
30 November 2014
6 months Ended
30 November 2013
12 months Ended
31 May 2014
Unaudited Unaudited Audited $000 $000 $000
Cash flows from operating activities
Profit/(loss) for the period (53,388) 2,540 (1,665) Income tax expense/(credit) recognised in the Income Statement 1,629 - (3,059) Finance revenue recognised in the Income Statement (19) (142) (146) Finance costs recognised in the Income Statement 141 1,308 2,004 Depreciation and amortisation of non-current assets 3,517 2,149 4,608 Other (gains)/losses recognised in the Income Statement (820) 130 3,978 Impairment of exploration and evaluation assets 49,775 – – Adjustment relating from arbitration decision – (5,169) –
835 816 5,720 Movements in working capital
(Increase)/decrease in trade and other receivables (10,688) (5,434) 4,727 (Increase)/decrease in inventories – 21 (4) Increase/(decrease) in trade and other payables 2,312 3,571 3,140
Net cash (used in)/generated from operating activities (7,541) (1,026) 13,583 Cash flows from investing activities
Proceeds from disposal of intangible assets – – 115 Payments for intangible assets (207) – (752) Payments for property, plant and equipment (3,688) (9,451) (10,807) Loan repayments received 1,445 – – Interest received 19 11 15
Net cash used in investing activities (2,431) (9,440) (11,429) Cash flows from financing activities
Proceeds from borrowings – 438 5,234 Repayment of borrowings (958) (1,676) (3,140) Finance costs (376) (268) (493)
Net cash generated from financing activities (1,334) (1,506) 1,601
Net (decrease)/increase in cash and cash equivalents (11,306) (11,972) 3,755
Cash and cash equivalents – beginning of the period 17,018 13,107 13,107 Effects of exchange rate changes on the balance of cash held in foreign currencies 97 237 156
Cash and cash equivalents – end of the period 5,809 1,372 17,018

10
NOTES TO THE UNAUDITED INTERIM CONDENSED CONSOLIDATED FINANCIAL STATEMENTS FOR THE SIX MONTHS ENDED 30 NOVEMBER 2014 1. GENERAL INFORMATION AND BASIS OF PREPARATION The unaudited interim condensed consolidated financial statements of Victoria Oil & Gas Plc and its subsidiaries (“the Group”) for the six months ended 30 November 2014 have been prepared in accordance with International Financial Reporting Standards (“IFRSs”) and in accordance with International Accounting Standard (“IAS”) 34 Interim Financial Reporting. The interim condensed consolidated financial statements do not include all the information and disclosures required in the annual financial statements and should be read in conjunction with the Group's annual consolidated financial statements as at 31 May 2014. 2. ACCOUNTING POLICIES The accounting policies adopted in the preparation of the interim condensed consolidated financial statements are consistent with those followed in the preparation of the Group's annual consolidated financial statements for the year ended 31 May 2014, with the exception of the following: Adoption of new and revised Standards The following new and revised Standards have been mandatorily adopted by the Group during the period. Their adoption has not had a material impact on the financial statements of the Group. Name of new Standards/Amendments Effective from IFRS 10 Consolidated Financial Statements 1 January 2014 IFRS 11 Joint Arrangements 1 January 2014 IFRS 12 Disclosure of Interests in Other Entities 1 January 2014 IAS 27 (revised 2011) Separate Financial Statements 1 January 2014 IAS 28 (revised 2011) Investments in Associates and Joint Ventures 1 January 2014 Amendments to IAS 32 Offsetting Financial Assets and Financial Liabilities 1 January 2014 Amendments to IFRS 10, IFRS 12, and IAS 27 Investment Entities 1 January 2014 Amendments to IAS 36 Recoverable Amount Disclosures for Non-Financial Assets 1 January 2014 Amendments to IAS 39 Novation of Derivatives and Continuation of Hedge Accounting 1 January 2014
3. SEGMENTAL ANALYSIS The Group has one class of business: oil and gas exploration, development and production and the sale of hydrocarbons and related activities. This is analysed on a location basis. Only the Cameroon segment is generating revenue, which is from the sale of hydrocarbons. The accounting policies of the reportable segments are the same as the Group’s accounting policies.

11
The following tables present revenue, profit/(loss) and certain asset and liability information regarding the Group’s business segments: Six months to 30 November 2014 (Unaudited)
Cameroon $000
Russia $000
Kazakhstan $000
Corporate $000
Total $000
Revenue 11,562 – – – 11,562 Production royalties (2,441) – – – (2,441) Other cost of sales (5,947) – – – (5,947)
Gross profit 3,174 – – – 3,174
Other income 103 – – – 103
Sales and marketing expenses (872) – – – (872) Administrative expenses (2,832) (106) (143) (1,951) (5,032)
Other gains and (losses) 596 – 256 (32) 820
Impairment of exploration and evaluation assets – (49,775) – – (49,775)
Operating profit/(loss) 169 (49,881) 113 (1,983) (51,582)
Finance revenue – – – 19 19 Finance costs – (13) – (160) (173)
Profit/(loss) before taxation 169 (49,894) 113 (2,124) (51,736)
Income tax expense (1,547) – – (105) (1,652)
Profit/(loss) after taxation for the financial period (1,378) (49,894) 113 (2,229) (53,388)
Total assets 147,595 29 90 11,231 158,945
Total liabilities (33,922) (278) (11) (5,081) (39,292)
Six months to 30 November 2013 (Unaudited)
Cameroon $000
Russia $000
Kazakhstan $000
Corporate $000
Total $000
Revenue 6,014 – – – 6,014 Production royalties (1,928) – – – (1,928) Other cost of sales (2,906) – – – (2,906)
Gross profit 1,180 – – – 1,180
Other income 4 – – – 4
Sales and marketing expenses (817) – – – (817) Administrative expenses (113) (115) (135) (1,337) (1,700)
Other gains and (losses) (51) – (295) 216 (130)
Adjustment resulting from arbitration decision 5,169 – – – 5,169
Operating profit/(loss) 5,372 (115) (430) (1,121) 3,706
Finance revenue – – – 142 142 Finance costs (667) (14) – (627) (1,308)
Profit/(loss) before taxation 4,705 (129) (430) (1,606) 2,540
Income tax expense – – – – –
Profit/(loss) after taxation for the financial period 4,705 (129) (430) (1,606) 2,540
Total assets 158,831 57,793 103 1,310 218,037
Total liabilities (26,803) (412) (3) (8,375) (35,593)

12
Twelve months to 31 May 2014 (Audited)
Cameroon $000
Russia $000
Kazakhstan $000
Corporate $000
Total $000
Revenue 14,729 – – – 14,729 Production royalties (3,953) – – – (3,953) Other cost of sales (6,295) – – – (6,295)
Gross profit 4,481 – – – 4,481
Other income 11 – – – 11 Sales and marketing expenses (620) – – – (620) Administrative expenses (4,667) (251) (250) (4,135) (9,303) Other losses (70) (57) (3,098) (753) (3,978) Adjustment resulting from arbitration decision 6,543 – – – 6,543
Operating profit/(loss) 5,678 (308) (3,348) (4,888) (2,866)
Finance revenue – – – 146 146 Finance costs (1,105) (28) – (871) (2,004)
Profit/(loss) before taxation 4,573 (336) (3,348) (5,613) (4,724)
Income tax credit 3,059 – – – 3,059
Profit/(loss) after taxation for the financial year 7,632 (336) (3,348) (5,613) (1,665)
Total assets 147,615 57,630 88 15,215 220,548
Total liabilities (32,831) (364) (12) (6,044) (39,251)
4. EARNINGS/(LOSS) PER SHARE Basic earnings or loss per share is computed by dividing the profit or loss after tax for the year available to ordinary shareholders by the weighted average number of ordinary shares in issue and ranking for dividend during the year, excluding those held by the ESOP Trust. Diluted earnings or loss per share is computed by dividing the profit or loss after taxation for the period by the weighted average number of ordinary shares in issue, each adjusted for the effect of all dilutive potential ordinary shares that were outstanding during the period. The following table sets forth the computation for basic and diluted loss per share.
30 November 30 November 31 May 2014 2013 2014 Unaudited Unaudited Audited
$000 $000 $000 Numerator: Numerator for basic and diluted earnings/(loss) per share – earnings/(loss) for the period (53,388) 2,540 (1,665)
Number
Number Number Denominator: Denominator for basic and diluted earnings/(loss) per share 105,232,684 102,707,481* 105,232,532*
Cents
Cents Cents
Earnings/(loss) per share – basic and diluted (50.73) 2.47* (1.58)*
*Comparative period earnings/(loss) per share has been restated as a result of the Capital Reorganisation detailed in Note 8. Basic and diluted loss per share are the same, as the effect of any potential shares is anti-dilutive and is therefore excluded.

13
5. IMPAIRMENT OF EXPLORATION AND EVALUATION ASSETS 30 November 30 November 31 May 2014 2013 2014 Unaudited Unaudited Audited
$000 $000 $000 Impairment of carrying value of West Med license interest: Intangible assets (Note 6) 49,702 – – Property, plant and equipment (Note 7) 52 – – Current assets 21 – –
49,775 – –
The Directors tested the Group’s Russian exploration and evaluation asset, West Med, for impairment as at 30 November 2014, and took the view that it would be prudent to fully impair the asset. Whilst the Directors continue to seek avenues for deriving value from West Med, through farm-out, joint venture or sale, it was considered that the political issues in Russia, combined with the weakness in the world price of oil, make realising the carrying value of the asset significantly more difficult. Because of this level of uncertainty, it was difficult for the Directors to form a view on the value that the asset should be held at in the accounts. The Directors have taken the decision to completely write down the asset, given the uncertainties regarding its monetisation. There may be an adjustment in future periods, depending on the outcome of current efforts to derive value from the asset. 6. INTANGIBLE ASSETS Six months to 30 November 2014 (Unaudited) Exploration
and evaluation
assets Software Total Cost $000 $000 $000
Opening balance 91,597 62 91,659 Exchange adjustments (8,286) – (8,286) Transfer to property, plant and equipment (299) – (299) Additions 207 – 207
Closing balance 83,219 62 83,281
Accumulated amortisation and impairment
Opening balance 33,834 28 33,862 Exchange adjustments (290) – (290) Transfer to property, plant and equipment (27) – (27) Provision for impairment (Note 5) 49,702 – 49,702 Charge for the period – 7 7
Closing balance 83,219 35 83,254
Carrying amount 30 November 2014 – 27 27

14
Six months to 30 November 2013 (Unaudited) Exploration and
evaluation assets Software Total
Cost $000 $000 $000
Opening balance 93,838 104 93,942 Transfer to other receivables (199) (42) (241) Exchange adjustments (2,106) – (2,106) Additions 402 – 402
Closing balance 91,935 62 91,997
Accumulated amortisation and impairment
Opening balance 33,948 24 33,972 Transfer to other receivables (12) (10) (22) Charge for the period 5 7 12
Closing balance 33,941 21 33,962
Carrying amount 30 November 2013 57,994 41 58,035
Twelve months to 31 May 2014 (Audited) Exploration
and evaluation
assets Software Total Cost $000 $000 $000
Opening balance 93,838 104 93,942 Adjustment resulting from arbitration decision (199) (42) (241) Exchange adjustments (2,737) – (2,737) Additions 883 – 883 Disposals (172) – (172)
Closing balance 91,613 62 91,675
Accumulated amortisation and impairment
Opening balance 33,948 24 33,972 Adjustment resulting from arbitration decision (11) (10) (21) Exchange adjustments (97) – (97) Charge for the year 10 14 24
Closing balance 33,850 28 33,878
Carrying amount 31 May 2014 57,763 34 57,797
Segmental Analysis Six months to 30 November 2014 (Unaudited) Cameroon Russia Total
$000 $000 $000
Opening balance 314 57,483 57,797 Exchange – (7,996) (7,996) Transfer to property, plant and equipment (272) – (272) Additions – 207 207 Provision for impairment (Note 5) – (49,702) (49,702) Charge for the period (15) 8 (7)
Closing balance 27 – 27
Six months to 30 November 2013 (Unaudited) Cameroon Russia Total
$000 $000 $000
Opening balance 558 59,412 59,970 Transfer to other receivables (219) – (219) Exchange – (2,106) (2,106) Additions – 402 402 Charge for the period (12) – (12)
Closing balance 327 57,708 58,035
15
Twelve months to 31 May 2014 (Audited) Cameroon Russia Total
$000 $000 $000
Opening balance 558 59,412 59,970 Adjustment resulting from arbitration decision (220) – (220) Exchange – (2,640) (2,640) Additions – 883 883 Disposals – (172) (172) Charge for the year (24) – (24)
Closing balance 314 57,483 57,797
An impairment provision was made in the year against the West Med asset in Russia. The provision is described in detail in Note 5.
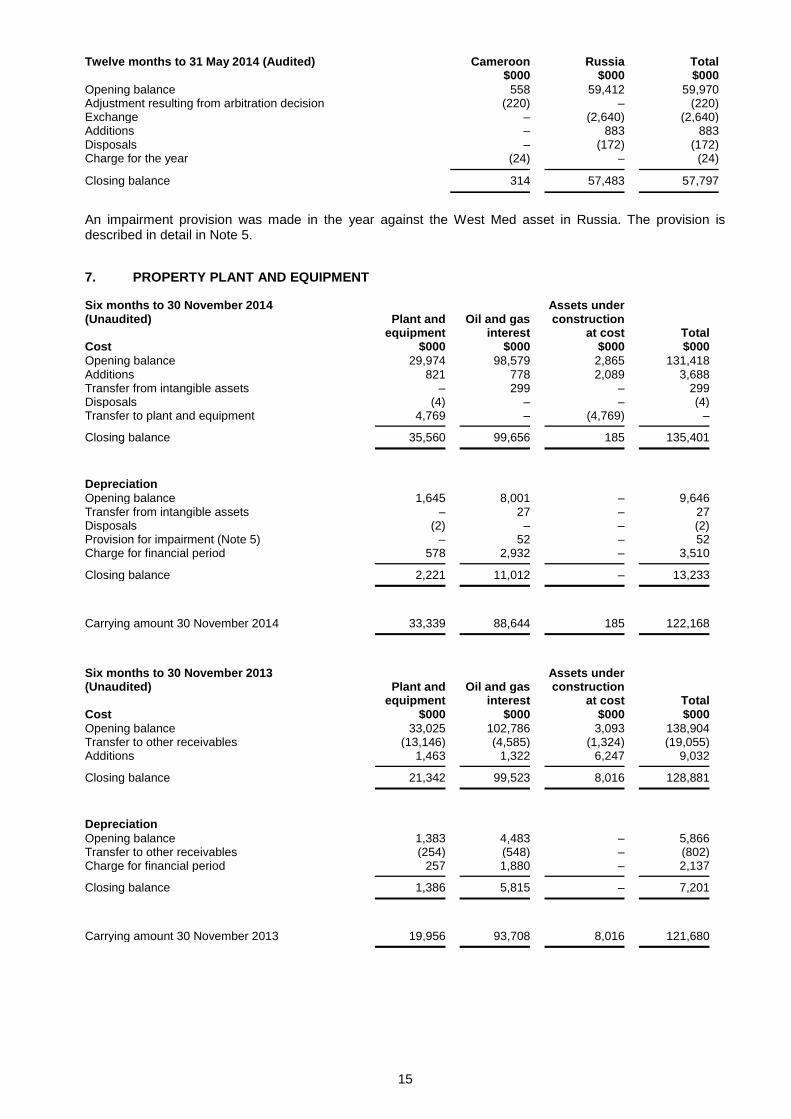
7. PROPERTY PLANT AND EQUIPMENT Six months to 30 November 2014 (Unaudited)
Plant and
equipment Oil and gas
interest
Assets under construction
at cost Total Cost $000 $000 $000 $000
Opening balance 29,974 98,579 2,865 131,418 Additions 821 778 2,089 3,688 Transfer from intangible assets – 299 – 299 Disposals (4) – – (4) Transfer to plant and equipment 4,769 – (4,769) –
Closing balance 35,560 99,656 185 135,401
Depreciation
Opening balance 1,645 8,001 – 9,646 Transfer from intangible assets – 27 – 27 Disposals (2) – – (2) Provision for impairment (Note 5) – 52 – 52 Charge for financial period 578 2,932 – 3,510
Closing balance 2,221 11,012 – 13,233
Carrying amount 30 November 2014 33,339 88,644 185 122,168
Six months to 30 November 2013 (Unaudited)
Plant and
equipment Oil and gas
interest
Assets under construction
at cost Total Cost $000 $000 $000 $000
Opening balance 33,025 102,786 3,093 138,904 Transfer to other receivables (13,146) (4,585) (1,324) (19,055) Additions 1,463 1,322 6,247 9,032
Closing balance 21,342 99,523 8,016 128,881
Depreciation
Opening balance 1,383 4,483 – 5,866 Transfer to other receivables (254) (548) – (802) Charge for financial period 257 1,880 – 2,137
Closing balance 1,386 5,815 – 7,201
Carrying amount 30 November 2013 19,956 93,708 8,016 121,680

16
Twelve months to 31 May 2014 (Audited)
Plant and equipment
Oil and gas interest
Assets under construction
at cost Total Cost $000 $000 $000 $000
Opening balance 33,025 102,786 3,093 138,904 Adjustment resulting from arbitration decision (12,151) (4,966) (1,167) (18,284) Additions 283 759 9,765 10,807 Transfer to plant and equipment – – (8,826) (8,826) Transfer from assets under construction 8,826 – – 8,826 Disposals (9) – – (9)
Closing balance 29,974 98,579 2,865 131,418
Depreciation
Opening balance 1,383 4,483 – 5,866 Adjustment resulting from arbitration decision (249) (548) – (797) Disposals (7) – – (7) Charge for the year 518 4,066 – 4,584
Closing balance 1,645 8,001 – 9,646
Carrying amount 31 May 2014 28,329 90,578 2,865 121,772
Segmental Analysis Six months to 30 November 2014 (Unaudited) Cameroon Russia Corporate Total
$000 $000 $000 $000
Opening balance 121,703 52 17 121,772 Additions 2,748 – 4 2,752 Transfer from intangible assets 272 – – 272 Disposals – – (2) (2) Provision for impairment (Note 5) – (52) – (52) Charge for the period (2,570) – (4) (2,574)
Closing balance 122,153 – 15 122,168
Six months to 30 November 2013 (Unaudited) Cameroon Russia Corporate Total
$000 $000 $000 $000
Opening balance 132,974 52 12 133,038 Transfer to other receivables (18,253) – – (18,253) Additions 9,032 – – 9,032 Charge for the period (2,134) – (3) (2,137)
Closing balance 121,619 52 9 121,680
Twelve months to 31 May 2014 (Audited)
Cameroon Russia Corporate Total
$000 $000 $000 $000
Opening balance 132,974 52 12 133,038 Transfer to other receivables (17,487) – – (17,487) Additions 10,792 – 15 10,807 Disposals – – (2) (2) Charge for the period (4,576) – (8) (4,584)
Closing balance 121,703 52 17 121,772
Oil and gas assets are depreciated on a unit-of-production basis. Assets under construction comprise of expenditure on the uncompleted sections of the pipeline network and surface infrastructure on the Logbaba gas and condensate project in Cameroon.

17
8. CALLED-UP SHARE CAPITAL At the Annual General Meeting held on 26 November 2014, the Company sought shareholder approval for a consolidation and sub-division of the Company’s share capital (“Capital Reorganisation”). The shareholders passed the resolution, and as of 27 November 2014, the new shares were admitted to trading on AIM. As a result of the Capital Reorganisation, shareholders received one consolidated ordinary share of 20 pence for every 40 ordinary shares of 0.5 pence (“Consolidation”). Immediately following the Consolidation, each consolidated ordinary share was subdivided into one new ordinary share of 0.5 pence and one new deferred share of 19.5 pence. Prior to the Capital Reorganisation, the Company’s ordinary share capital consisted of 4,348,552,329 ordinary shares of 0.5 pence, and subsequent to the Capital Reorganisation, the Company’s ordinary share capital consists of 108,713,809 ordinary shares of 0.5 pence with voting rights listed on AIM and 108,713,809 deferred shares of 19.5 pence with no voting rights. 9. RELATED PARTY TRANSACTIONS Payments to Directors and other key management personnel are set out below.
30 November
2014 30 November
2013 31 May
2014 Unaudited Unaudited Audited $000 $000 $000
Directors' remuneration – cash payments 1,183 716 1,792 Other key management – short term benefits 135 687 450 Other key management – professional fees 714 242 585
Key management personnel includes personnel who act as consultants to the Group, and who are not employees. These accounts include $0.7 million of professional fees for such consultants (six months to 30 November 2013: $0.2 million; twelve months to 31 May 2014: $0.6 million). The following table provides details of other transactions entered into by the Company with its subsidiaries and by the Group with other related parties:
Company transactions
with subsidiaries
Directors’ other
interests
Key management
personnel $000 $000 $000 6 months to 30 November 2014 (Unaudited)
Investment in subsidiaries 12,498 – – Purchases from/(recharges to) related parties during the period (245) – 714 Cash advances to/(from) related parties during the year (5,175) (5) – Amounts due from/(to) related parties at the end of the period 108,175 – – 6 months to 30 November 2013 (Unaudited)
Investment in subsidiaries 29,789 – – Advances to subsidiaries 42,379 – – Purchases from/(recharges to) related parties during the period (993) – 242 Cash advances to/(from) related parties during the year (193) – – Amounts due from/(to) related parties at the end of the period 120,799 – (429) 12 Months to 31 May 2014 (Audited) – Investment in subsidiaries 29,789 – – Advances to subsidiaries 42,849 – – Purchases from/(recharges to) related parties during the year (1,342) 5 432 Cash advances to/(from) related parties during the year (7,983) 13 – Amounts due from/(to) related parties at the year end 113,009 – – Amounts due from subsidiaries are non-interest bearing loans repayable on demand. The balance of the amounts due from subsidiaries at 30 November 2014 is stated net of a provision against the amounts due from Victoria Energy Central Asia LLP of $17.6 million and Victoria Oil and Gas Central Asia Limited of $4.5 million (30 November 2013: $17.5 million and $5.2 million; 31 May 2014: $17.6 million and $5.1 million).

18
Amounts due from the Company’s Russian subsidiary, ZAO SeverGas-Invest (“SGI”), are recorded as ‘Advances to subsidiaries’ and considered part of the Company’s net investment in the Russian operations, as settlement is neither planned nor likely in the foreseeable future. As a result of the impairment of West Med (refer Note 5), a provision of $43.2 million was made during the period against the balance due to the Company by SGI, reducing the balance to nil. Additionally, the Company’s investment in subsidiaries is stated net of a provision of $17.3 million against the Company’s investment in SGI. There was no intergroup trading or transactions between Group subsidiaries. 10. POST BALANCE SHEET EVENTS Board Appointments John Bryant was appointed as an independent non-executive director effective 1 December 2014. Deloitte Nigeria Audit Results and Receipt of RSM Funds In the Annual Report for the year ended 31 May 2014, the history of the arbitration between the Group and RSM was described in detail. As at the date of publishing the Annual Report, Deloitte Nigeria had not issued its final report on the billing statement issued by the Group to RSM for its share of incurred expenses from inception of the Logbaba gas project to 31 December 2013 and the advance cash call for RSM’s share of January 2014 expenses. Deloitte Nigeria had been appointed by RSM and the Group jointly under a settlement agreement announced in January 2014. On 11 December 2014, the Company announced that the final report had been issued by Deloitte Nigeria and that RSM was due to pay $10.1 million to the Group. As at 11 December 2014, RSM had transferred $3.7 million of the amount owing. On 8 January 2015, the Company made a further announcement that the balance payment from RSM had been received. A further $6.9 million was received in February 2015 for RSM’s share of incurred expenses subsequent to the period covered by Deloitte Nigeria’s report. The period end receivable balance includes a further $1.2 million that remains outstanding at the date of publication of these results 11. APPROVAL OF INTERIM FINANCIAL STATEMENTS The unaudited interim condensed consolidated financial statements were approved by the Board of Directors on 27 February 2015. Copies of the Interim report are available by download from the Company’s website at: www.victoriaoilandgas.com