Embed Size (px)
Citation preview

Institutional PresentationMay 2016
2
This information is property of Wilson Sons and can not be used or reproduced without written permission
Disclaimer
This presentation contains statements that may constitute “forward-looking statements”, based oncurrent opinions, expectations and projections about future events. Such statements are also based onassumptions and analysis made by Wilson, Sons and are subject to market conditions which arebeyond the Company’s control.
Important factors which may lead to significant differences between real results and these forward-looking statements are: national and international economic conditions; technology; financial marketconditions; uncertainties regarding results in the Company’s future operations, its plans, objectives,expectations, intentions; and other factors described in the section entitled "Risk Factors“, available inthe Company’s Prospectus, filed with the Brazilian Securities and Exchange Commission (CVM).
The Company’s operating and financial results, as presented on the following slides, were prepared inconformity with International Financial Reporting Standards (IFRS), except as otherwise expresslyindicated. An independent auditors’ review report is an integral part of the Company’s condensedconsolidated financial statements.

This information is property of Wilson Sons and can not be used or reproduced without written permission
Head Office
Terminals
Towage
Offshore
Logistics
Agency
Shipyards
International & Domestic Trade Flow 76% of Client Exposure
Oil & Gas24% of Client Exposure
* Based on 2015 revenues including JV’s
EBITDA*CAGR of 14.1%
* Including Offshore Support Vessels JV
47.9
121.4
208.5
2004
2010
2015FMM*; 78%
Others; 22%
* FMM = Merchant Marine Fund (Fundo da Marinha Mercante)
3.1% Weighted Avg. Cost of Debt in 2015
Including OffshoreSupport Vessels JV
3
Wilson Sons at a Glance
This information is property of Wilson Sons and can not be used or reproduced without written permission
4
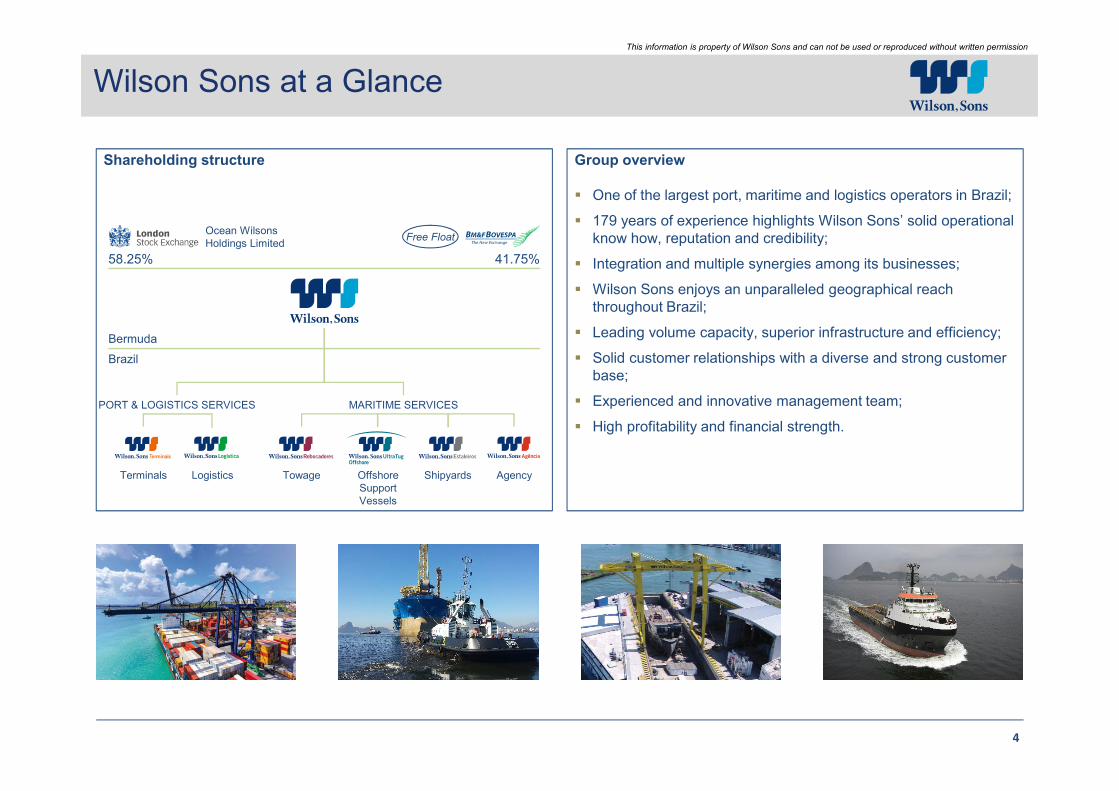
Wilson Sons at a Glance
Group overview
� One of the largest port, maritime and logistics operators in Brazil;
� 179 years of experience highlights Wilson Sons’ solid operational know how, reputation and credibility;
� Integration and multiple synergies among its businesses;
� Wilson Sons enjoys an unparalleled geographical reach throughout Brazil;
� Leading volume capacity, superior infrastructure and efficiency;
� Solid customer relationships with a diverse and strong customer base;
� Experienced and innovative management team;
� High profitability and financial strength.
Shareholding structure
Ocean Wilsons Holdings Limited
Free Float
58.25% 41.75%
Bermuda
Brazil
PORT & LOGISTICS SERVICES MARITIME SERVICES
Terminals Logistics Towage OffshoreSupportVessels
Shipyards Agency
Our Growth Drivers

This information is property of Wilson Sons and can not be used or reproduced without written permission
6
International & Domestic Trade Flow
Increasing Container Handling in Brazil (TEU M)Source: Datamar
CAGR: +4.8%
Evolution of International Trade in Brazil (Billion tonnes)Source: Central Bank 2016
Growth of Cabotage in Brazil (TEU M)Source: Datamar
CAGR: +10.4%
CAGR: +4.5%
Increasing Container Handling in Brazil – Imports and Exports (TEU M) Source: Datamar
526.6580.6 593.4
559.3
658.3692.9 688.0
718.0 742.0784.1
2006 2007 2008 2009 2010 2011 2012 2013 2014 2015
0.91.0
1.1 1.11.2
1.4
1.71.8
2.12.2
2006 2007 2008 2009 2010 2011 2012 2013 2014 2015e
6.16.6 6.9
6.2
7.48.0
8.69.2 9.6 9.3
2006 2007 2008 2009 2010 2011 2012 2013 2014 2015e
CAGR: +3.4%
2.6 2.7 2.8 2.53.0 3.2 3.4 3.6 3.6 3.5
2.7 2.9 3.02.6
3.23.4
3.63.8 3.7 3.7
2006 2007 2008 2009 2010 2011 2012 2013 2014 2015e
Exports Imports
5.35.6
5.8
5.1
6.16.6
6.97.4 7.3
7.1
This information is property of Wilson Sons and can not be used or reproduced without written permission
7
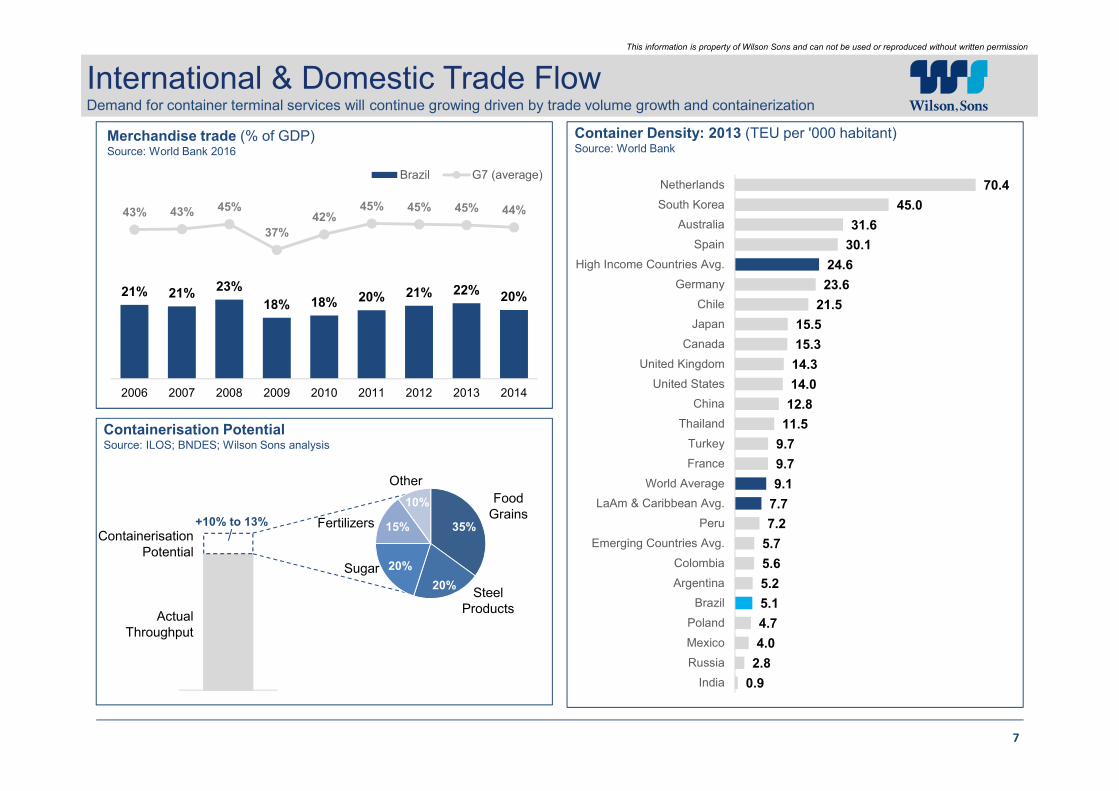
International & Domestic Trade FlowDemand for container terminal services will continue growing driven by trade volume growth and containerization
Container Density: 2013 (TEU per '000 habitant)Source: World Bank
70.4
45.0
31.6
30.1
24.6
23.6
21.5
15.5
15.3
14.3
14.0
12.8
11.5
9.7
9.7
9.1
7.7
7.2
5.7
5.6
5.2
5.1
4.7
4.0
2.8
0.9
Netherlands
South Korea
Australia
Spain
High Income Countries Avg.
Germany
Chile
Japan
Canada
United Kingdom
United States
China
Thailand
Turkey
France
World Average
LaAm & Caribbean Avg.
Peru
Emerging Countries Avg.
Colombia
Argentina
Brazil
Poland
Mexico
Russia
India
Containerisation PotentialSource: ILOS; BNDES; Wilson Sons analysis
Containerisation Potential
ActualThroughput
+10% to 13% 35%
20%
20%
15%
10%
Other
Food Grains
Steel Products
Sugar
Fertilizers
Merchandise trade (% of GDP)Source: World Bank 2016
21% 21%23%
18% 18% 20% 21% 22%20%
43% 43% 45%
37%
42%45% 45% 45% 44%
2006 2007 2008 2009 2010 2011 2012 2013 2014
Brazil G7 (average)

8
This information is property of Wilson Sons and can not be used or reproduced without written permission
Increased Distances to New Oil RigsPlatform Support Vessels (PSVs) in BrazilSource: ABEAM 2016
Brazilian Pre-Salt Oil Production (k bpd)Source: Petrobras
Oil Price Estimates – Average price of a barrel of crude oilSource: World Bank Commodity Markets Outlook (Jan 2016)
Oil & Gas Industry in Brazil
125 km
300 km
Average Campos Basin Distances
Pre-salt Distances
Pre-salt fields already
contributes close to
36% of total oil
production in Brazil
03 1541
119169
302
492
767
2008 2009 2010 2011 2012 2013 2014 2015
6875
8794
101108
121
55
104
88
99106
63
46
2010 2011 2012 2013 2014 2015 Mar/2016
National flag
Foreign flag
Our Business

10
This information is property of Wilson Sons and can not be used or reproduced without written permission
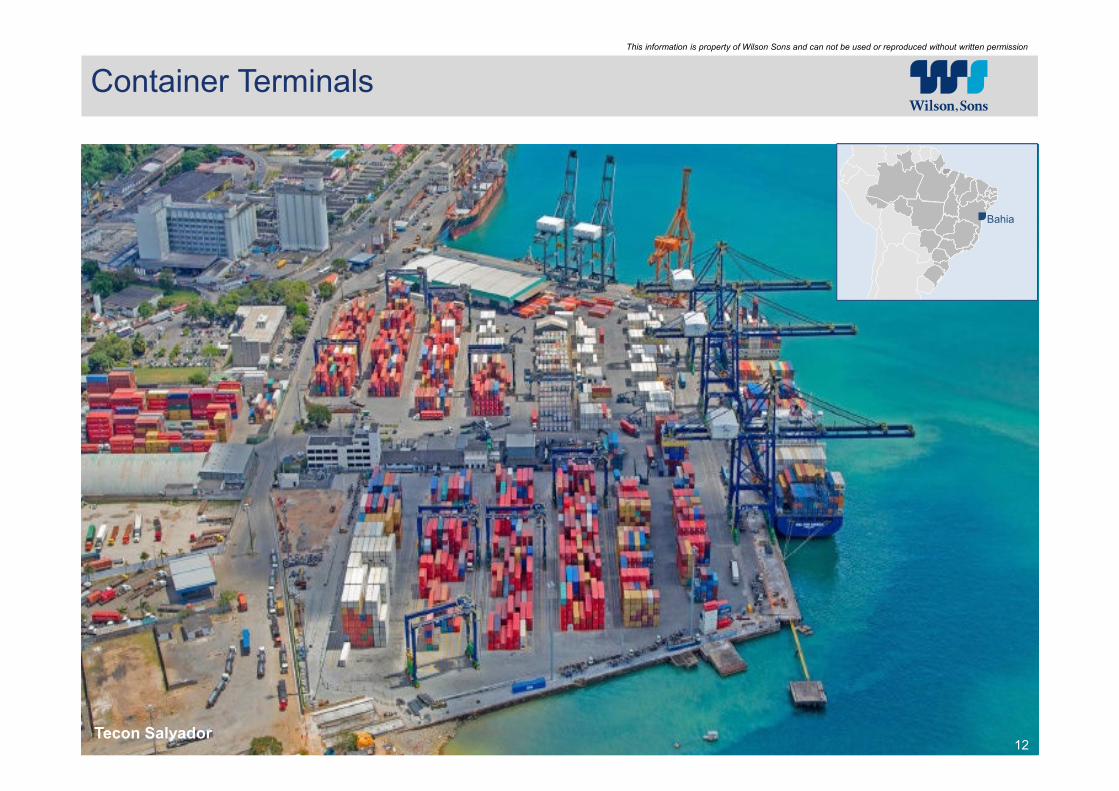
Container Terminals
Tecon Rio Grande 10
1,035.2TEU handled
(2015 Tecon RG + Tecon SSA)
1,880,000TEU capacity
(Tecon RG + Tecon SSA)
US$ 153MNet Revenues
(30% of 2015 Total Revenues)
Rio Grande do Sul

11
This information is property of Wilson Sons and can not be used or reproduced without written permission
Key infrastructure Rio Grande Salvador
Actual Actual
Handling capacity (TEU '000) 1,350 530
Container berths (#) 3 2
Total quay length (m) 900 617
Terminal area (m²) 670,000 118,000
Water depth (m) 15 15
Quay cranes (# STSs) 6 6
Yard cranes (# RTGs) 14 8
Shipping Lines 12 7
Container throughput (TEU '000)Source: Wilson Sons
Main Cargoes Handled (% of Total 2015 TEU)
Container Terminals
• Container Terminal concessions for 25 + 25 years in the ports of Rio Grande and Salvador
• One of the largest port operators in Brazil, with 10% market share
• Strategically located assets are key competitive advantage
340
560
789 867 862
929 908975
1.035
2000 2002 2004 2006 2008 2010 2012 2014 2015
CAGR: +7.7%
Cellulose & Paper 11.3%
Polymers 11.2%
Chemical & Petrochemical 11.0%
Ores 5.4%
Steel & Metallurgy 4.8%
Parts & Equipment 4.5%
Undefined Products 4.4%
Rice 3.8%
Tires 3.7%
Fruits 3.4%
Latex 2.9%
Plastics 2.8%
IT Equipment 2.6%
Food 2.4%
Juice & Fruit Pulps 2.3%
Beverage 2.2%
Paper Products 2.0%
Retail Products 2.0%
Frozen Food 1.8%
Textil 1.8%
Others 13.7%
Tecon SSAResins 11.8%
Tobacco 9.2%
Rice 7.9%
Frozen Chicken 5.7%
Chemicals 4.0%
Parts & Pieces 3.9%
Cellulose 2.7%
Machines 2.6%
Food 2.5%
Fresh Fruits 2.4%
Plastics 2.4%
Wood 2.2%
Furniture 2.2%
Pork Meat 1.9%
Steelwork 1.9%
Latex 1.8%
Frozen Fish 1.5%
Tires 1.1%
Leather 1.0%
Paper 0.9%
Others 30.3%
Tecon RG
12
This information is property of Wilson Sons and can not be used or reproduced without written permission
Container Terminals
12Tecon Salvador
Bahia

13
This information is property of Wilson Sons and can not be used or reproduced without written permission
Highlights
Oil & Gas Terminals - Net Revenues US$24M in 2015 (4.6% of Total 2015 Revenues)
• Providing support to the Oil & Gas industry, combining own assets and expertise in public ports
• First private Oil & Gas terminal operator in Brazil, with more than 13 years of experience
• Strategically located bases with advantageous access to the pre-salt areas
Campos
Basin
Santos
BasinBase Areas (sqm)
Completed Quay Length (m)
~70,000
180
~60,000
500
# of Berths 3 5/6
n/a
n/a
Brasco(Niterói)
Brasco Caju(Briclog)
GuaxindibaDepot
Turnarounds Capacity / year 1,260 1,920 n/a
~80,000
Strategic Location
Brasco Caju and Brasco Niterói
• 829 Vessel Turnarounds in 2015;
Brasco (Niterói) Brasco (Caju)
14
This information is property of Wilson Sons and can not be used or reproduced without written permission
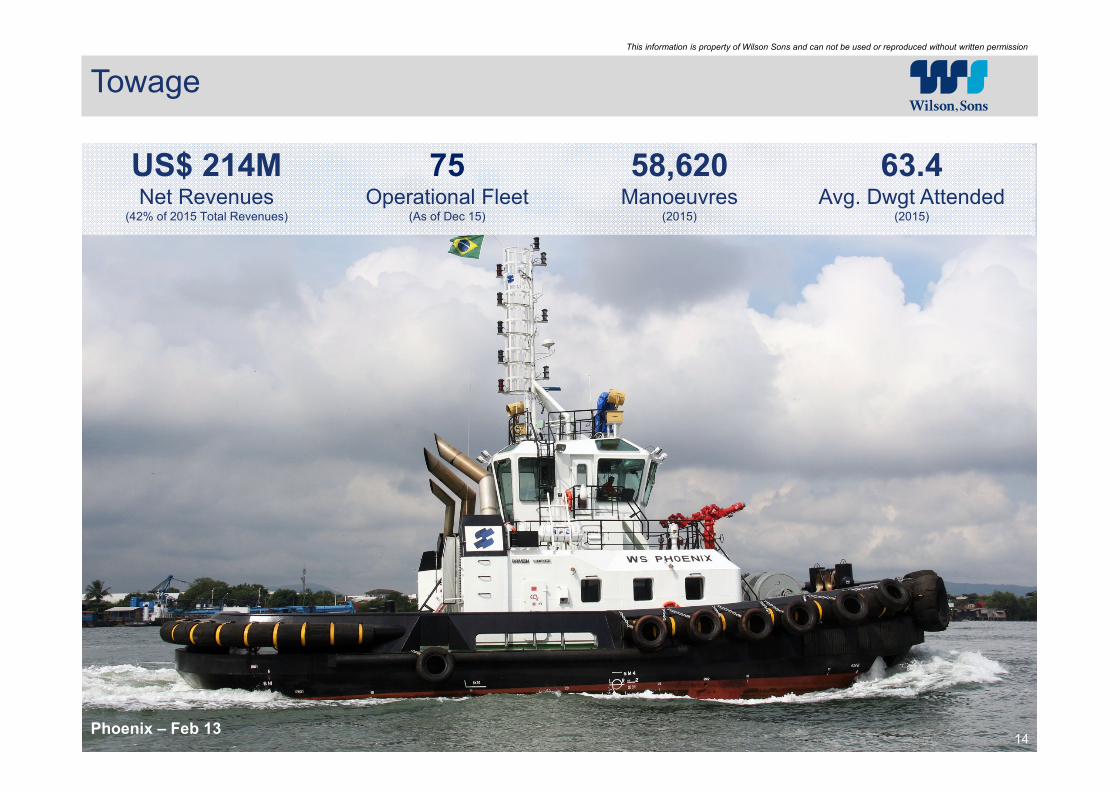
Towage
Phoenix – Feb 1314
US$ 214MNet Revenues
(42% of 2015 Total Revenues)
58,620Manoeuvres
(2015)
63.4Avg. Dwgt Attended
(2015)
75Operational Fleet
(As of Dec 15)

15
This information is property of Wilson Sons and can not be used or reproduced without written permission
Brazilian Towage MarketPrincipal Players
Tugboats Throughout Brazilian PortsAs of December/2015
Towage
• Largest fleet in Brazil, approx. 50% share at harbour manoeuvres, operating in all major ports of Brazil
• Policy priority to Brazilian flag vessels
• Long-term and low-cost funding available from the FMM (Fundo da Marinha Mercante)
North8 tugboats
Northeast28 tugboats
Southeast26 tugboats
South13 tugboats
12
8
12
17Average Age
30
13
4
8
# Ports Attended
WS
Competidor (1)
Competidor (2)
Competidor (3)
75
44
30
20
Fleet
52.5
51.5
48.8
39.8Average Power

16
This information is property of Wilson Sons and can not be used or reproduced without written permission
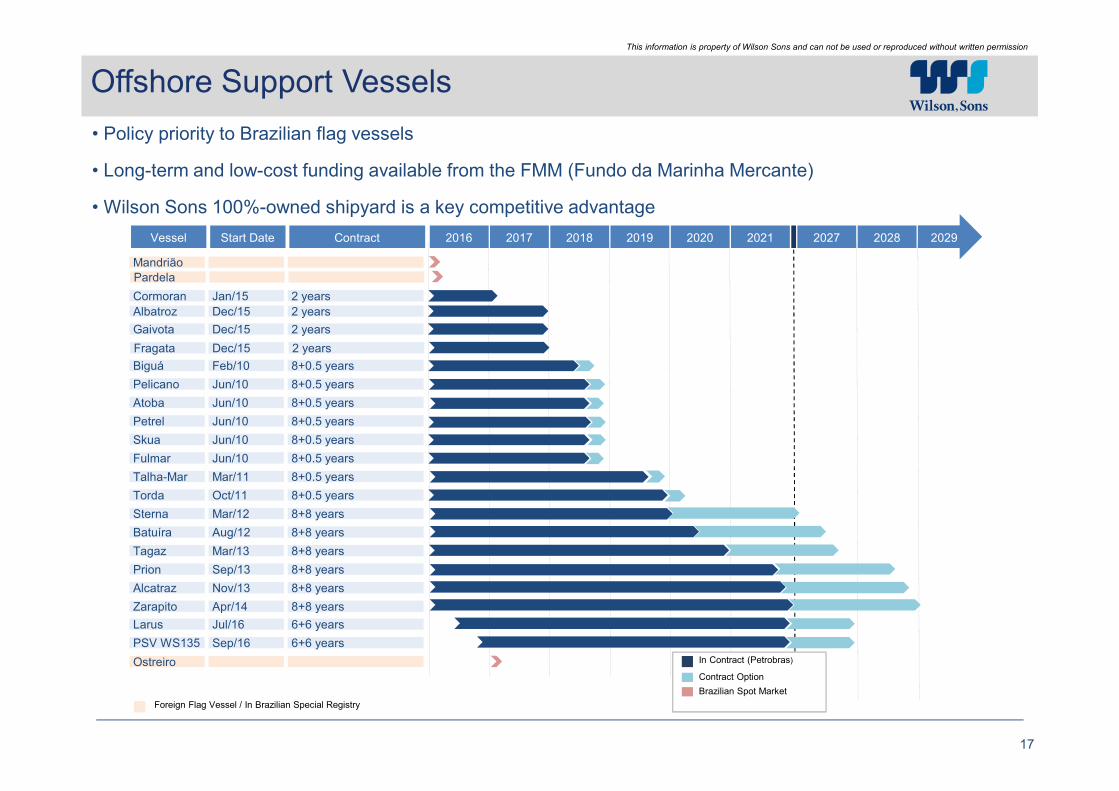
Offshore Support Vessels
PSV Alcatraz – Apr/1416
US$ 71MNet Revenues
(2015)
20 OSVsOperational Fleet
(As of May 16)
6,585Days in Operation
(Own Vessels 2015)
US$ 23,582Average Gross Daily Rate
(As of Apr 16)
17
This information is property of Wilson Sons and can not be used or reproduced without written permission
Ostreiro
Offshore Support Vessels
• Policy priority to Brazilian flag vessels
• Long-term and low-cost funding available from the FMM (Fundo da Marinha Mercante)
• Wilson Sons 100%-owned shipyard is a key competitive advantage
2016 2017 2018 2019 2020 2021 2027 2028 2029
Mandrião
Cormoran Jan/15 2 years
Gaivota Dec/15 2 years
Albatroz Dec/15 2 years
Biguá Feb/10 8+0.5 years
Pelicano Jun/10 8+0.5 years
Atoba Jun/10 8+0.5 years
Petrel Jun/10 8+0.5 years
Skua Jun/10 8+0.5 years
Fulmar Jun/10 8+0.5 years
Talha-Mar Mar/11 8+0.5 years
Torda Oct/11 8+0.5 years
Sterna Mar/12 8+8 years
Batuíra Aug/12 8+8 years
Tagaz Mar/13 8+8 years
Prion Sep/13 8+8 years
Alcatraz Nov/13 8+8 years
Zarapito Apr/14 8+8 years
Vessel Start Date Contract
Pardela
Larus
PSV WS135
Jul/16 6+6 years
Sep/16 6+6 years
Foreign Flag Vessel / In Brazilian Special Registry
In Contract (Petrobras)
Contract Option
Brazilian Spot Market
Fragata Dec/15 2 years
18
This information is property of Wilson Sons and can not be used or reproduced without written permission
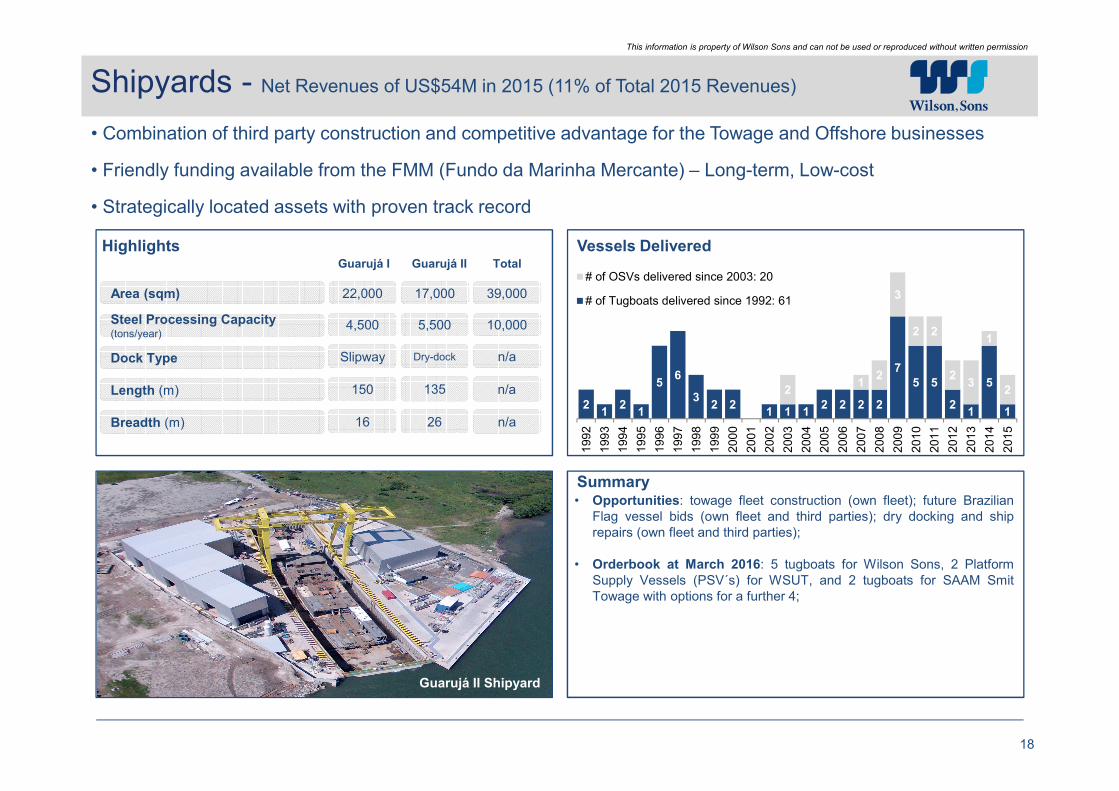
Shipyards - Net Revenues of US$54M in 2015 (11% of Total 2015 Revenues)
Length (m)
Steel Processing Capacity(tons/year)
Dock Type
Vessels Delivered
Summary
HighlightsGuarujá I Guarujá II
Area (sqm)
Total
• Combination of third party construction and competitive advantage for the Towage and Offshore businesses
• Friendly funding available from the FMM (Fundo da Marinha Mercante) – Long-term, Low-cost
• Strategically located assets with proven track record
Breadth (m)
22,000 17,000 39,000
4,500 5,500 10,000
Slipway Dry-dock n/a
150 135 n/a
16 26 n/a
• Opportunities: towage fleet construction (own fleet); future BrazilianFlag vessel bids (own fleet and third parties); dry docking and shiprepairs (own fleet and third parties);
• Orderbook at March 2016: 5 tugboats for Wilson Sons, 2 PlatformSupply Vessels (PSV´s) for WSUT, and 2 tugboats for SAAM SmitTowage with options for a further 4;
Guarujá II Shipyard
21
21
56
32 2
1 1 12 2 2 2
75 5
21
5
1
21
2
3
2 2
23
1
2
199
2
199
3
199
4
199
5
199
6
199
7
199
8
199
9
200
0
200
1
200
2
200
3
200
4
200
5
200
6
200
7
200
8
200
9
201
0
201
1
201
2
201
3
201
4
201
5
# of OSVs delivered since 2003: 20
# of Tugboats delivered since 1992: 61

This information is property of Wilson Sons and can not be used or reproduced without written permission
19
Wilson Sons’ Financial Highlights
Capital Expenditures (US$ M)Source: Wilson Sons
EBITDA by Business - Proforma: 2015 (%)Source: Wilson Sons
EBITDA - Proforma (US$ M)Source: Wilson Sons
Net Revenues - Proforma (US$ M)Source: Wilson Sons
211.2278.0
325.7393.3
476.7439.8
547.6
656.6610.4
660.1 633.5
508.9
6.5
7.2
8.4
10.7
21.6 38.1
28.0
41.4
47.0
54.4 76.8
71.0
2004 2005 2006 2007 2008 2009 2010 2011 2012 2013 2014 2015
Net Revenues (IFRS)
Net Revenues (Offshore )
217.7
285.2334.1
404.0
498.3477.9
575.6
657.4698.0 714.5 710.3
579.9
CAGR: 9.3%
43.9 45.773.0 86.9
109.8 109.2 108.3 152.0 146.3 182.8 160.1
168.1
4.0 3.4
3.2
4.5
12.9 19.213.1
11.3 16.0
23.1
39.240.4
2004 2005 2006 2007 2008 2009 2010 2011 2012 2013 2014 2015
EBITDA (IFRS)
EBITDA (Offshore)
47.9 49.1
76.2
91.4
122.7 128.4 121.4
163.3 162.3
205.9199.3
208.5
CAGR: 14.3%
20.935.4 26.6
59.3 69.6
116.3 127.5
226.6
128.7 136.9111.2
69.9 0.2
0.8 15.6
39.9 23.9
33.339.2
36.3
55.5 49.0
15.3
44.7
2004 2005 2006 2007 2008 2009 2010 2011 2012 2013 2014 2015
CAPEX Wilson Sons
CAPEX Embarcações Offshore
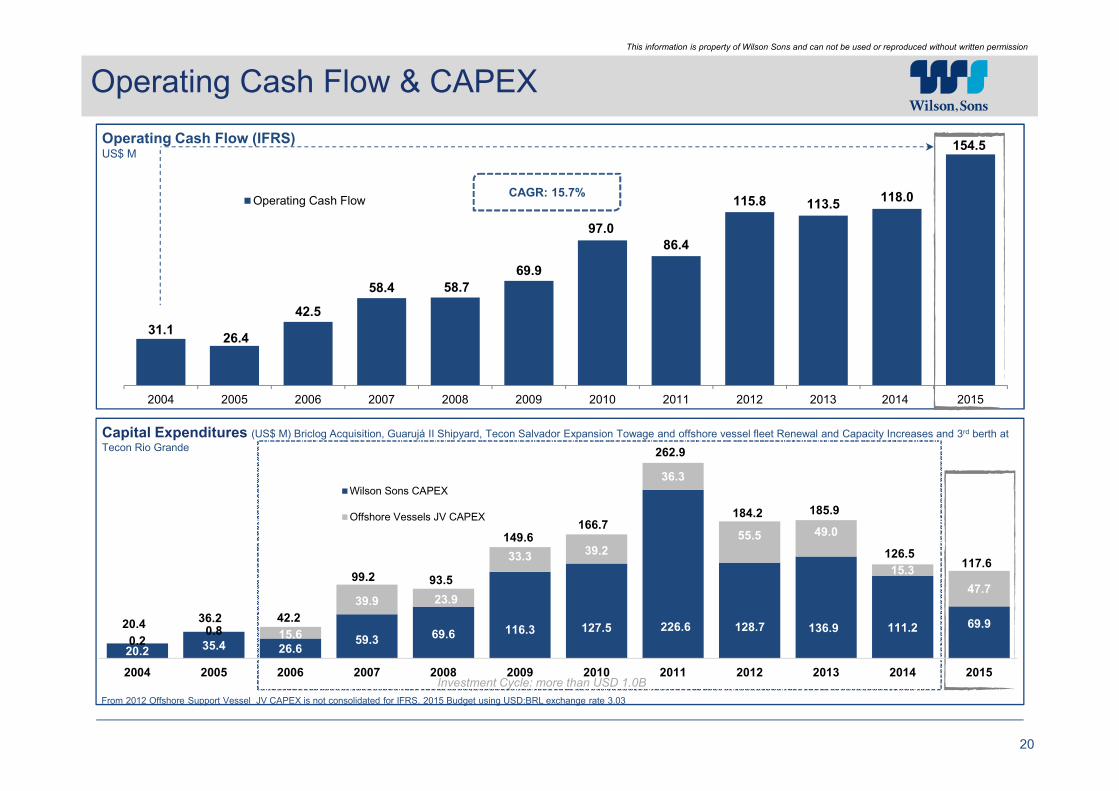
42.2
99.2 93.5
149.6166.7
262.9
184.2 185.9
126.5117.6
CAGR: 16.9%
Towage44%
Container Terminals
29%
Offshore Support Vessels18%
Others9%
20
This information is property of Wilson Sons and can not be used or reproduced without written permission
Capital Expenditures (US$ M) Briclog Acquisition, Guarujá II Shipyard, Tecon Salvador Expansion Towage and offshore vessel fleet Renewal and Capacity Increases and 3rd berth at
Tecon Rio Grande
Operating Cash Flow (IFRS) US$ M
Operating Cash Flow & CAPEX
Investment Cycle: more than USD 1.0B
From 2012 Offshore Support Vessel JV CAPEX is not consolidated for IFRS. 2015 Budget using USD:BRL exchange rate 3.03
CAGR: 15.7%
117.6
20.2 35.4 26.659.3 69.6 116.3 127.5 226.6 128.7 136.9 111.2 69.9
0.20.8 15.6
39.9 23.9
33.3 39.2
36.3
55.5 49.0
15.3
47.7
2004 2005 2006 2007 2008 2009 2010 2011 2012 2013 2014 2015
Wilson Sons CAPEX
Offshore Vessels JV CAPEX
126.5
185.9
262.9
149.6
93.5
42.236.220.4
184.2166.7
99.2
31.1 26.4
42.5
58.4 58.7
69.9
97.0
86.4
115.8 113.5 118.0
154.5
2004 2005 2006 2007 2008 2009 2010 2011 2012 2013 2014 2015
Operating Cash Flow

21
This information is property of Wilson Sons and can not be used or reproduced without written permission
Free Cash Flow (IFRS) US$ M
Distribution to Shareholders – Dividend Policy 50% of Net Profit US$ M
Free Cash Flow and DividendsVoluntarily follow the majority of Novo Mercado rules
CAGR:13.1%
1.72% 3.27% 2.67% 1.30% 1.61% 2.02%
* Dividend Yield: Amount paid per BDR / Closing value of the share on the date of payment
2.52% 4.40%Dividend Yield Since IPO
8.0 8.87.6 8.0
16.0 16.0
22.6
18.1 18.1 18.1
27.029.0
35.6
2004 2005 2006 2007 2008 2009 2010 2011 2012 2013 2014 2015 2016
5.80%
20.236.2 42.2
92.6 90.2
139.7162.0
234.0
1625
106.1 107.5
68.010.9
-9,8
0.2
-34.2 -31.5
-69.8 -65.0
-147.6
-46.7
7.4 10.5 86.5
2004 2005 2006 2007 2008 2009 2010 2011 2012 2013 2014 2015
Free Cash Flow CAPEX
22
This information is property of Wilson Sons and can not be used or reproduced without written permission
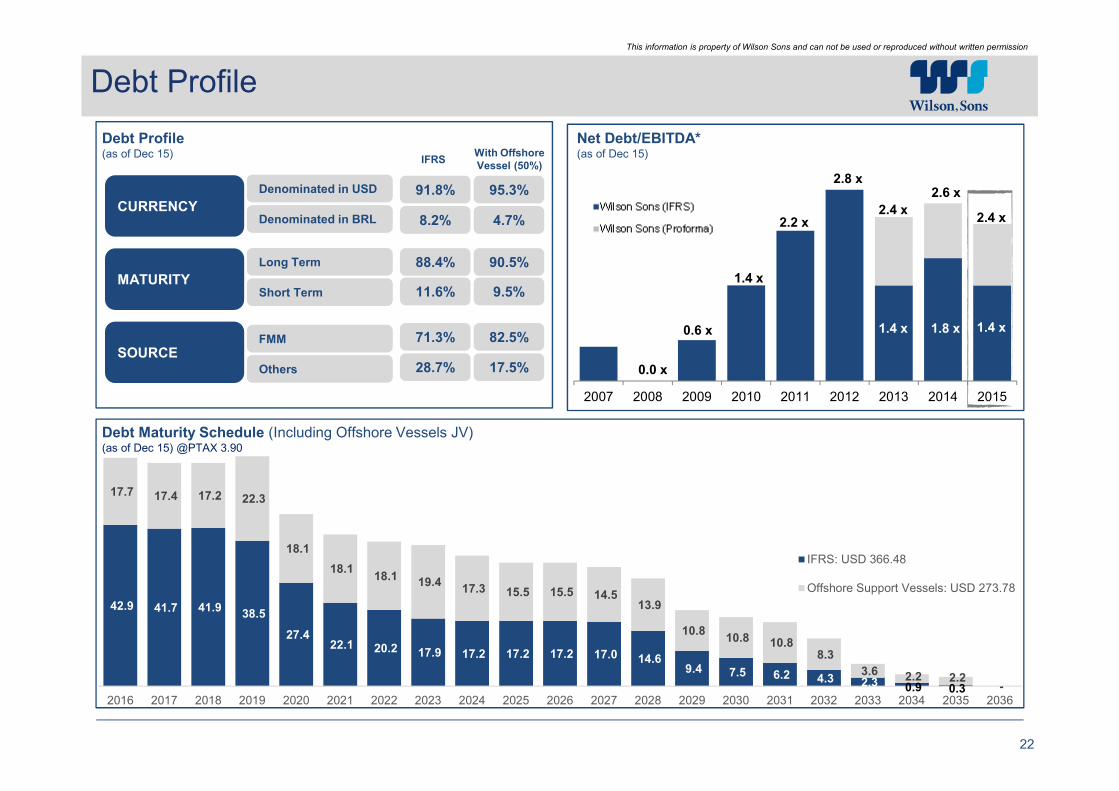
Debt Maturity Schedule (Including Offshore Vessels JV) (as of Dec 15) @PTAX 3.90
Net Debt/EBITDA*(as of Dec 15)
Debt Profile(as of Dec 15)
Debt Profile
91.8%
8.2%
88.4%
11.6%
28.7%
71.3%
CURRENCY
Denominated in USD
Denominated in BRL
MATURITY
Long Term
Short Term
SOURCEOthers
FMM
95.3%
4.7%
90.5%
9.5%
17.5%
82.5%
IFRSWith Offshore Vessel (50%)
42.9 41.7 41.938.5
27.422.1 20.2 17.9 17.2 17.2 17.2 17.0 14.6
9.4 7.5 6.2 4.3 2.3 0.9 0.3 -
17.7 17.4 17.2 22.3
18.1
18.1 18.1
19.417.3 15.5 15.5 14.5
13.9
10.810.8 10.8
8.3
3.6 2.2 2.2-
2016 2017 2018 2019 2020 2021 2022 2023 2024 2025 2026 2027 2028 2029 2030 2031 2032 2033 2034 2035 2036
IFRS: USD 366.48
Offshore Support Vessels: USD 273.78
2007 2008 2009 2010 2011 2012 2013 2014 2015
0.0 x
0.6 x
1.4 x
2.2 x
2.8 x
2.4 x
2.6 x
2.4 x
1.4 x 1.8 x 1.4 x

23
This information is property of Wilson Sons and can not be used or reproduced without written permission
Management Alignment
Management: Stock Options for top management subsisting grant2,949,000
Remuneration program for Executive based on net profit and dividendpayout
Remuneration program for managers and employees - EBITDA and/orEBIT
Individual performance plans: clear goals and meritocracy based on 9in Box
Business Managers with specific HSSE goals
Employees own 56,280 BDR´s at 31/12/2015
Corporate Governance
Returns, Governance and Management Alignment
53%
Return on Capital Employed (ROCE)2015 EBIT / Average 5 year (Total Assets – Current Liabilities)
Indicative Benchmark
Business A Business B Business C Business D
100% TAG ALONG for all minority shareholders
One class of share with equal voting rights
Free-float more than 25% of total capital
Audit Committee
Estimated (Proforma) Revenue, Costs and EBITDA(Year ended Dec 15)
At least 20% of the members of our board of directors must be
independent directors
85%
48%
15%
52%
EBITDA
Costs
Revenue
R$ Source/Denominated
US$ Source/Denominated0%
5%
10%
15%
20%
25%
30%

24
This information is property of Wilson Sons and can not be used or reproduced without written permission
Investor Relations Contact Info
BM&FBovespa: WSON33IR website: www.wilsonsons.com/ir
Twitter: @WilsonSonsIRYoutube Channel: WilsonSonsIR
Facebook: Wilson, Sons
Michael Connell
IRO, International Finance & Finance Projects
[email protected]+55 (21) 2126-4107
Kelly Calazans
Investor Relations
[email protected]+55 (21) 2126-4105
Júlia Ornellas
Investor Relations
[email protected]+55 (21) 2126-4293