Embed Size (px)
Citation preview

Investor PresentationNovember 2015

Presenters
Tim Taft, President and Chief Executive Officer
Lynn Schweinfurth, Chief Financial Officer
1

Forward Looking Statements
This document and our presentation contain “forward-looking statements” within the meaning of Section 27A of the Securities Act of
1933, as amended, and Section 21E of the Securities Exchange Act of 1934, as amended and are intended to be covered by the
“safe harbor” created by those sections. All statements, other than statements of historical facts included herein, including, without
limitation, statements regarding our future financial position and results of operations, business strategy, budgets, projected costs
and plans and objectives of management for future operations, are “forward-looking statements.” Forward-looking statements
generally can be identified by the use of forward-looking terminology such as “may,” “will,” “expect,” “anticipate,” “intend,” “plan,”
“believe,” “seek,” “estimate” or “continue” or the negative of such words or variations of such words and similar expressions. These
statements are not guarantees of future performance and involve certain risks, uncertainties and assumptions, which are difficult to
predict. Therefore, actual outcomes and results may differ materially from what is expressed or forecasted in such forward-looking
statements and we can give no assurance that such forward-looking statements will prove to be correct. Important factors that
could cause actual results to differ materially from those expressed or implied by the forward-looking statements, or “cautionary
statements,” include, but are not limited to: increases in food and other commodity costs; risks associated with the expansion of our
business; our ability to manage our growth and successfully implement our business strategy; general economic conditions,
particularly in the retail sector; competitive conditions; weather conditions; fuel prices; significant disruptions in service or supply by
any of our suppliers or distributors; changes in consumer perception of dietary health and food safety; labor and employment
benefit costs; regulatory factors; the outcome of pending or future legal claims or proceedings; environmental conditions and
regulations; our borrowing costs; the availability and terms of necessary or desirable financing or refinancing and other related risks
and uncertainties; the risk of an act of terrorism or escalation of any insurrection or armed conflict involving the United States or any
other national or international calamity; factors that affect the restaurant industry generally, including product recalls, liability if our
products cause injury, ingredient disclosure and labeling laws and regulations, reports of cases of food borne illnesses such as
“mad cow” disease and “avian” flu, and the possibility that consumers could lose confidence in the safety and quality of certain food
products, as well as negative publicity regarding food quality, illness, injury or other health concerns.
2

Strategic and Operational Overview

Investment Considerations
Two Leading, Differentiated Brands
Well Positioned Within the Growing Fast-Casual Segment
Accelerating Development Given Significant Potential
Compelling Business Model
Proven Financial Results
4
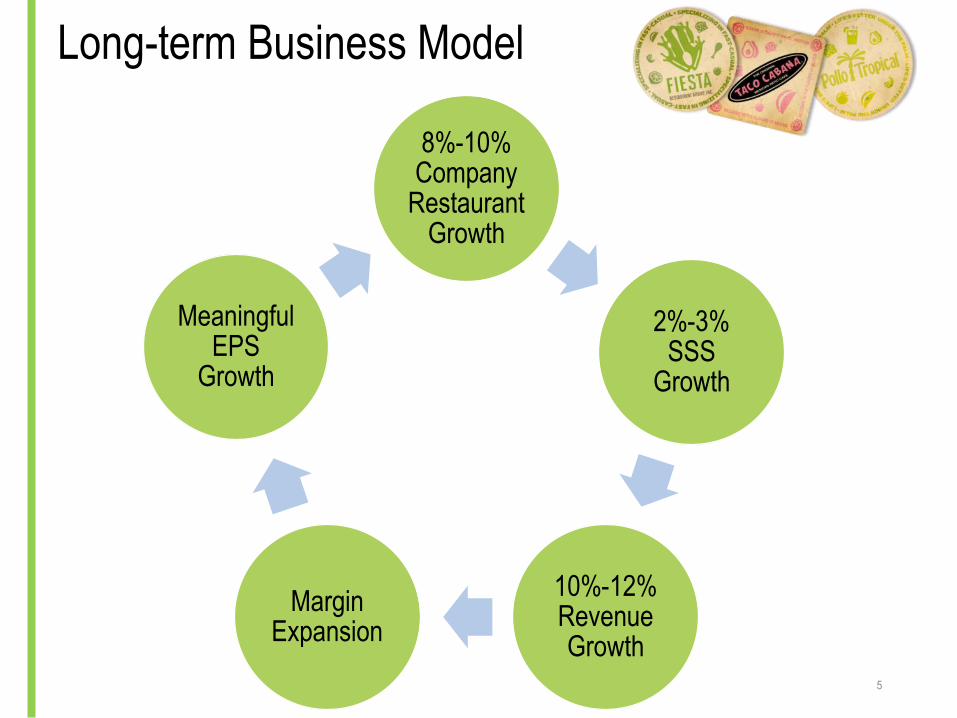
Long-term Business Model
8%-10% Company
Restaurant Growth
2%-3% SSS
Growth
10%-12% Revenue Growth
Margin Expansion
Meaningful EPS
Growth
5

6

Freshly Prepared, Caribbean-inspired Menu
7

Freshly Prepared, Caribbean-inspired Menu
Add food shorts
8
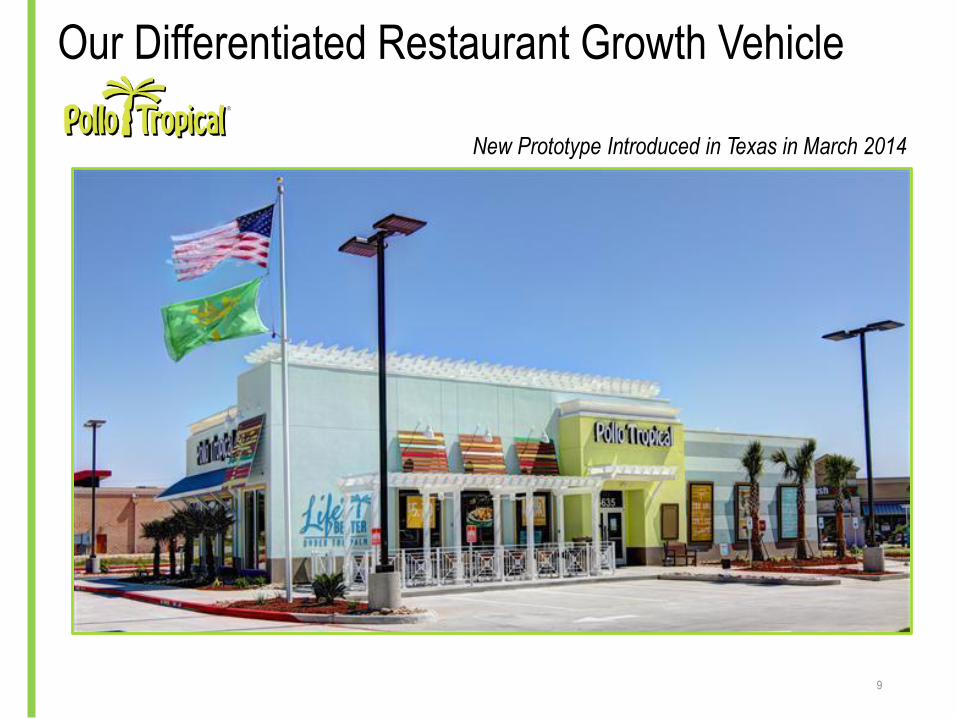
Our Differentiated Restaurant Growth Vehicle
9
New Prototype Introduced in Texas in March 2014

Our Differentiated Restaurant Growth Vehicle
10
New Prototype Introduced in Texas in March 2014

Our Differentiated Restaurant Growth Vehicle
11
New Prototype Introduced in Texas in March 2014

Reaching Media Efficiency
12
Market 2011 2012 2013 2014 2015F
Media
Efficiency at
S. Florida 63 65 66 74 79 25
Orlando 13 14 15 16 21 20
Dallas - - - 5 12 30
Atlanta 1 2 5 5 11 20
Naples/Ft Myers 3 3 4 6 7 6
Tampa 4 4 6 6 6 14
Houston - - - 3 5 35
Jacksonville 2 3 3 4 5 5
San Antonio - - - 2 5 10
Nashville - - 2 2 4 5
Gainesville - - 1 1 1 -
Total 86 91 102 124 156
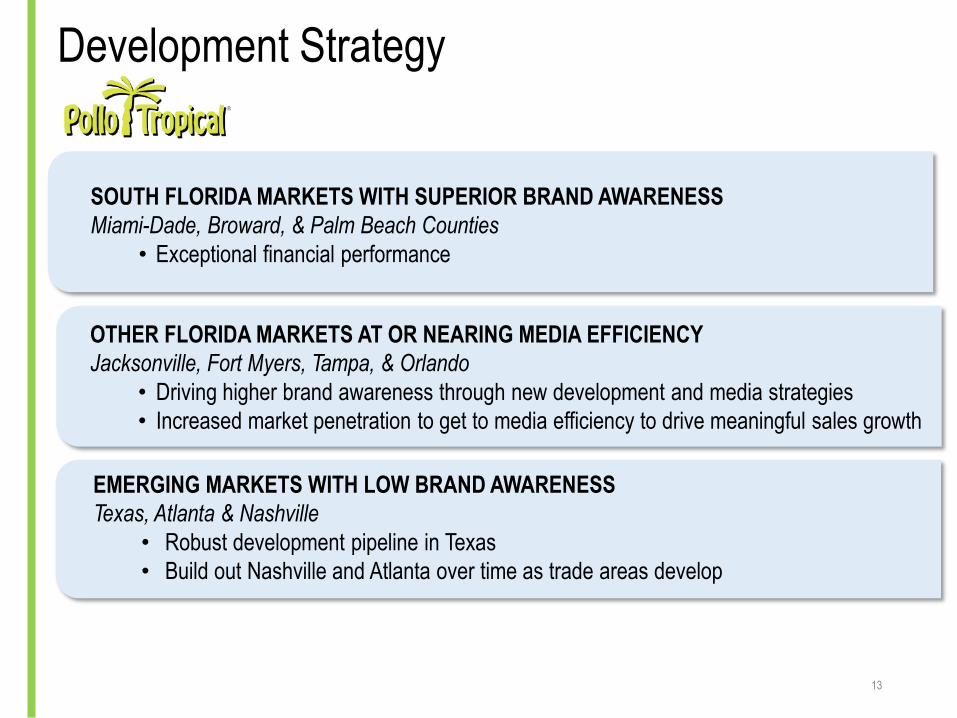
SOUTH FLORIDA MARKETS WITH SUPERIOR BRAND AWARENESS
Miami-Dade, Broward, & Palm Beach Counties
• Exceptional financial performance
OTHER FLORIDA MARKETS AT OR NEARING MEDIA EFFICIENCY
Jacksonville, Fort Myers, Tampa, & Orlando
• Driving higher brand awareness through new development and media strategies
• Increased market penetration to get to media efficiency to drive meaningful sales growth
EMERGING MARKETS WITH LOW BRAND AWARENESS
Texas, Atlanta & Nashville
• Robust development pipeline in Texas
• Build out Nashville and Atlanta over time as trade areas develop
Development Strategy
13

Sales and AUV Trends
14
1 Excludes Nashville DMA which only had two restaurants opened in 2013 and 2014; 2012 AUV and 2013 SSS excluded as average restaurant count and comparable restaurant count, respectively, was less than one
$2.5$2.8
$1.8
$2.7$3.0
$2.0 $2.1$2.7
$3.1
$2.1 $1.9
System South Florida Other Florida At /Near MediaEfficiency
Emerging(Atlanta / Texas)
Average Unit Volume
2012 2013 2014
NM
1
8.1%7.5%
11.3%
5.9% 6.1% 6.2%6.6% 6.5%8.2%
1.0%
System South Florida Other Florida At /Near MediaEfficiency
Emerging(Atlanta / Texas)
Same Store Sales
2012 2013 2014
1
NM
91
65
242
102
6629
5
124
74
3315
System South Florida Other Florida At /Near MediaEfficiency
Emerging(Atlanta / Texas)
Total Restaurants at Year End
2012 2013 2014
1

Attractive New Restaurant Economics
($s in millions)
Average Unit Volume $2.2+
Cash Investment Costs1 $1.4 - $2.0
Cash-on-Cash Return ~25%+
Targeted New Restaurant Economics
1. Pre-opening cost not included in investment cost. Assumes land lease with cash investment for building and FF&E. Company targets free-standing locations due to drive-thru. In the event of an existing building conversion, cash investment cost would be on the lower end of the range.
15
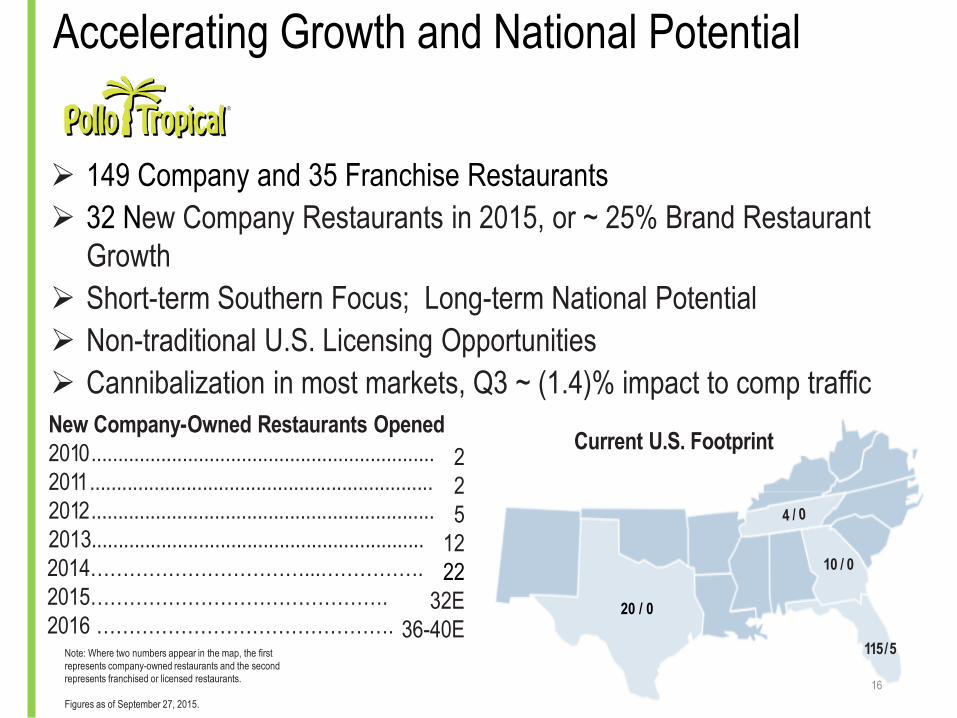
Accelerating Growth and National Potential
149 Company and 35 Franchise Restaurants
32 New Company Restaurants in 2015, or ~ 25% Brand Restaurant
Growth
Short-term Southern Focus; Long-term National Potential
Non-traditional U.S. Licensing Opportunities
Cannibalization in most markets, Q3 ~ (1.4)% impact to comp traffic
20 / 0
10 / 0
115 / 5
Current U.S. FootprintNew Company-Owned Restaurants Opened
2010................................................................
2011................................................................
2012................................................................
2013..............................................................
2014……………………………...…………….
2015……………………………………….
2016 ……………………………………….
2
2
5
12
22
32E
36-40E
16
Note: Where two numbers appear in the map, the first
represents company-owned restaurants and the second
represents franchised or licensed restaurants.
Figures as of September 27, 2015.

Reimaging Program Initiated in 2015
17
New Prototype
Prior Prototype

18

Fresh, Authentic Flavors of Mexico
19

Fresh, Authentic Flavors of Mexico
20

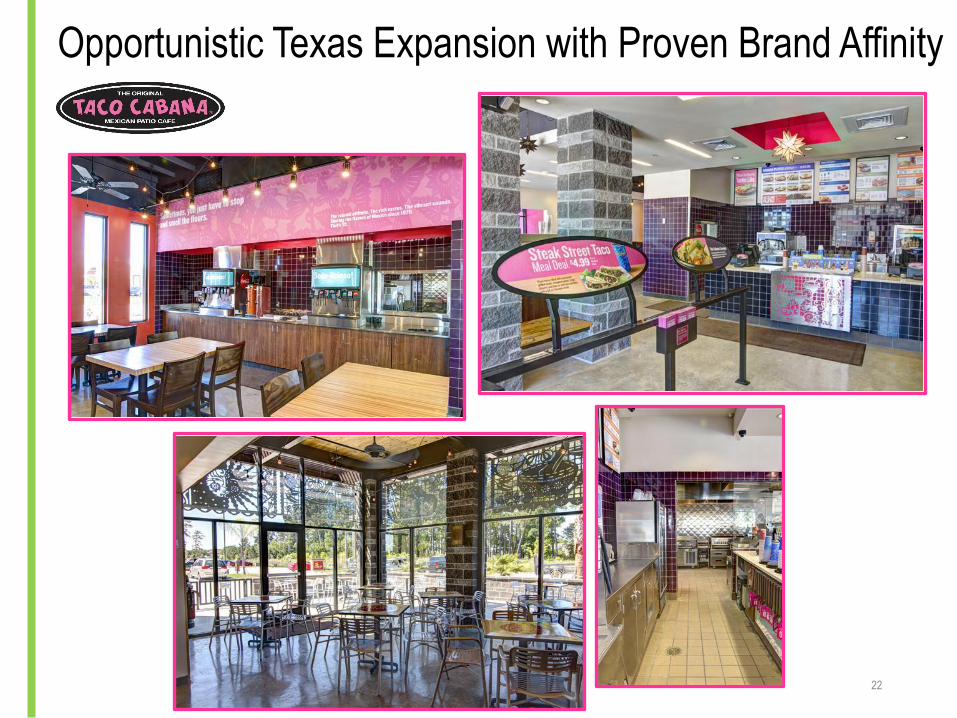
Opportunistic Texas Expansion with Proven Brand Affinity
21
Opportunistic Texas Expansion with Proven Brand Affinity
22

Non-24 Hour Format Test Outside of Texas
23
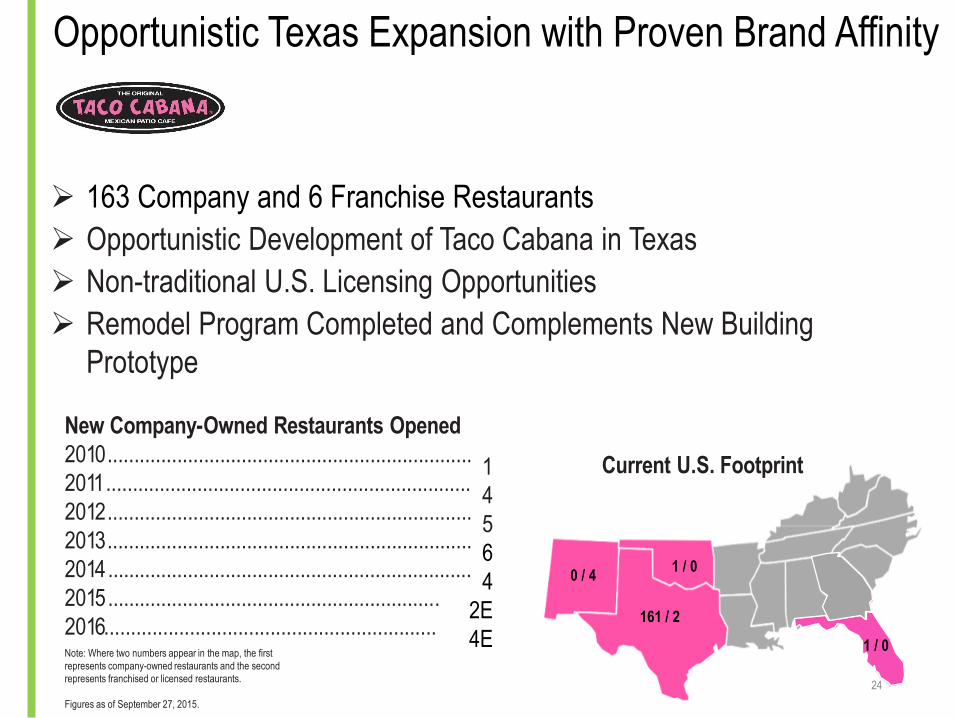
Opportunistic Texas Expansion with Proven Brand Affinity
163 Company and 6 Franchise Restaurants
Opportunistic Development of Taco Cabana in Texas
Non-traditional U.S. Licensing Opportunities
Remodel Program Completed and Complements New Building
Prototype
Note: Where two numbers appear in the map, the first
represents company-owned restaurants and the second
represents franchised or licensed restaurants.
Figures as of September 27, 2015.
New Company-Owned Restaurants Opened
2010....................................................................
2011....................................................................
2012....................................................................
2013....................................................................
2014 ....................................................................
2015 ..............................................................
2016..............................................................
1
4
5
6
4
2E
4E
Current U.S. Footprint
161 / 2
1 / 0
24
0 / 4
1 / 0
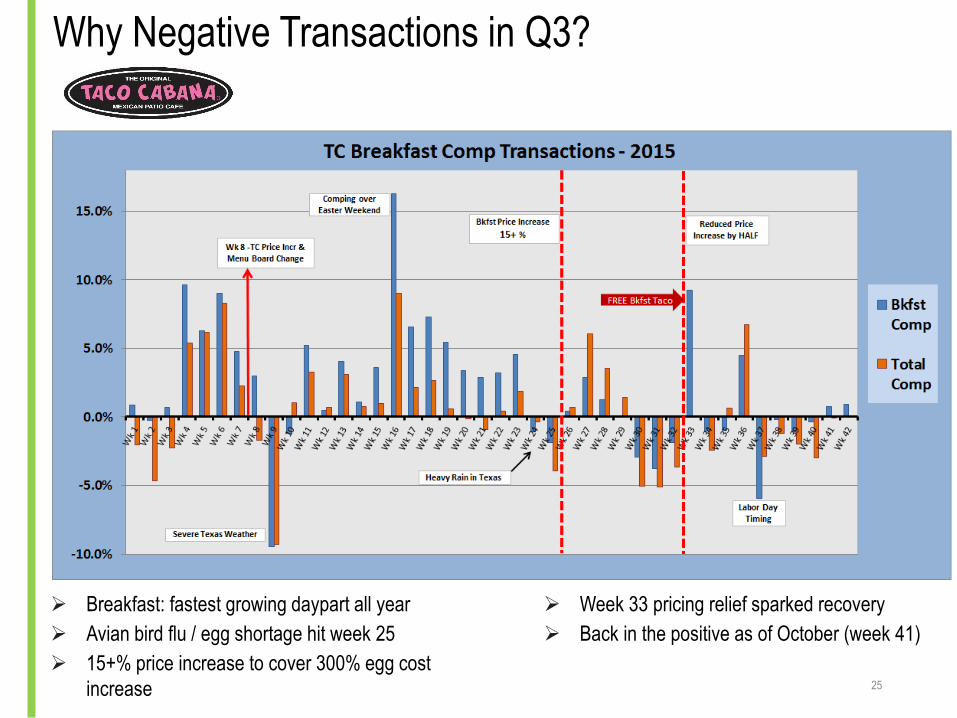
Why Negative Transactions in Q3?
Breakfast: fastest growing daypart all year
Avian bird flu / egg shortage hit week 25
15+% price increase to cover 300% egg cost
increase
Week 33 pricing relief sparked recovery
Back in the positive as of October (week 41)
25

2010 2011 2012 2013 2014
*Sources: Latest company filings and equity research.
Taco Cabana AUV GrowthCAGR = 3.2%
$1.6
$1.7
$1.8 $1.8
2010 2011 2012
(FY 2014, $s in millions)*
Pollo Tropical AUV GrowthCAGR = 7.3%
$2.1
$2.3
$2.5$2.7
$2.7
$2.5$2.4
$1.8
$1.2$1.1 $1.0
2013
$1.5
Industry-leading AUVs
$2.7
2014
$1.8
26
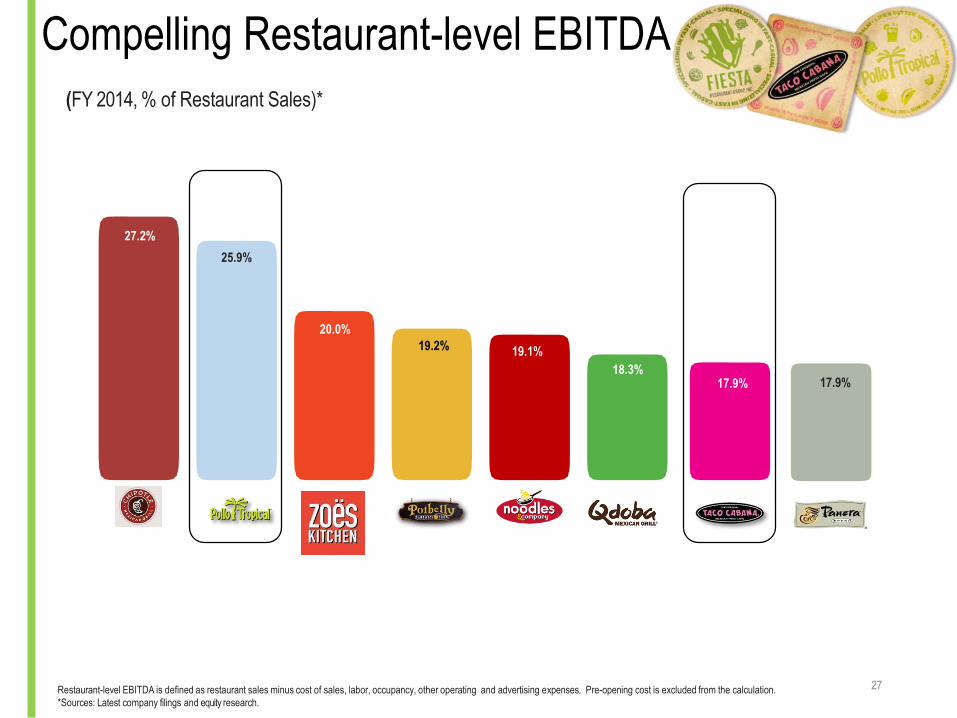
(FY 2014, % of Restaurant Sales)*
25.9%
27.2%
17.9%
19.1%19.2%
Restaurant-level EBITDA is defined as restaurant sales minus cost of sales, labor, occupancy, other operating and advertising expenses. Pre-opening cost is excluded from the calculation.
*Sources: Latest company filings and equity research.
20.0%
18.3%
Compelling Restaurant-level EBITDA
17.9%
27

Number of System-wide Restaurants in U.S.
Sources: Company filings, Wall Street research, and company websites. Domestic system wide unit counts as of the most recent filings. Moe’s locations based on an estimate as of 7/14/14.
Note: Company and franchise Taco Cabana and Pollo Tropical restaurants as of Sept. 27, 2015.
1,926
648
550
472418
366
169
Unit 3,200 4,500 2,000 N/A 2,500 N/A N/A N/A N/A 1,600
Potential
% of Unit 60% 41% 32% N/A 19% N/A N/A N/A N/A 9%
Potential
1,847
169154
28
Restaurant Growth Potential
151

Financial Overview

Sales Growth and Margin Trends
8.1%
5.9%6.6% 6.3%
5.0%
2012 2013 2014 3Q14 YTD 3Q15 YTD
SSS Growth
25.6%
26.3%
25.9%26.0%
25.5%
2012 2013 2014 3Q14 YTD 3Q15 YTD
Restaurant-level EBITDA
Note: restaurant-level EBITDA excludes pre-opening costs
30
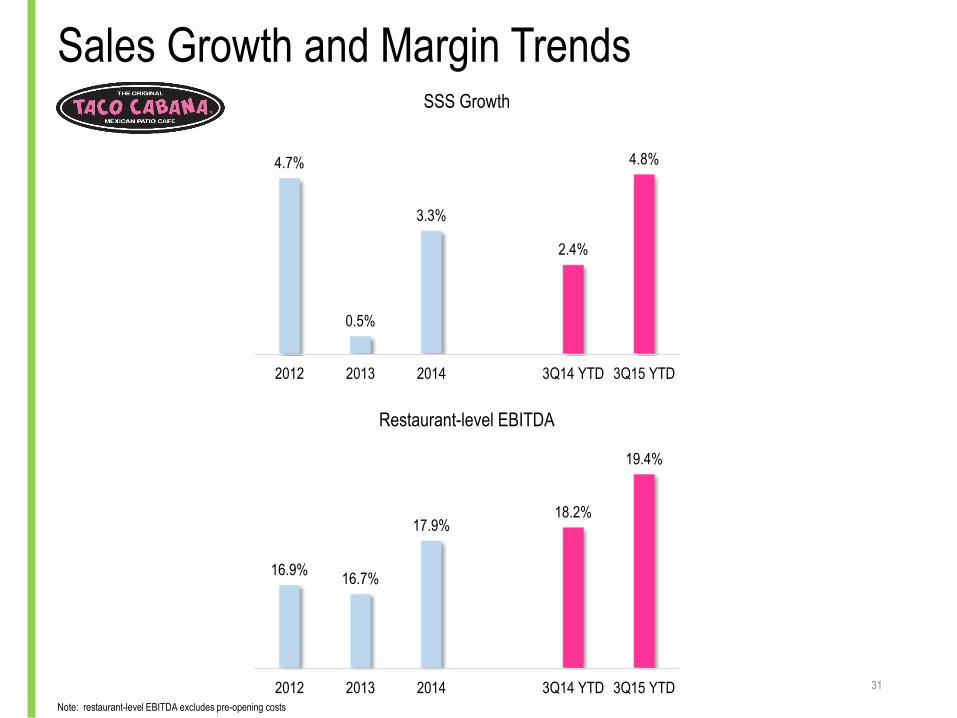
Sales Growth and Margin Trends
4.7%
0.5%
3.3%
2.4%
4.8%
2012 2013 2014 3Q14 YTD 3Q15 YTD
SSS Growth
Note: restaurant-level EBITDA excludes pre-opening costs
31
16.9%16.7%
17.9%18.2%
19.4%
2012 2013 2014 3Q14 YTD 3Q15 YTD
Restaurant-level EBITDA
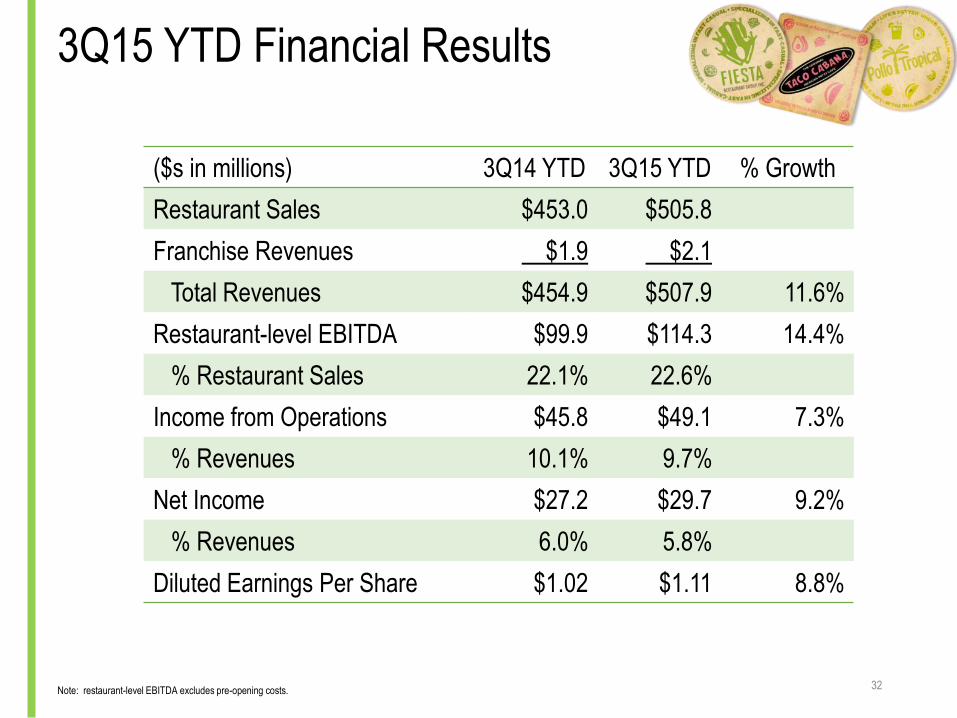
3Q15 YTD Financial Results
($s in millions) 3Q14 YTD 3Q15 YTD % Growth
Restaurant Sales $453.0 $505.8
Franchise Revenues $1.9 $2.1
Total Revenues $454.9 $507.9 11.6%
Restaurant-level EBITDA $99.9 $114.3 14.4%
% Restaurant Sales 22.1% 22.6%
Income from Operations $45.8 $49.1 7.3%
% Revenues 10.1% 9.7%
Net Income $27.2 $29.7 9.2%
% Revenues 6.0% 5.8%
Diluted Earnings Per Share $1.02 $1.11 8.8%
32Note: restaurant-level EBITDA excludes pre-opening costs.

Proven Business Model
($s in millions) FY 2012 FY 2013 % Gr. FY 2014 % Gr.
Same Store Sales
Pollo Tropical 8.1% 5.9% 6.6%
Taco Cabana 4.7% 0.5% 3.3%
Company-owned Restaurants
Pollo Tropical 91 102 12.1% 124 21.6%
Taco Cabana 160 165 3.1% 167 1.2%
Total Revenues $509.7 $551.3 8.2% $611.1 10.8%
Restaurant-level EBITDA Margin 20.8% 21.2% 21.9%
Operating Margin 7.3% 8.6% 9.7%
Adjusted Net Income $14.1 $20.2 42.6% $36.4 80.4%
Adj. Diluted Earnings Per Share $0.60 $0.84 40.0% $1.36 61.9%
33Note: restaurant-level EBITDA margin excludes pre-opening costs.

Focused Capital Allocation
($s in millions) 2015F Capital Expenditures
Low High
New Restaurant Development $70 $77
Remodeling, Reimaging & Maintenance $14 $15
IT & Other Projects $6 $8
Total Capital Expenditures $90 $100
New Restaurant Development Focused on Pollo Tropical
Implementing a New Reimaging Initiative at Pollo Tropical
Ongoing Strategic Investments to Optimize Restaurant Management,
Guest Experience and Infrastructure
34

Improved Leverage and Liquidity
($s in millions) FY 2012 FY 2013 FY 2014
Senior Secured Second Lien Notes $200.0 - -
Senior Secured Credit Facility - $71.0 $66.0
Capital Leases $1.0 $1.4 $1.3
Lease Financing Obligations $3.0 $1.7 $1.7
Total Debt $204.0 $74.0 $69.0
Less: Cash and Cash Equivalents $15.5 $11.0 $5.1
Total Net Debt $188.5 $63.0 $63.9
Total Adjusted EBITDA (TTM) $64.2 $69.8 $85.7
Total Net Debt / Total Adjusted EBITDA 2.9x 0.9x 0.7x
Repurchased $200M, 8.875% Notes in Q4 2013
$135M equity offering net proceeds
New 5-year $150M revolving credit facility (currently, LIBOR + 150 bps)
End of Q3 2015, $77.0M in Borrowing Capacity
New Capital Structure Contributed ~ 25% EPS Growth in 2014
35

Commodity % of COGS
Chicken 43.9 %
Pork 6.2 %
Dinner Rolls 3.9 %
Produce 3.7 %
Rice 2.7 %
Commodity % of COGS
Fajita Beef 13.1 %
Produce 10.2 %
Cheese 9.9 %
Fajita Chicken 5.8 %
Tortilla Dough 5.5 %
The Company Contracts Commodities With Some Suppliers
2015 Projected Commodity Increase ~ Mid Single Digits
2015 Commodities Under Fixed Pricing ~ 70%-80% COGS
The Company Plans to Offset Commodity Cost Increases with Pricing,
Cost Mitigation Tactics and Expense Savings Opportunities
Top 5 Food Purchases – 2015F Top 5 Food Purchases – 2015F
36
Commodity Cost Overview

2016 Operating Targets
Cost of Sales, as a % of Sales, Between 30% to 31%
Effective Tax Rate of 37% to 39%
G&A of Approximately $60 million to $62 million
SSS at Low to Mid Single Digit at Both Brands
Co-owned Restaurant Openings of 40 to 44
Capital Expenditures of $95 million to $110 million
37

Appendix
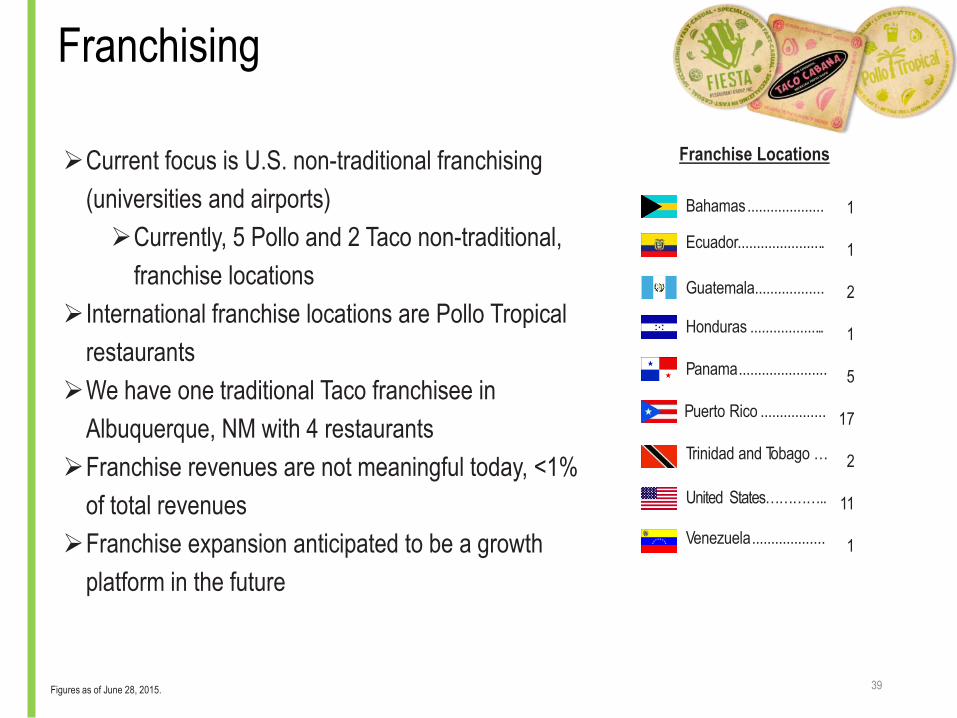
Franchise Locations
Bahamas....................
Ecuador.......................
Honduras ....................
Guatemala..................
Panama.......................
Puerto Rico .................
Trinidad and Tobago …
Venezuela...................
Figures as of June 28, 2015.
1
1
2
1
5
17
2
11
1
Current focus is U.S. non-traditional franchising
(universities and airports)
Currently, 5 Pollo and 2 Taco non-traditional,
franchise locations
International franchise locations are Pollo Tropical
restaurants
We have one traditional Taco franchisee in
Albuquerque, NM with 4 restaurants
Franchise revenues are not meaningful today, <1%
of total revenues
Franchise expansion anticipated to be a growth
platform in the future
United States…………..
Franchising
39

1. Adjusted EBITDA for each of our Pollo Tropical and Taco Cabana segments includes an allocation of general and administrative expenses associated with administrative support for executive management; information systems; and certain accounting, legal, supply chain, development, and other administrative functions.
($s in millions) FY2012 FY2013 FY2014 3Q14 YTD 3Q15 YTD
Restaurant-level Adjusted EBITDA Excluding Pre-Opening Costs:
Pollo Tropical 58.2$ 67.8$ 79.0$ 58.4$ 68.2$
Taco Cabana 47.2 48.7 54.2 41.6 46.1
Consolidated 105.4$ 116.5$ 133.2$ 99.9$ 114.3$
Less:
Pre-Opening Costs 1.7 2.8 4.1 3.3 3.9
Restaurant-level Adjusted EBITDA:
Pollo Tropical 57.1 65.7 75.6 55.5 64.6
Taco Cabana 46.6 48.0 53.5 41.1 45.9
Consolidated 103.7$ 113.7$ 129.1$ 96.6$ 110.5$
Add:
Franchise Royalty Revenues and Fees 2.4 2.4 2.6 1.9 2.1
Less:
General and Administrative (Excluding Stock-based Compensation) 41.8 46.2 46.0 33.5 38.6
Adjusted EBITDA1:
Pollo Tropical 38.6 43.7 52.7 39.2 44.0
Taco Cabana 25.6 26.1 33.0 25.8 30.0
Consolidated 64.2$ 69.8$ 85.7$ 65.0$ 74.0$
Less:
Depreciation and Amortization 18.3 20.4 23.0 17.0 21.8
Impairment and Other Lease Charges 7.0 0.2 0.4 0.2 0.5
Interest Expense 24.4 18.0 2.2 1.7 1.3
Loss on Extinguishment of Debt - 16.4 - - -
Provision for Income Taxes 4.3 3.8 21.0 16.9 18.1
Stock-Based Compensation 2.0 2.3 3.5 2.6 3.2
Other Expense / (Gain) (0.1) (0.6) (0.6) (0.6) (0.7)
Net Income 8.3$ 9.3$ 36.2$ 27.2$ 29.7$
40
Total Adjusted EBITDA Reconciliation

1. Restaurant-level adjusted EBITDA does not include franchise royalty revenues and fees or the allocation of corporate G&A expenses and brand G&A expenses for the applicable segment. Pre-opening expenses include costs incurred prior to opening a restaurant, including restaurant employee wages and related expenses, travel expenditures, recruiting, training and rent, in addition to promotional costs associated with the restaurant opening.
2. Adjusted EBITDA is defined as earnings attributable to the applicable segment before interest, loss on extinguishment of debt, income taxes, depreciation and amortization, impairment and other lease charges, stock-based compensation expense and other income and expense. It includes an allocation of corporate G&A expenses and brand G&A expenses (each excluding stock-based compensation).
3. Excludes stock-based compensation.
($s in millions) FY2012 FY2013 FY2014 3Q14 YTD 3Q15 YTD
Restaurant Sales 227.4$ 257.8$ 305.4$ 224.5$ 267.9$
Less:
Cost of Sales 75.4 85.5 100.5 74.2 89.7
Restaurant Wages and Related Expenses3 53.6 57.9 67.5 49.3 58.9
Restaurant Rent Expense 7.7 10.1 12.5 9.0 11.6
Other Restaurant Operating Expenses 26.8 30.8 38.3 27.9 32.7
Advertising Expense 5.7 5.7 7.7 5.7 6.7
Restaurant-Level Adjusted EBITDA Excluding
Pre-Opening Costs1 58.2$ 67.8$ 79.0$ 58.4$ 68.2$
Less: Pre-Opening Costs 1.1 2.0 3.4 2.8 3.6
Restaurant-Level Adjusted EBITDA1 57.1$ 65.7$ 75.6$ 55.5$ 64.6$
Add: Franchise Revenue 1.9 1.9 2.1 1.6 1.6
Less: General and Administrative Expenses3 20.4 23.9 24.9 17.9 22.2
Adjusted EBITDA2 38.6$ 43.7$ 52.7$ 39.2$ 44.0$
Adjusted EBITDA Reconciliation
41
1. Restaurant-level adjusted EBITDA does not include franchise royalty revenues and fees or the allocation of corporate G&A expenses and brand G&A expenses for the applicable segment. Pre-opening expenses include costs incurred prior to opening a restaurant, including restaurant employee wages and related expenses, travel expenditures, recruiting, training, and rent, in addition to promotional costs associated with the restaurant opening.
2. Adjusted EBITDA is defined as earnings attributable to the applicable segment before interest, loss on extinguishment of debt, income taxes, depreciation and amortization, impairment and other lease charges, stock-based compensation expense and other income and expense. It includes an allocation of corporate G&A expenses and brand G&A expenses (each excluding stock-based compensation).
3. Excludes stock-based compensation.
($s in millions) FY2012 FY2013 FY2014 3Q14 YTD 3Q15 YTD
Restaurant Sales 279.9$ 291.1$ 303.1$ 228.5$ 237.9$
Less:
Cost of Sales 88.1 90.6 91.8 69.3 71.1
Restaurant Wages and Related Expenses3 82.6 85.5 87.6 66.0 68.1
Restaurant Rent Expense 13.9 16.7 17.2 12.9 12.8
Other Restaurant Operating Expenses 37.0 38.2 40.6 30.1 31.0
Advertising Expense 11.1 11.4 11.8 8.6 8.8
Restaurant-Level Adjusted EBITDA Excluding
Pre-Opening Costs1 47.2$ 48.7$ 54.2$ 41.6$ 46.1$
Less: Pre-Opening Costs 0.6 0.7 0.7 0.5 0.2
Restaurant-Level Adjusted EBITDA1 46.6$ 48.0$ 53.5$ 41.1$ 45.9$
Add: Franchise Revenue 0.5 0.5 0.5 0.4 0.5
Less: General and Administrative Expenses3 21.4 22.4 21.1 15.7 16.3
Adjusted EBITDA2 25.6$ 26.1$ 33.0$ 25.8$ 30.0$
Adjusted EBITDA Reconciliation
42

(a) Impairment and other lease charges for the twelve months ended December 30, 2012 are primarily related to the closure of five Pollo Tropical restaurants in New Jersey in the first quarter of 2012. Impairment and other lease charges for each period are presented net of taxes of $0.1 million, $0.1 million and $2.4 million for the twelve months ended December 28, 2014, December 29, 2013 and December 30, 2012, respectively.
(b) Prior to the spin-off from Carrols Restaurant Group, Inc. ("Carrols"), certain sale-leaseback transactions were classified as lease financing transactions because Carrols guaranteed the related lease payments. Effective upon the spin-off, the provisions that previously precluded sale-leaseback accounting were cured or eliminated. As a result, the real property leases entered into in connection with these transactions are now recorded as operating leases. Additionally, in the second quarter of 2012, we exercised purchase options associated with the leases for five restaurant properties also previously accounted for as lease financing obligations and purchased those properties from the lessor.
The amount reported as "qualification for sale leaseback accounting" represents the net increase in rent expense, decrease in depreciation expense and decrease in interest expense, that would have impacted net income had the leases been accounted for as operating leases for all periods presented, based on the deferred gain on sale-leaseback transactions calculated at the time of the spin-off, and had the five properties been owned for the full year ended December 30, 2012. Qualification for sale leaseback accounting is shown net of taxes of $0.6 million in the twelve months ended December 30, 2012. This amount is included for comparative purposes only, and may not be indicative of what actual results would have been had the qualification for sale-leaseback accounting treatment of these leases (and the treatment of such leases as operating leases) occurred on the dates described above.
(c) Secondary offering expenses for the twelve months ended December 29, 2013 include expenses related to the underwritten secondary public equity offering completed during March 2013 totaling $0.4 million. The Company did not receive any proceeds from the sale of shares in the offering. Secondary offering expenses are presented net of taxes of $0.2 million.
(d) The Company recognized a loss on extinguishment of debt of $16.4 million in the fourth quarter of 2013 related to the repurchase and redemption of its Notes. The loss on extinguishment of debt for the twelve months ended December 29, 2013 is presented net of taxes of $5.9 million.
($s in millions, except per share amounts)
$ EPS $ EPS $ EPS
Net Income 8.3$ 0.35$ 9.3$ 0.39$ 36.2$ 1.35$
Add (each net of tax effect):
Impairment and other lease charges (a) 4.6 0.20 0.1 - 0.2 0.01
Qualification for sale leaseback accounting (b) 1.2 0.05 - - - -
Secondary offering expenses (c) - - 0.3 0.01 - -
Loss on extinguishment of debt (d) - - 10.5 0.44 - -
Adjusted net income & EPS 14.1$ 0.60$ 20.2$ 0.84$ 36.4$ 1.36$
FY2012 FY2013 FY2014
Adjusted Net Income Reconciliation
43
Adjusted EBITDA, restaurant-level adjusted EBITDA, and restaurant-level adjusted EBITDA excluding pre-opening costsare all non-GAAP financial measures. Management believes that such financial measures, when viewed with our results ofoperations calculated in accordance with GAAP and our reconciliation of restaurant-level adjusted EBITDA and restaurant-level adjusted EBITDA excluding pre-opening costs and adjusted EBITDA to net income (i) provide useful informationabout our operating performance and period-over-period growth (including at the restaurant level), (ii) provide additionalinformation that is useful for evaluating the operating performance of our business, and (iii) permit investors to gain anunderstanding of the factors and trends affecting our ongoing earnings, from which capital investments are made and debtis serviced. However, such measures are not measures of financial performance or liquidity under GAAP and, accordingly,should not be considered as alternatives to net income or cash flow from operating activities as indicators of operatingperformance or liquidity. Also these measures may not be comparable to similarly titled captions of other companies.
Adjusted net income and related adjusted earnings per share are non-GAAP financial measures. Adjusted net income isdefined as net income before impairment and other lease charges, the impact of the qualification for sale-leasebackaccounting (primarily upon the spin-off from Carrols) for certain leases previously accounted for as lease financingobligations, secondary offering expenses and loss on extinguishment of debt. Management believes that adjusted netincome and related adjusted earnings per diluted share, when viewed with our results of operations calculated inaccordance with GAAP (i) provide useful information about our operating performance and period-over-period growth, (ii)provide additional information that is useful for evaluating the operating performance of our business, and (iii) permitinvestors to gain an understanding of the factors and trends affecting our ongoing earnings, from which capitalinvestments are made and debt is serviced. However, such measures are not measures of financial performance orliquidity under GAAP and, accordingly should not be considered as alternatives to net income or net income per share asindicators of operating performance or liquidity. Also these measures may not be comparable to similarly titled captions ofother companies.
Use of Non-GAAP Financial Measures
44