Embed Size (px)
Citation preview
Energy Renaissance: Why you need Energy Renaissance: Why you need an Emerging Market Strategy for an Emerging Market Strategy for
SuccessSuccess
Industry Best Practice: Using a Systematic Approach to Industry Best Practice: Using a Systematic Approach to Designing Country Pipeline Systems (GILDesigning Country Pipeline Systems (GIL--100 Index)100 Index)
© 2013 Frost & Sullivan. All rights reserved. This document contains highly confidential information and is the sole property of Frost & Sullivan. No part of it may be circulated, quoted, copied or otherwise reproduced without the written approval of Frost & Sullivan.

Roberta Gamble
Partner, Energy & Environment
Frost & Sullivan
Today’s Presenters
Importance of Emerging
Markets to Energy & Energy
Intensive Industries
Frost & Sullivan’s GIL-100
Energy and Energy Intensive Dr. Vinod Aggarwal
2
Energy and Energy Intensive
Industries (EII) Index
Leveraging the GIL-100 EII
Index
Dr. Vinod Aggarwal
Chief Economist, Frost & Sullivan
John Raspin
Partner, Energy & Environment
Frost & Sullivan

The Importance of Emerging Markets to Energy & Energy Intensive
Industries
Roberta Gamble
3
Industries

Major Energy Trends
Global Energy Trends and Inflection Points
Energy Inflection Points
Iraq to emerge as a strategic source of world oil supply by the 2030s
Growing World Energy Consumption
• Expected to grow by 30% by 2040 (over 2010)
Green Energy
• Use of renewable energy doubled
!
4
Shale Gas
• Commercial production in the
United States
• Huge reserves in China
United States to replace Saudi Arabia as the largest oil exporter by mid 2020
Global nuclear power generation will be scaled down following Fukushima Daiichi disaster
• Use of renewable energy doubled
between 2000 and 2012
• Use of oil declining
• Use of natural gas increasing
!
!
Source: Frost & Sullivan

Energy Renaissance: Renewable Energy Shapes the World
Forms of Renewable Energy
Hydro Power
Wind Power
Solar Photovoltaics (PV)
Policy Support• Less than 50 countries worldwide had renewable
energy support policies in the past decade• As of 2013, 120 countries have renewable energy
policies
Cost Advantage• Technological innovation has led to a decline in PV
Energy Renaissance: Renewable Energy takes the Lead
5
Concentrated Solar Power (CSP)
Biomass and Waste
Geothermal Power
Marine Power
module prices by up to 75 percent between 2008 and 2012
• The price of wind turbines has declined by 25 percent during the past three years
Focus on Emerging Markets• 2012 witnessed a marked decline in renewable
energy investment in developed countries• The economic downturn in the Western world led to a
gradual shift of investment in renewable energy to emerging countries
Source: Frost & Sullivan
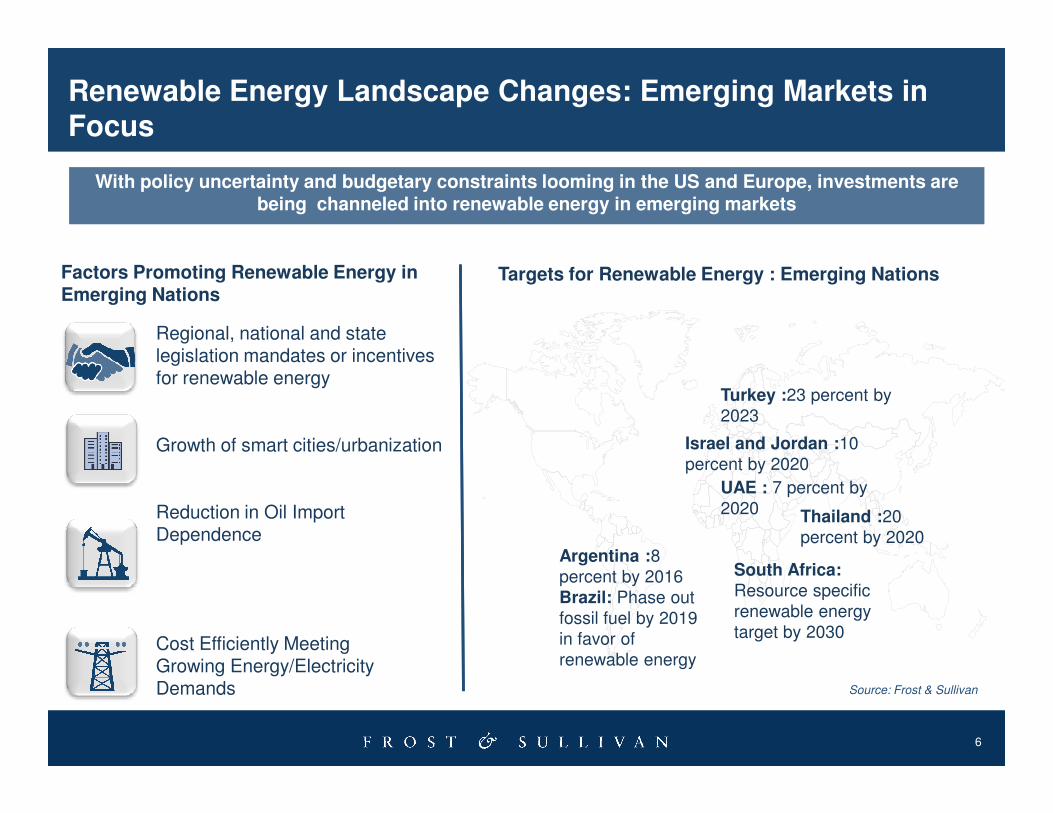
Renewable Energy Landscape Changes: Emerging Markets in Focus
With policy uncertainty and budgetary constraints looming in the US and Europe, investments are being channeled into renewable energy in emerging markets
Factors Promoting Renewable Energy in Emerging Nations
Regional, national and state legislation mandates or incentives for renewable energy
Targets for Renewable Energy : Emerging Nations
Turkey :23 percent by 2023
6
Growth of smart cities/urbanization
Reduction in Oil Import Dependence
2023
Israel and Jordan :10 percent by 2020
UAE : 7 percent by 2020
Argentina :8 percent by 2016Brazil: Phase out fossil fuel by 2019 in favor of renewable energy
South Africa: Resource specific renewable energy target by 2030
Thailand :20 percent by 2020
Cost Efficiently Meeting Growing Energy/Electricity Demands Source: Frost & Sullivan
North America
255.9323.8
393.5
EU
2010 2015 2020
283.9 409.4503.8
Russia
2010 2015 2020
48.752.0 56.8
China
2010 2015 2020
250.9
404.8
538
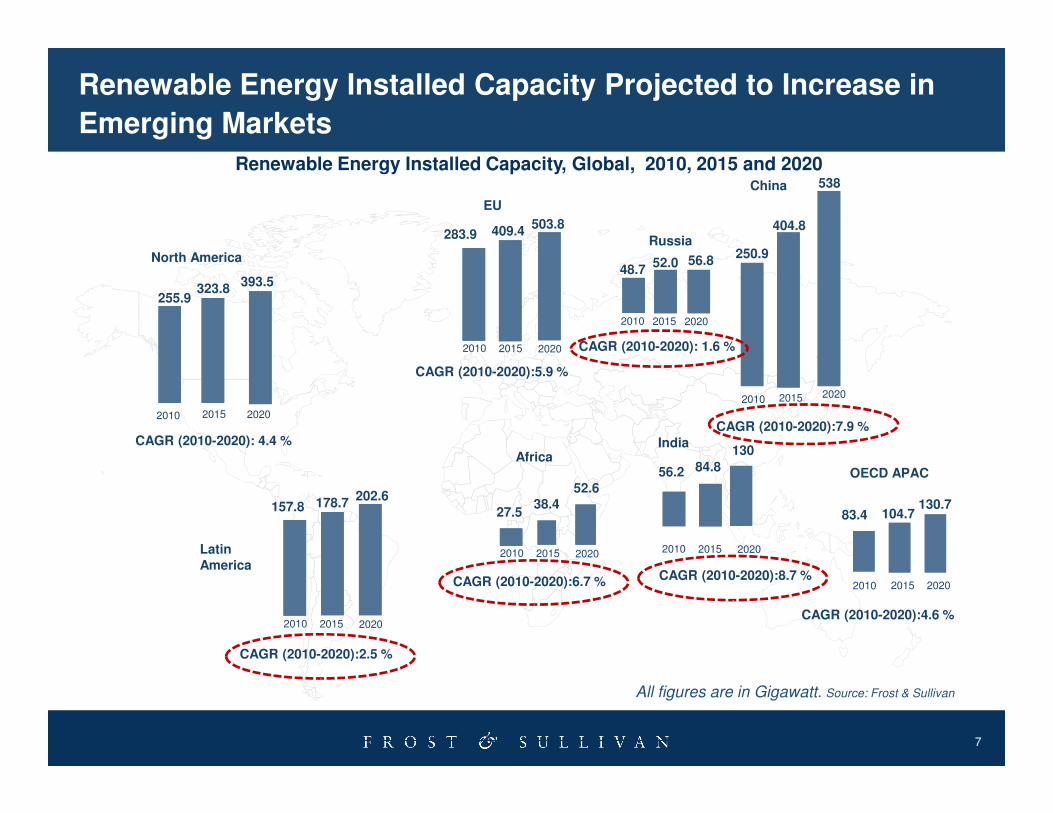
Renewable Energy Installed Capacity Projected to Increase in
Emerging Markets
Renewable Energy Installed Capacity, Global, 2010, 2015 and 2020
CAGR (2010-2020):5.9 %
CAGR (2010-2020): 1.6 %
7
2010 2015 2020
OECD APAC
2010 2015 2020
83.4 104.7130.7
Latin America
20152010 2020
157.8 178.7202.6
Africa
52.638.4
27.5
202020152010
India
2010 2015 2020
84.856.2
130
All figures are in Gigawatt. Source: Frost & Sullivan
CAGR (2010-2020): 4.4 %
CAGR (2010-2020):2.5 %
CAGR (2010-2020):6.7 % CAGR (2010-2020):8.7 %
CAGR (2010-2020):7.9 %
CAGR (2010-2020):4.6 %
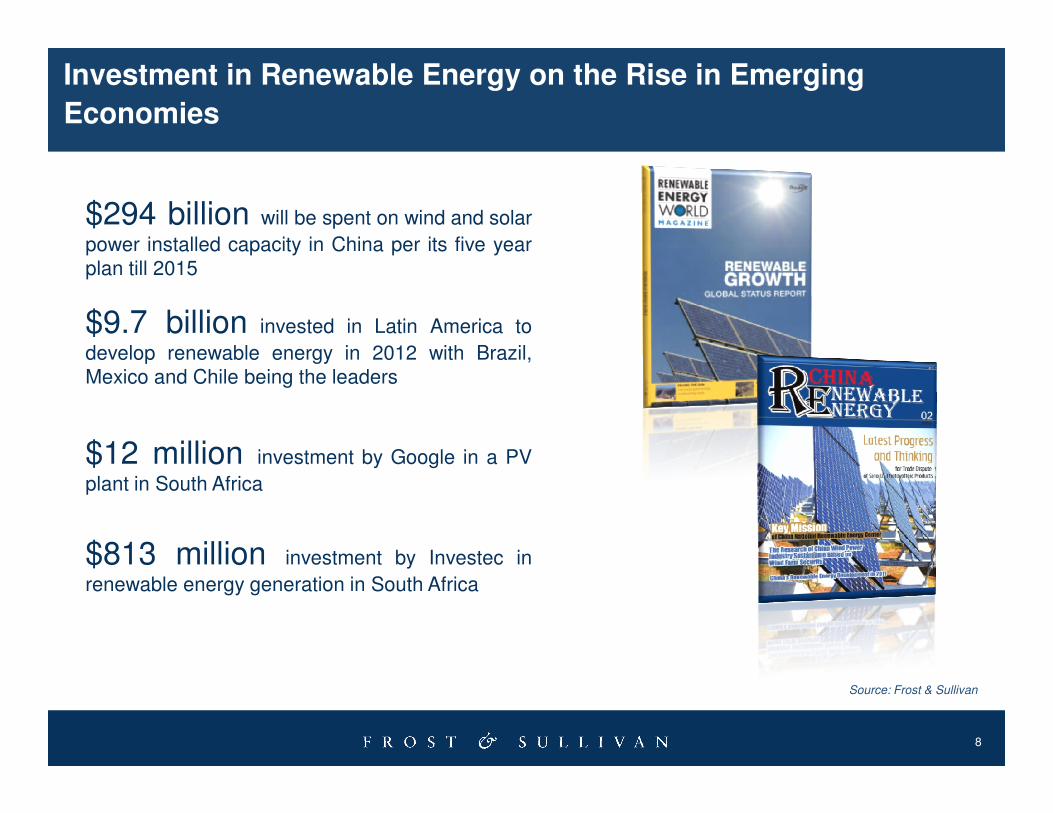
Investment in Renewable Energy on the Rise in Emerging
Economies
$294 billion will be spent on wind and solar
power installed capacity in China per its five yearplan till 2015
$9.7 billion invested in Latin America to
develop renewable energy in 2012 with Brazil,Mexico and Chile being the leaders
8
$12 million investment by Google in a PV
plant in South Africa
$813 million investment by Investec in
renewable energy generation in South Africa
Source: Frost & Sullivan

Diverse challenges that can exist in an Emerging Market
Regulatory
Need for local partners and/ or networks
Product customization
Competition
Robust business planning
Infrastructural development
Emerging Market Entry Strategies Need to Address a Mix of
Client Challenges
9
Regulatory challenges
Competition from local players
Risks in entering Emerging Markets• Financial risk• Risk to business continuity• Product risk• Market risk
Source: Frost & Sullivan

Poll Question #1
10

Frost & Sullivan’s GIL-100 EII Index
Dr. Vinod Aggarwal
11
Index

Solution for Client Challenges
What is our Value Proposition?
The Emerging Market Innovation program’s fundamental value proposition: define,design and drive an Emerging Market Strategy.
Why is an Emerging Market Strategy Important?
To address dramatic global energy market changes, we help companies create a country pipeline to understand supply and demand that uses a data driven best
12
country pipeline to understand supply and demand that uses a data driven best practices approach
What is our Best Practices Approach?
• Leverage Growth, Innovation & Leadership (GIL) 100 Index and Country Pipeline Systems
• Customize the model based on criteria that is important to your business• Continuously monitor the country pipeline systems for opportunities and changes• Adopt an immersive approach by networking with industry peers and emerging market
expertsSource: Frost & Sullivan
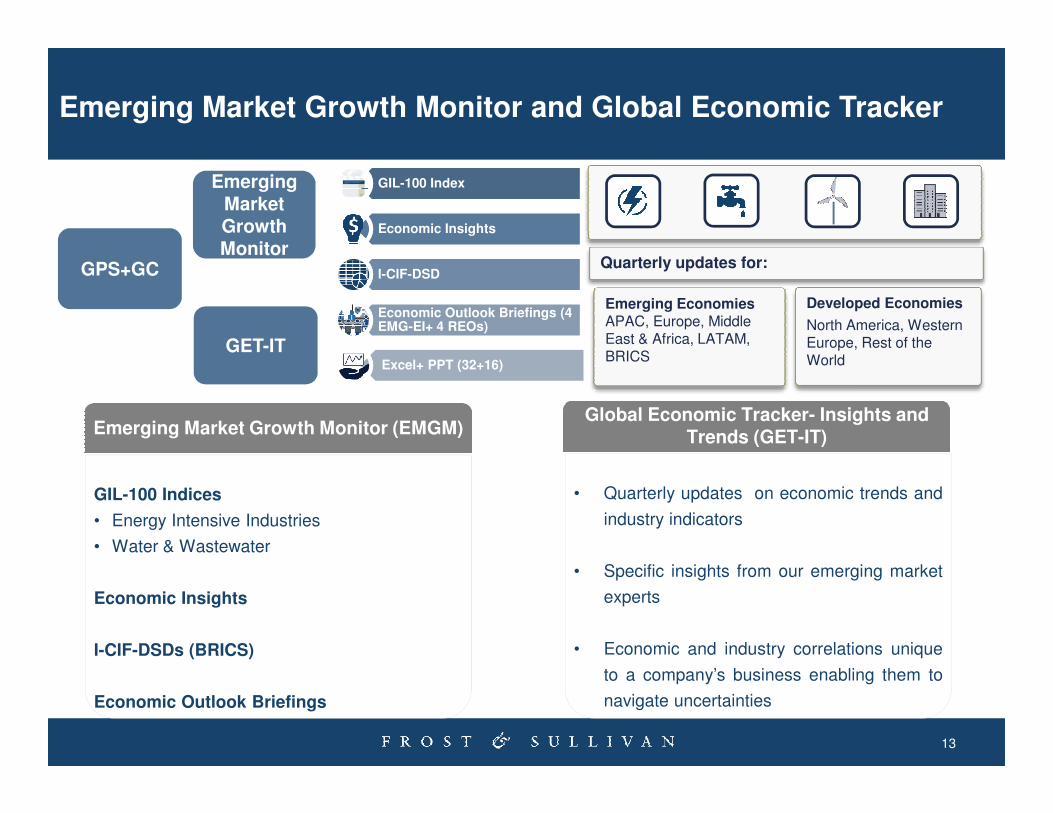
Emerging Market Growth Monitor and Global Economic Tracker
Global Economic Tracker- Insights and
GIL-100 Index
Economic Insights
I-CIF-DSD
Economic Outlook Briefings (4 EMG-EI+ 4 REOs)
Excel+ PPT (32+16)
GET-IT
Emerging Market Growth Monitor
GPS+GC Quarterly updates for:
Emerging EconomiesAPAC, Europe, Middle East & Africa, LATAM, BRICS
Developed Economies
North America, Western Europe, Rest of the World
13
Emerging Market Growth Monitor (EMGM)Global Economic Tracker- Insights and
Trends (GET-IT)
GIL-100 Indices
• Energy Intensive Industries
• Water & Wastewater
Economic Insights
I-CIF-DSDs (BRICS)
Economic Outlook Briefings
• Quarterly updates on economic trends and
industry indicators
• Specific insights from our emerging market
experts
• Economic and industry correlations unique
to a company’s business enabling them to
navigate uncertainties

Best Practices Approach : GIL-100 Index for Energy
Intensive Industries
Growth, Innovation, 1
Supply Side Index
Source: Frost & Sullivan
14
Growth, Innovation, and Leadership Indicators
Country Coverage
Index Construction
GDP Brackets
2
3
4
Supply Side Index• The GIL-100 Energy Supply Side Index ranks countries that produce
energy on a large scale
• Manufacturers of equipment used in the production and supply of energycan evaluate sales opportunities (turbine manufacturers, transformers,heat exchangers)
Demand Side Index• The GIL-100 demand side index ranks countries that are most conducive
to industrial development (energy intensive industries)
• The index will help manufacturers of equipment used in industries that areenergy intensive identify sales opportunities (pasteurisers, pumps, motors)

Using the GIL-100 Index: A Simple 3-Step Process
Select Pillar Weights
100 Countries
50 – 30 Countries
50 – 30 Countries
Develop a Country Pipeline31
15
Select Weights for Indicators of Each Pillar2
5 – 10 Countries by Region and by GDP Bracket
Source: Frost & Sullivan

Sample Analysis: Three-Phased Project Process
PHASE I PHASE II PHASE III
AS
SE
SS
ME
NT
OF
TO
P 3
0 C
OU
NT
RIE
S
Evaluate and weight/ rank 30 target countries for market expansion on
FIT
AS
SE
SS
ME
NT
AN
D G
RO
WT
H
OP
PO
RT
UN
ITY
WO
RK
SH
OP
DIV
E A
NA
LYS
IS O
F T
OP
CO
UN
TR
IES
Growth Opportunity:Available customer base
Business MilieuBusiness Milieu
Business setup requirements, Taxation,
Total Electricity Net
Generation
Total Electricity Net
Consumption
Evaluate top countries for market expansion
An interactive strategy development session between Frost & Sullivan and Client to
Prioritize and select the best countries for growth based on capabilities, fit and external opportunities.
16
BR
OA
D A
SS
ES
SM
EN
T O
F T
OP
30
CO
UN
TR
IES
ST
RA
TE
GIC
FIT
AS
SE
SS
ME
NT
AN
D G
RO
WT
H
OP
PO
RT
UN
ITY
WO
RK
SH
OP
DE
EP
DIV
E A
NA
LYS
IS O
F T
OP
CO
UN
TR
IES
Business setup requirements, Taxation, Labor Laws, etc.
Corporate EnvironmentCorporate Environment
Ease of doing business, corruption perception, trading and infrastructure
Growth ProspectsGrowth Prospects
Market sizing and forecasts, market trends
Country Risks
Political, economic and financial risks
Market AnalysisMarket Analysis
Value chain analysis, customer analysis and competitive landscape
Consumption
Economics
Infrastructure
Other
Petroleum Consumption
opportunities.
Generate a roadmap for target countries and market entry strategies in Phase IV
Source: Frost & Sullivan

Emerging Market Innovation (EMI) Value Proposition for Energy
and Energy Intensive Industry Clients
Economic Insights
• Economic insights are designed to leverage a
systematic data foundation and develop valuable
insights on growth trends that are currently impacting
]
17
insights on growth trends that are currently impacting
global markets
• They delve into pertinent economic issues and present
analysis and actionable insights that are imperative for
impending business decisions
GIL 100 IndexRenewable Energy
]
]
Smart Cities
Source: Frost & Sullivan

Poll Question #2
18
Leveraging the GIL-100 Index for EII
John Raspin
19
for EII

Making all the Right Moves : Structuring your Emerging
Market Strategy
• How should your company prioritize emerging markets beyond BRIC countries based on the
factors most relevant to your company and
products?
• If I look for a sales opportunity in Russia, how cost competitive will I be compared to local players?
Companies are shifting toward emerging markets for better sales opportunities and also to penetrate high growth domestic markets
20
competitive will I be compared to local players?
• Which countries make the most sense for sales opportunities for energy equipment based on their industry outlook and ease of doing business?
“We were delighted with the Macro-to-Micro perspectivethat Frost & Sullivan proposed as part of supportingour quest to develop a systematic Country PipelineSystem. A data driven decision approach that typicallychallenges a "gut feel" approach to the next bigmarkets was important for us…”
– Senior Management of a leading equipment manufacturing company
?Tier II
India, Saudi Arabia, UAE, Qatar
Tier IChina, Russian Federation, Brazil
Source: Frost & Sullivan

Important Pillar IndicatorsBase Model Rating
CustomizedModelRating
Total Renewable Electricity Net
Looking for the fastest growth markets in Europe to sell wind turbines
European Wind Turbine
Manufacturing Company
Customizing the GIL- 100 EII Supply Side Index
Index Pillar
Base Model Pillar
Weight
CustomizedModel Pillar
Weight
21
Total Renewable Electricity Net Generation
Wind Electricity Net Generation
Total Renewable Electricity Net Consumption
Total Renewable Electricity Installed Capacity
Wind Electricity Installed Capacity
� �� ���� Low Medium High Very HighRemoved
Growth 70 70
Innovation 20 20
Leadership 10 10
��
�� ���
���
� ���
�� ���
�� ���
Source: Frost & Sullivan
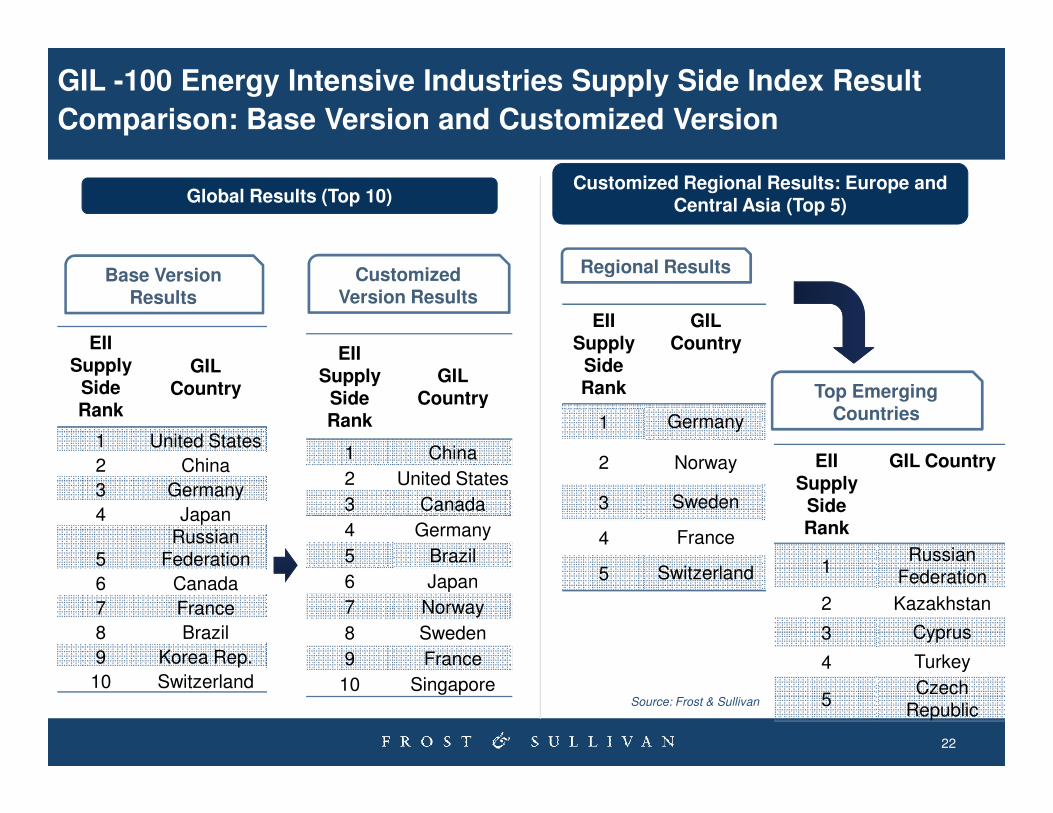
EIISupply
Side Rank
GILCountry
Global Results (Top 10)
EII Supply
Side Rank
GILCountry
GIL -100 Energy Intensive Industries Supply Side Index Result
Comparison: Base Version and Customized Version
EIISupply
Side GIL
Country
Customized Regional Results: Europe and Central Asia (Top 5)
Base Version Results
Customized Version Results
Regional Results
Top Emerging Countries
22
Rank
1 United States
2 China
3 Germany
4 Japan
5Russian
Federation
6 Canada
7 France
8 Brazil
9 Korea Rep.
10 Switzerland
1 Germany
2 Norway
3 Sweden
4 France
5 Switzerland
EII Supply
Side Rank
GIL Country
1Russian
Federation
2 Kazakhstan
3 Cyprus
4 Turkey
5Czech
Republic
Side Rank
Country
1 China
2 United States
3 Canada
4 Germany
5 Brazil
6 Japan
7 Norway
8 Sweden
9 France
10 Singapore
Countries
Source: Frost & Sullivan

Important Pillar IndicatorsBase Model Rating
CustomizedModelRating
Total Milk Production
Looking for potential markets in Asia to sell milk pasteurizers
North American Equipment Manufacturing
Company in Food and Beverage Industry
Customizing the GIL- 100 EII Demand Side Index
Index Pillar
Base Model Pillar
Weight
CustomizedModel Pillar
Weight
� ���
23
Total Milk Production
Butter and Other Products
Cheese Production
Evaporate and Condensed Milk Production
Skim and Butter Milk Production
Fresh Cream Production
Gross Expenditure on Research and Development (% of GDP)
� �� ���� Low Medium High Very HighRemoved
Growth 40 10
Innovation 40 80
Leadership 20 10
�
���
���
���
���
���
���
��
�
�
�
�
�
�
Source: Frost & Sullivan

EIIDemand
Side Rank
GIL Country
Global Results (Top 10)
EII Demand
Side Rank
GIL Country
GIL -100 Energy Intensive Industries Demand Side Index Result
Comparison: Base Version and Customized Version
EIIDemand
Side GIL Country
Customized Regional Results: APAC(Top 5)
Base Version Results
Customized Version Results
Regional Results
Top Emerging Countries
24
Rank
1 China
2 United States
3 Germany
4 Japan
5 France
6 India
7 Canada
8 Korea, Rep.
9 Singapore
10 Netherlands
1 China
2 Japan
3 Korea, Rep
4 Singapore
5 India
EII Demand
Side Rank
GIL Country
1 China
2 India
3 Malaysia
4 Thailand
5 Philippines
Rank
1 United States
2 Germany
3 China
4 Japan
5 France
6 Korea, Rep.
7 Singapore
8 Netherlands
9 India
10 Sweden
Countries
Source: Frost & Sullivan

Important Pillar IndicatorsBase Model Rating
CustomizedModelRating
Looking for growth markets in LATAM to sell electric arc furnaces
European Equipment Manufacturing
Company in Steel Industry
Customizing the GIL- 100 EII Demand Side Index
Index Pillar
Base Model Pillar
Weight
CustomizedModel Pillar
Weight
�����
25
Crude Steel Production
Apparent Steel Use
Import of Iron and Steel
Export of Iron and Steel
Electricity Consumption by Industry and Construction
IIP Growth
� �� ���� Low Medium High Very HighRemoved
Growth 40 70
Innovation 40 20
Leadership 20 10
���
���
�� ��
�� ��
��
��
��
��
��
��
Source: Frost & Sullivan

EIIDemand
Side Rank
GIL Country
Global Results (Top 10)
EII Demand
Side Rank
GIL Country
GIL -100 Energy Intensive Industries Demand Side Index Result
Comparison: Base Version and Customized Version
EIIDemand
Side Rank
GIL Country
Regional Results: Emerging LATAM Countries (Top 5)
Base Version Results
Customized Version Results
Base Version Results
Customized Version Results
26
Rank
1 China
2 United States
3 Germany
4 Japan
5 France
6 India
7 Canada
8 Korea, Rep.
9 Singapore
10 Netherlands
1 Brazil
2 Chile
3 Mexico
4 Argentina
5 Uruguay
EII Demand
Side Rank
GIL Country
1 Brazil
2Argentina
3 Uruguay
4 Chile
5Peru
Rank
1 China
2 United States
3 Germany
4 Korea, Rep.
5 Japan
6 India
7 Singapore
8 Brazil
9Russian
Federation
10 France
Version Results
Source: Frost & Sullivan

GIL-100 Index Workshop
Macro Micro
GIL-100 Index Workshop
A ½ day onsite or virtual briefing session where a team of qualified and trained Frost & Sullivan facilitators and analyst conduct presentations and guide clients on how to prioritize growth opportunities and define growth strategies. Workshop requirements & content must be defined and agreed in advance.
27
½ Day WorkshopGIL-100 Index Detailed Country Investigation
In Scope Not In Scope
Source: Frost & Sullivan

Who are Your Regional Contacts?
EuropeEnguerran Ripert
Cyril Cromier
Roberta Gamble/ Ravi K/ John Raspin
Global Energy Champions
North AmericaVishal SapruNils Frenkel
28
APACSuchitra Sriram

Follow Frost & Sullivan on Facebook, LinkedIn, SlideShare, and Twitter
http://www.facebook.com/FrostandSullivan
https://www.linkedin.com/groups/Future-Energy-4727266
29
http://twitter.com/frost_sullivan
https://www.linkedin.com/groups/Future-Energy-4727266
http://www.slideshare.net/FrostandSullivan

Your Feedback is Important to Us
• Designing an Emerging Market Strategy?
• Creating a Country Pipeline Systems?
• Emerging Market Economic & Industry Indicators
• Strategic Scenario Planning?
What would you like to see from Frost & Sullivan?
30
• Interactive – Ask the Experts?
• Other?
Please inform us by “rating” this presentation.
Frost & Sullivan’s Growth Consulting can assist with your growth strategies

Q&A
4675-90 31

For Additional Information
Liz Clark
Corporate [email protected]
32
Sathyajit Rao
Vice President
Emerging Market Innovation
Prerna Mohan
Industry Manager
Emerging Market Innovation

The Frost & Sullivan Story
19611961 19901990 TodayToday
EmergingEmerging ResearchResearch19611961––19901990
Growth PartnershipGrowth Partnership19901990––TodayToday
Visionary InnovationVisionary InnovationTodayToday––FutureFuture
33
Pioneered Emerging Market & Technology Research
• Global Footprint Begins
• Country Economic Research
• Market & Technical Research
• Best Practice Career Training
• MindXChange Events
Partnership Relationship with Clients
• Growth Partnership Services
• GIL Global Events
• GIL University
• Growth Team Membership
• Growth Consulting
Visionary Innovation
• Mega Trends Research
• CEO 360 Visionary Perspective
• GIL Think Tanks
• GIL Global Community
• Communities of Practice