Embed Size (px)
Citation preview

May 2016

2
1 Industry Data center 101
2 Strategy and Overview Introduction and strategic direction
3 GlobalPlatform Growing world-wide demand from a diversified customer base
4 Connected Campus Strategy Solving for the complete deployment; land and expand
5 AttractiveGrowth Prospects
Organic growth combined with lease-up opportunity
6 PrudentCapital Allocation Disciplined investment criteria guided by Return on Invested Capital
7 ConservativeFinancial Strategy Committed to maintaining a strong balance sheet
8 Recent Results First quarter 2016 highlights
Business HighlightsPositioned to Drive Shareholder Value
Introduction toData Centers
3
Data Center 101What is a Data Center?
4
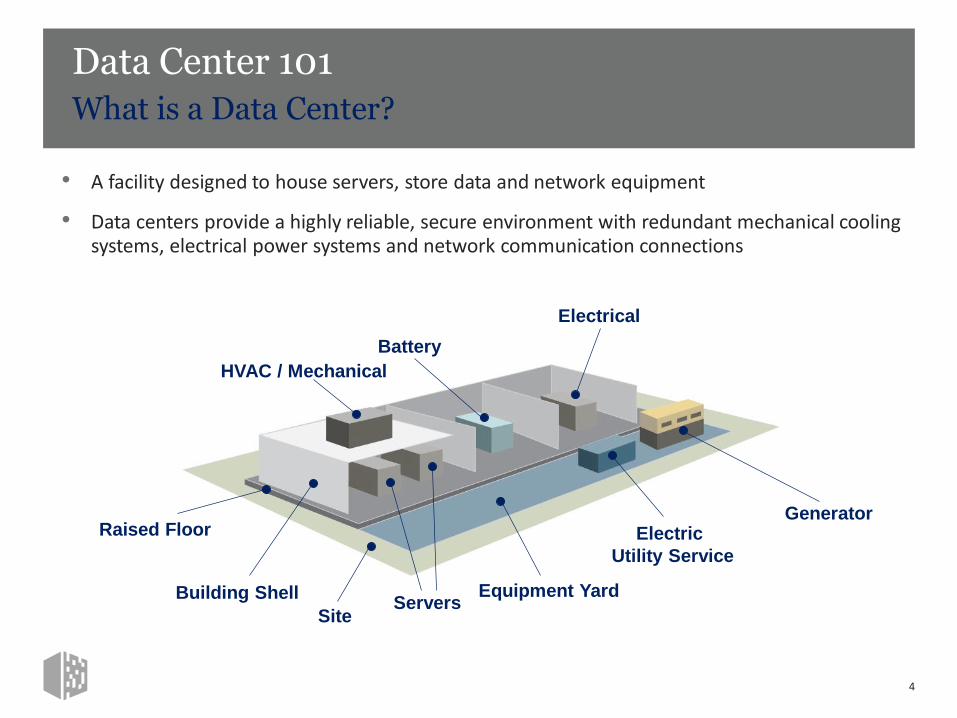
• A facility designed to house servers, store data and network equipment
• Data centers provide a highly reliable, secure environment with redundant mechanical cooling systems, electrical power systems and network communication connections
Building Shell
HVAC / Mechanical
Battery
Generator
Servers
Raised Floor
Electrical
Site
Electric
Utility Service
Equipment Yard
Customer-Driven Data Center SolutionsDesigned to Address Global Demand
5
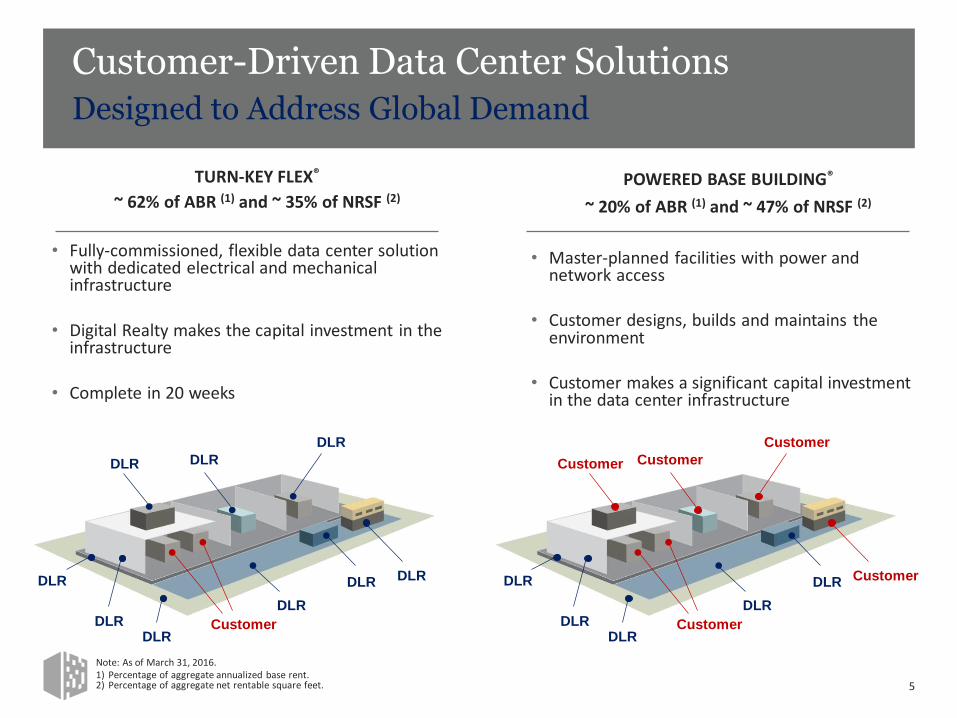
TURN-KEY FLEX®
~ 62% of ABR (1) and ~ 35% of NRSF (2)
• Fully-commissioned, flexible data center solution with dedicated electrical and mechanical infrastructure
• Digital Realty makes the capital investment in the infrastructure
• Complete in 20 weeks
DLR
POWERED BASE BUILDING®
~ 20% of ABR (1) and ~ 47% of NRSF (2)
• Master-planned facilities with power and network access
• Customer designs, builds and maintains the environment
• Customer makes a significant capital investment in the data center infrastructure
Customer
Note: As of March 31, 2016.1) Percentage of aggregate annualized base rent.2) Percentage of aggregate net rentable square feet.
DLR
DLR
DLR
DLR
DLR
DLR
DLR
DLR
DLR
Customer
Customer
DLR
Customer
Customer
Customer
DLR
DLR
DLR
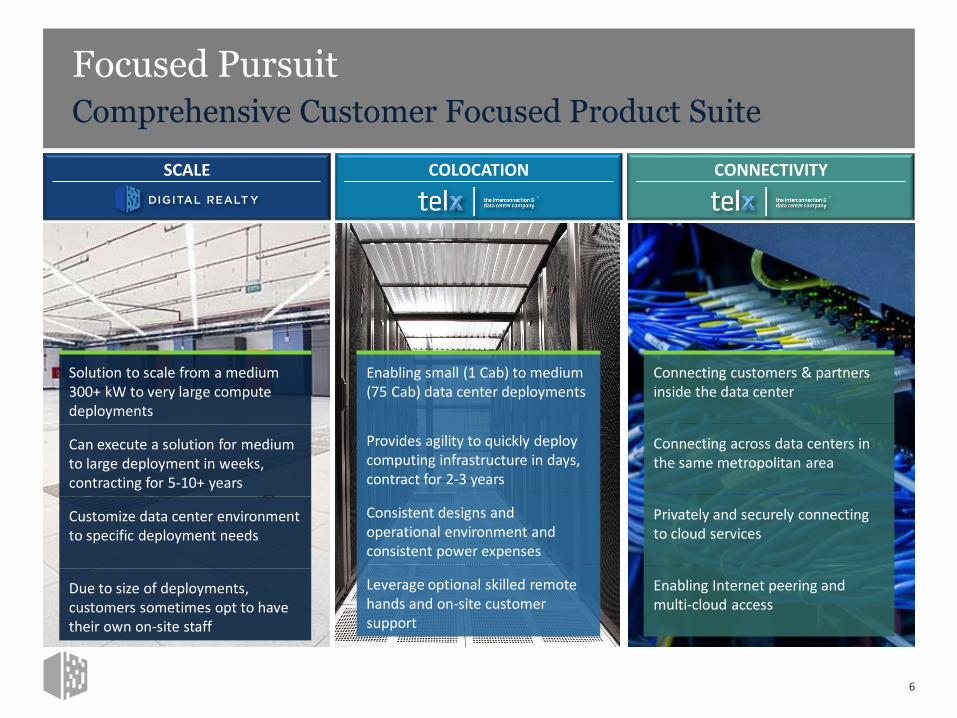
COLOCATION CONNECTIVITY
Focused PursuitComprehensive Customer Focused Product Suite
6
Connecting customers & partners inside the data center
Connecting across data centers in the same metropolitan area
Privately and securely connecting to cloud services
Enabling Internet peering and multi-cloud access
Enabling small (1 Cab) to medium (75 Cab) data center deployments
Provides agility to quickly deploy computing infrastructure in days, contract for 2-3 years
Consistent designs and operational environment and consistent power expenses
Leverage optional skilled remote hands and on-site customer support
Solution to scale from a medium 300+ kW to very large compute deployments
Can execute a solution for medium to large deployment in weeks, contracting for 5-10+ years
Customize data center environment to specific deployment needs
Due to size of deployments, customers sometimes opt to have their own on-site staff
SCALE
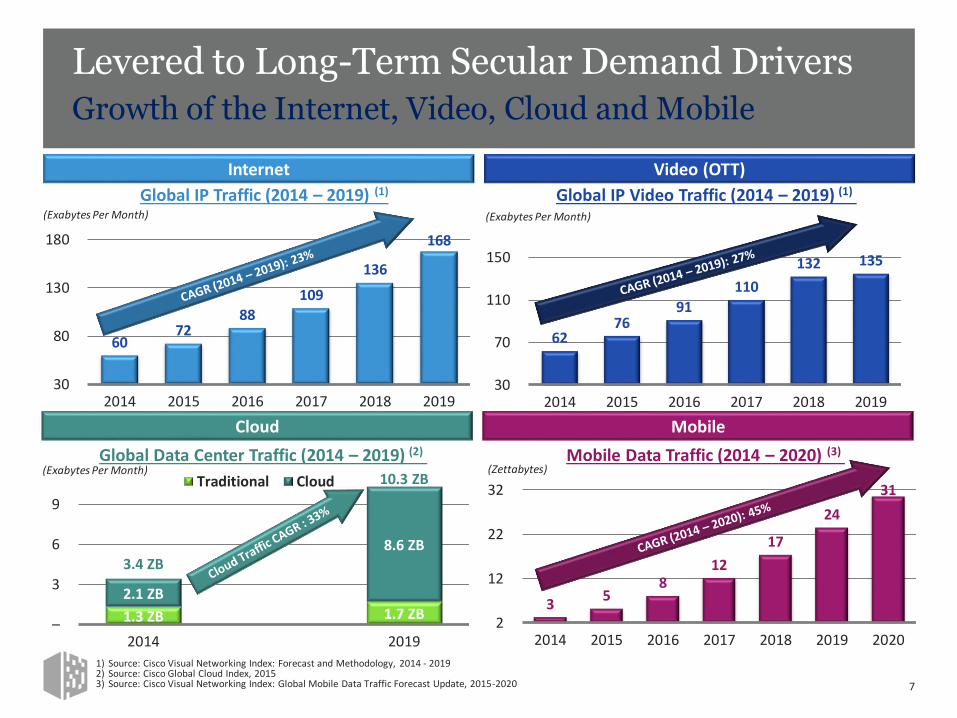
3 5
8 12
17
24
31
2
12
22
32
2014 2015 2016 2017 2018 2019 2020
1.3 ZB 1.7 ZB
2.1 ZB
8.6 ZB 3.4 ZB
10.3 ZB
–
3
6
9
2014 2019
Traditional Cloud
Levered to Long-Term Secular Demand DriversGrowth of the Internet, Video, Cloud and Mobile
7
Internet Video (OTT)
Cloud Mobile
(Exabytes Per Month)
(Exabytes Per Month) (Zettabytes)
(Exabytes Per Month)
62 76
91
110
132 135
30
70
110
150
2014 2015 2016 2017 2018 2019
60 72
88 109
136
168
30
80
130
180
2014 2015 2016 2017 2018 2019
Mobile Data Traffic (2014 – 2020) (3)Global Data Center Traffic (2014 – 2019) (2)
Global IP Video Traffic (2014 – 2019) (1)Global IP Traffic (2014 – 2019) (1)
1) Source: Cisco Visual Networking Index: Forecast and Methodology, 2014 - 20192) Source: Cisco Global Cloud Index, 20153) Source: Cisco Visual Networking Index: Global Mobile Data Traffic Forecast Update, 2015-2020

Digital RealtyStrategy &
Overview
8
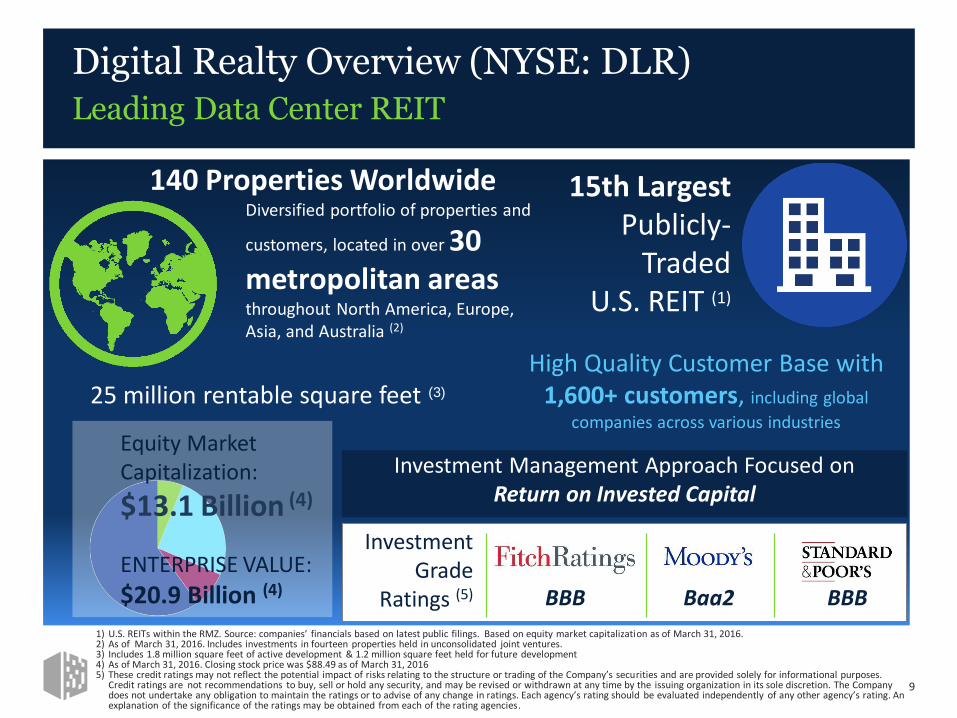
Digital Realty Overview (NYSE: DLR)Leading Data Center REIT
9
15th Largest Publicly-
TradedU.S. REIT (1)
Investment Management Approach Focused on Return on Invested Capital
High Quality Customer Base with 1,600+ customers, including global
companies across various industries
25 million rentable square feet (3)
Equity Market Capitalization:
$13.1 Billion (4)
ENTERPRISE VALUE:
$20.9 Billion (4) BBB Baa2 BBB
InvestmentGrade
Ratings (5)
140 Properties WorldwideDiversified portfolio of properties and
customers, located in over 30 metropolitan areas throughout North America, Europe, Asia, and Australia (2)
1) U.S. REITs within the RMZ. Source: companies’ financials based on latest public filings. Based on equity market capitalization as of March 31, 2016. 2) As of March 31, 2016. Includes investments in fourteen properties held in unconsolidated joint ventures.3) Includes 1.8 million square feet of active development & 1.2 million square feet held for future development4) As of March 31, 2016. Closing stock price was $88.49 as of March 31, 20165) These credit ratings may not reflect the potential impact of risks relating to the structure or trading of the Company’s securities and are provided solely for informational purposes.
Credit ratings are not recommendations to buy, sell or hold any security, and may be revised or withdrawn at any time by the issuing organization in its sole discretion. The Company does not undertake any obligation to maintain the ratings or to advise of any change in ratings. Each agency’s rating should be evaluated independently of any other agency’s rating. An explanation of the significance of the ratings may be obtained from each of the rating agencies.
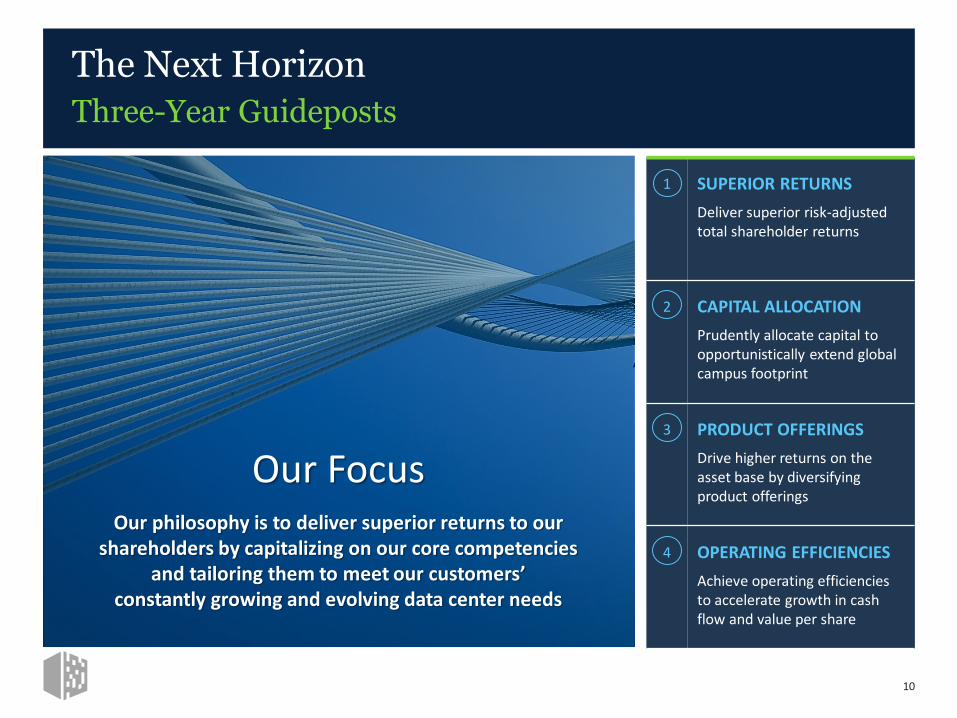
1 SUPERIOR RETURNS
Deliver superior risk-adjusted total shareholder returns
2 CAPITAL ALLOCATION
Prudently allocate capital to opportunistically extend global campus footprint
3 PRODUCT OFFERINGS
Drive higher returns on the asset base by diversifying product offerings
4 OPERATING EFFICIENCIES
Achieve operating efficiencies to accelerate growth in cash flow and value per share
Our FocusOur philosophy is to deliver superior returns to our
shareholders by capitalizing on our core competencies and tailoring them to meet our customers’
constantly growing and evolving data center needs
The Next HorizonThree-Year Guideposts
10

Who Are Our Target Customers?Addressing Growing Global Data Center Requirements
SMACC + NETWORK(Social, Mobile, Analytics, Cloud & Content)
FINANCIAL SERVICES& OTHER LARGE USERS IT SERVICES
11
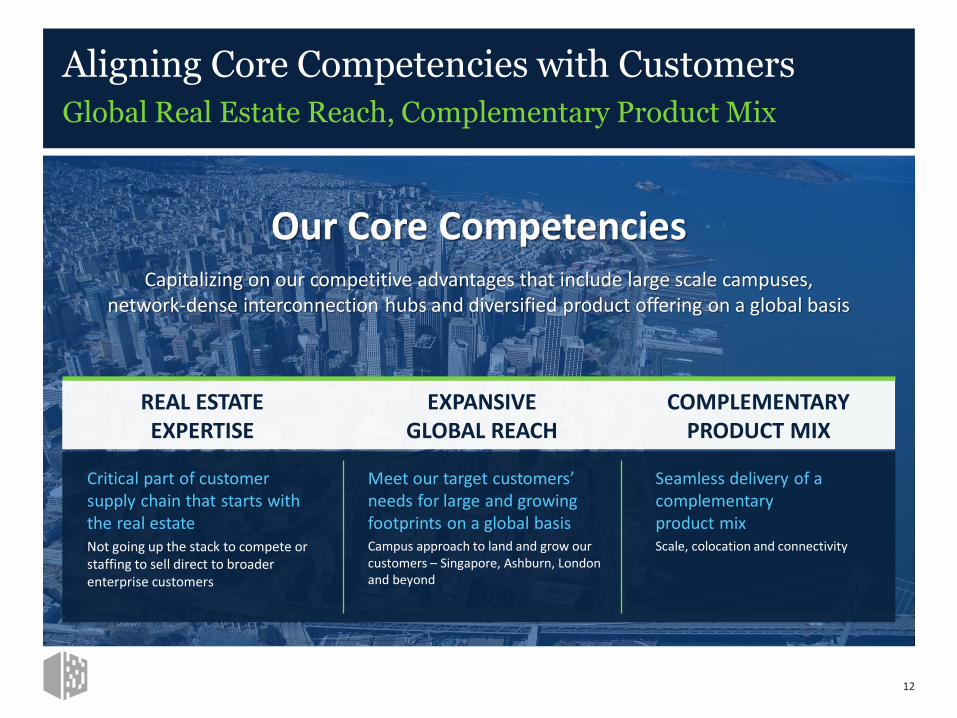
Our Core CompetenciesCapitalizing on our competitive advantages that include large scale campuses,
network-dense interconnection hubs and diversified product offering on a global basis
REAL ESTATEEXPERTISE
COMPLEMENTARYPRODUCT MIX
EXPANSIVE GLOBAL REACH
Critical part of customer supply chain that starts with the real estateNot going up the stack to compete or staffing to sell direct to broader enterprise customers
Meet our target customers’ needs for large and growing footprints on a global basisCampus approach to land and grow our customers – Singapore, Ashburn, London and beyond
Seamless delivery of a complementary product mixScale, colocation and connectivity
Aligning Core Competencies with Customers Global Real Estate Reach, Complementary Product Mix
12
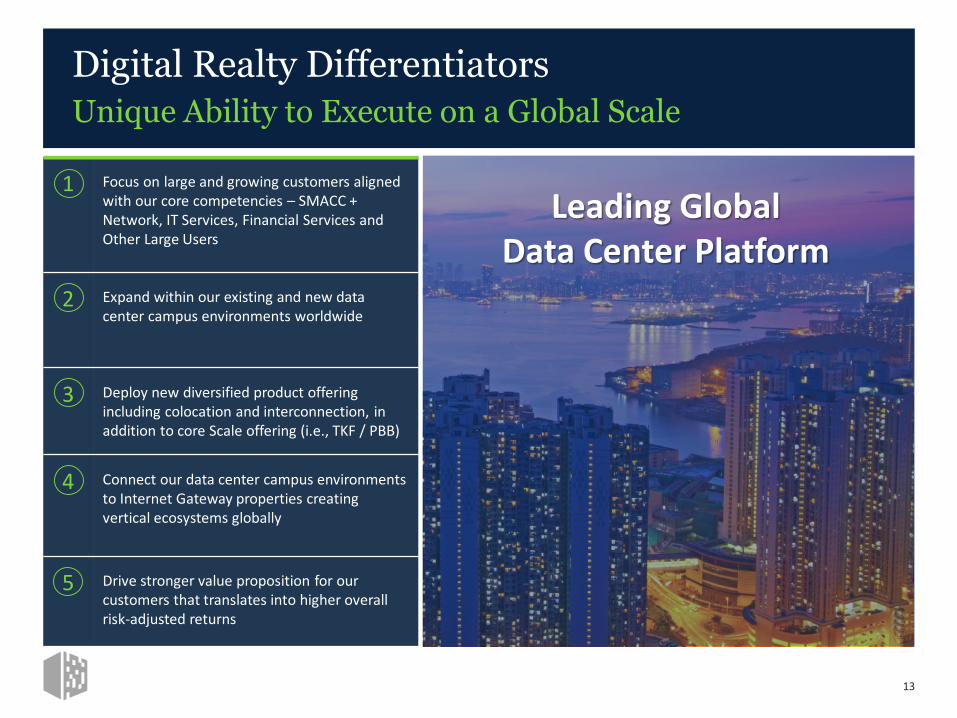
Digital Realty DifferentiatorsUnique Ability to Execute on a Global Scale
Leading Global Data Center Platform
1 Focus on large and growing customers aligned with our core competencies – SMACC + Network, IT Services, Financial Services and Other Large Users
2 Expand within our existing and new data center campus environments worldwide
3 Deploy new diversified product offering including colocation and interconnection, in addition to core Scale offering (i.e., TKF / PBB)
4 Connect our data center campus environments to Internet Gateway properties creating vertical ecosystems globally
5 Drive stronger value proposition for our customers that translates into higher overall risk-adjusted returns
13

• Andy leverages his extensive capital markets expertise and relationships in the financial community to support our longer-term growth while prudently managing our balance sheet
• Andy is responsible for the company’s financial functions, including capital markets, tax, investor relations, and financial planning and analysis
Senior Leadership Team EstablishedDeepening Our Bench, Strengthening Our Culture
ANDREW POWER CHIEF FINANCIAL OFFICER
• Jarrett is responsible for ensuring alignment between corporate strategy and operations while enhancing our ability to deliver the most efficient and effective solutions to our customers
• Jarrett is responsible for property and technical operations, design & construction as well as product development
JARRETT APPLEBY CHIEF OPERATING OFFICER
• Michael facilitates the use of information and technology to unlock more value for Digital Realty’s employees, customers and shareholders
• Michael is responsible for all aspects of the company's IT infrastructure, including business intelligence, internal business applications, and information security
MICHAEL HENRY CHIEF INFORMATION OFFICER
• Bill has served as Digital Realty’s Chief Executive Officer since November 2014 and as Chief Financial Officer from July 2004 until April 2015
• Prior to Digital Realty, Bill was with GI Partners, Digital Realty’s predecessor private equity fund
• Bill previously served as CFO of TriNet, a publicly traded triple net lease REIT
A. WILLIAM STEIN CHIEF EXECUTIVE OFFICER
• Scott is responsible for overseeing the company’s capital allocation decision-making process
• Scott is a co-founder of the company and previously served as the company’s Chief Acquisitions Officer
• Prior to Digital Realty, Scott was a Managing Director of GI Partners
SCOTT PETERSON CHIEF INVESTMENT OFFICER
• Matt joined Digital Realty in January 2013 and is responsible for overseeing the company’s sales and leasing efforts as well as marketing activities globally
• Matt was previously responsible for Global Public Sector sales at Salesforce.com and Worldwide Government Sales at Microsoft. Matt was formerly CIO for the State of Wisconsin and partner in a law firm
MATT MISZEWSKI SVP, SALES & MARKETING
14
Global
Platform
15
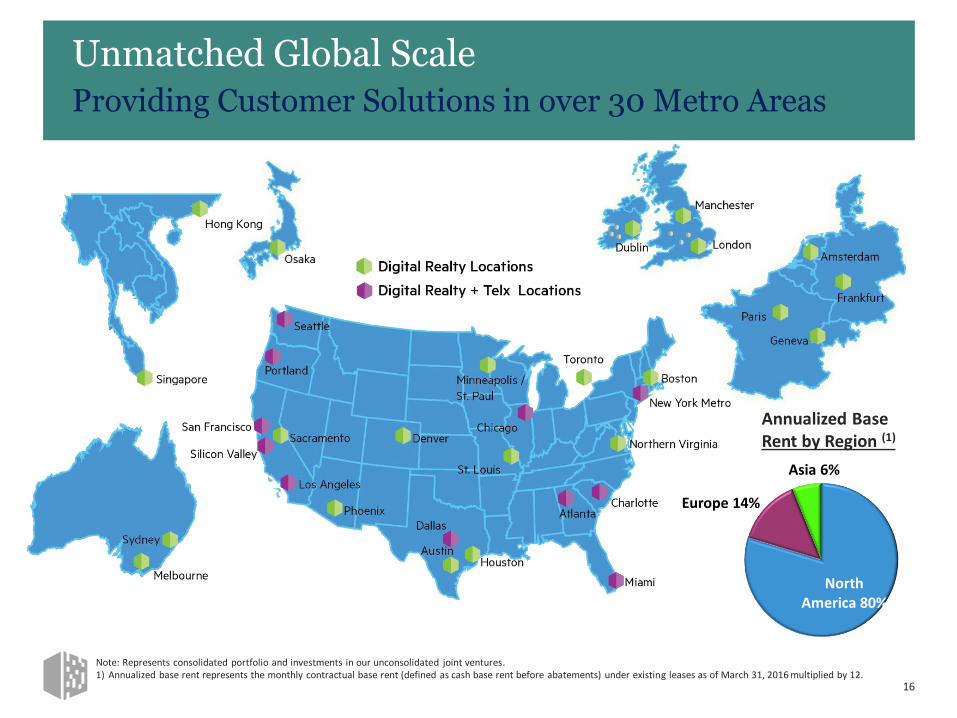
Unmatched Global ScaleProviding Customer Solutions in over 30 Metro Areas
16
Annualized Base Rent by Region (1)
North America 80%
Europe 14%
Asia 6%
Note: Represents consolidated portfolio and investments in our unconsolidated joint ventures.1) Annualized base rent represents the monthly contractual base rent (defined as cash base rent before abatements) under existing leases as of March 31, 2016 multiplied by 12.
Top 10 Customers
# Locations% of
Annualized Rent (1)
Weighted Avg. Lease
Term (Months)
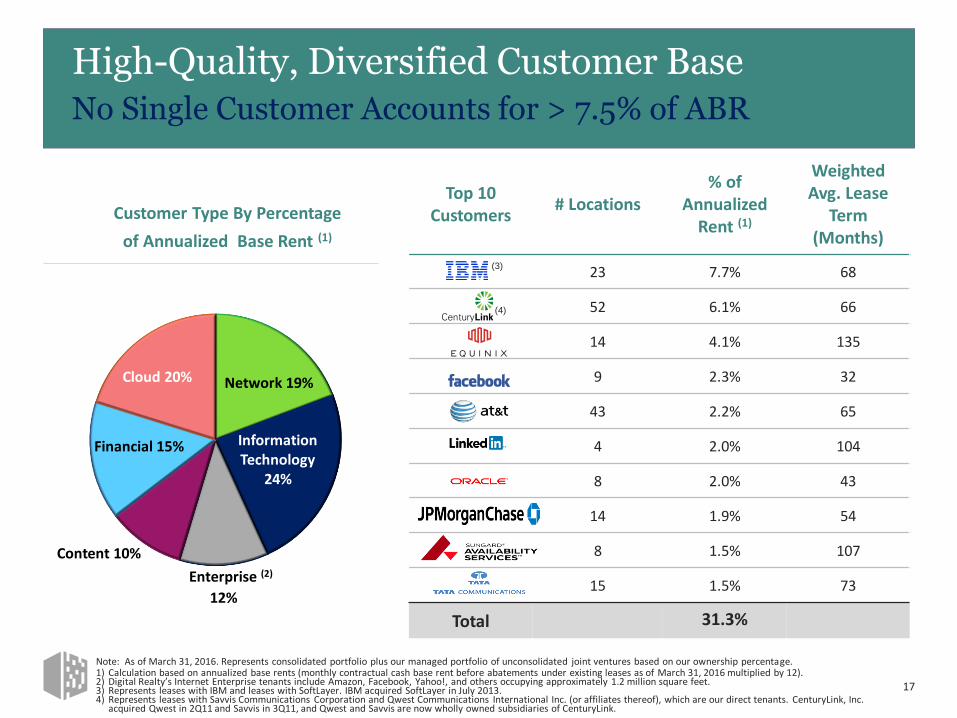
23 7.7% 68
52 6.1% 66
14 4.1% 135
9 2.3% 32
43 2.2% 65
4 2.0% 104
8 2.0% 43
14 1.9% 54
8 1.5% 107
15 1.5% 73
Total 31.3%
s
17
High-Quality, Diversified Customer BaseNo Single Customer Accounts for > 7.5% of ABR
Customer Type By Percentage
of Annualized Base Rent (1)
(3)
(4)
Note: As of March 31, 2016. Represents consolidated portfolio plus our managed portfolio of unconsolidated joint ventures based on our ownership percentage.1) Calculation based on annualized base rents (monthly contractual cash base rent before abatements under existing leases as of March 31, 2016 multiplied by 12). 2) Digital Realty’s Internet Enterprise tenants include Amazon, Facebook, Yahoo!, and others occupying approximately 1.2 million square feet.3) Represents leases with IBM and leases with SoftLayer. IBM acquired SoftLayer in July 2013. 4) Represents leases with Savvis Communications Corporation and Qwest Communications International Inc. (or affiliates thereof), which are our direct tenants. CenturyLink, Inc.
acquired Qwest in 2Q11 and Savvis in 3Q11, and Qwest and Savvis are now wholly owned subsidiaries of CenturyLink.
Network 19%
Information Technology
24%
Enterprise 12%
Content 10%
Financial 15%
Cloud 20%
Enterprise (2)
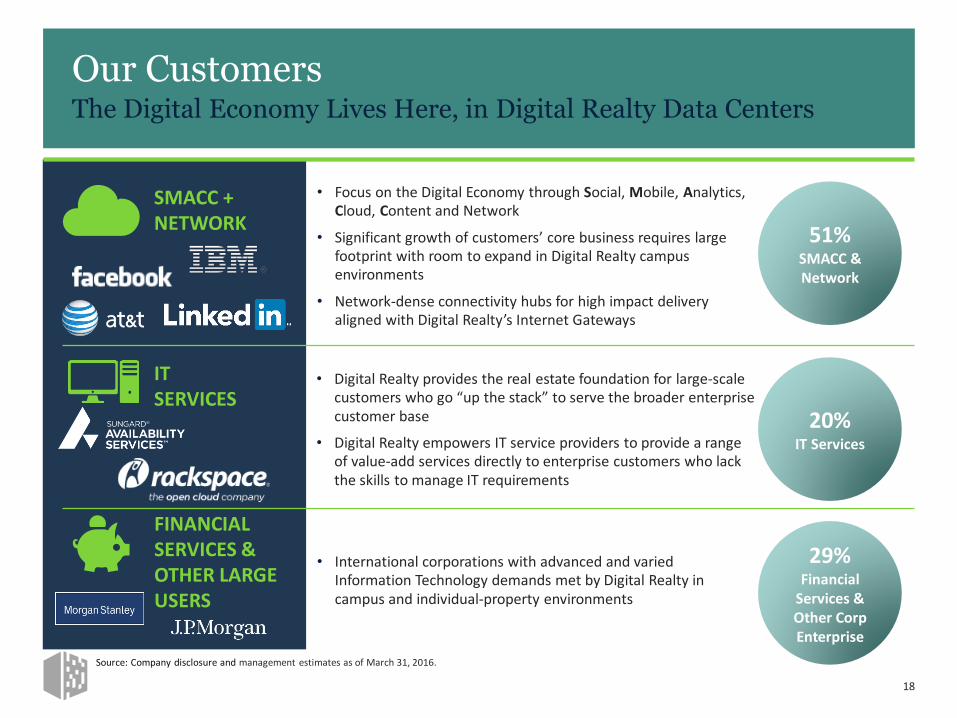
Our CustomersThe Digital Economy Lives Here, in Digital Realty Data Centers
SMACC + NETWORK
FINANCIALSERVICES & OTHER LARGE USERS
IT SERVICES
• Focus on the Digital Economy through Social, Mobile, Analytics, Cloud, Content and Network
• Significant growth of customers’ core business requires large footprint with room to expand in Digital Realty campus environments
• Network-dense connectivity hubs for high impact delivery aligned with Digital Realty’s Internet Gateways
51%SMACC & Network
20%IT Services
29%Financial
Services & Other Corp Enterprise
• Digital Realty provides the real estate foundation for large-scale customers who go “up the stack” to serve the broader enterprise customer base
• Digital Realty empowers IT service providers to provide a range of value-add services directly to enterprise customers who lack the skills to manage IT requirements
• International corporations with advanced and varied Information Technology demands met by Digital Realty in campus and individual-property environments
18
Source: Company disclosure and management estimates as of March 31, 2016.
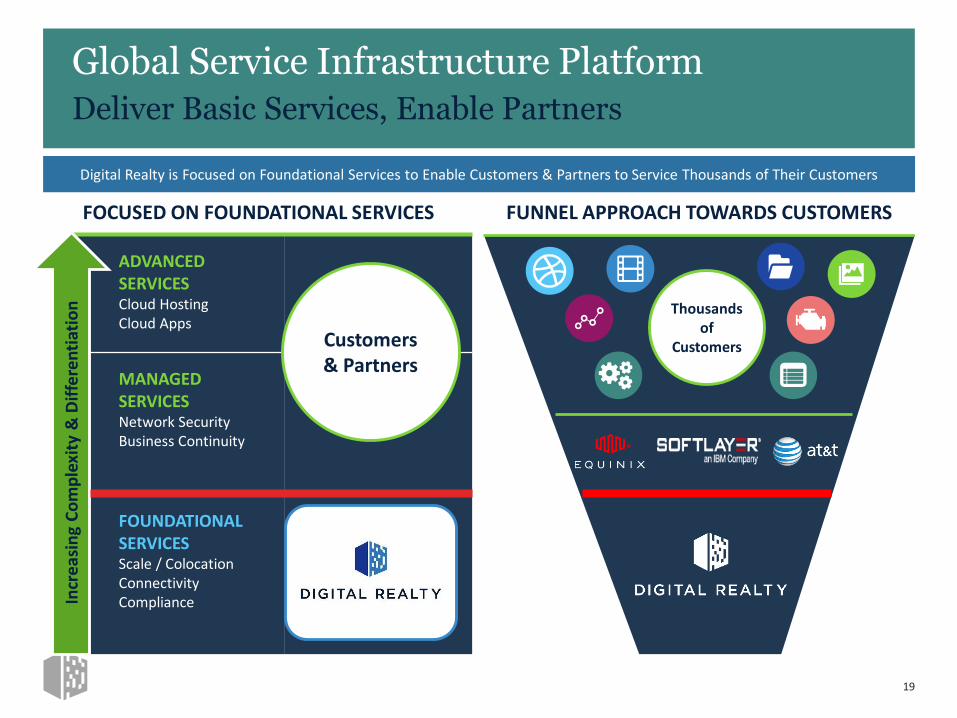
FUNNEL APPROACH TOWARDS CUSTOMERS
ADVANCEDSERVICESCloud HostingCloud Apps
MANAGEDSERVICESNetwork SecurityBusiness Continuity
FOUNDATIONAL SERVICESScale / ColocationConnectivityCompliance
Global Service Infrastructure PlatformDeliver Basic Services, Enable Partners
19
Digital Realty is Focused on Foundational Services to Enable Customers & Partners to Service Thousands of Their Customers
Customers & Partners
Thousands of
Customers
FOCUSED ON FOUNDATIONAL SERVICES
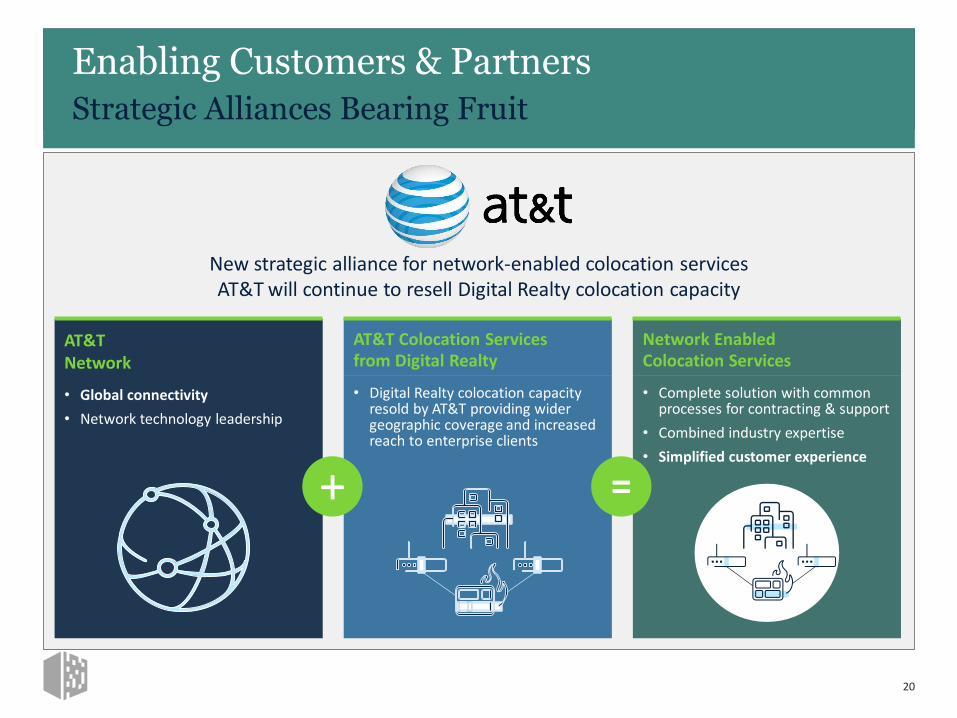
Network Enabled Colocation Services
• Complete solution with common processes for contracting & support
• Combined industry expertise
• Simplified customer experience
AT&T Colocation Services from Digital Realty
• Digital Realty colocation capacity resold by AT&T providing wider geographic coverage and increased reach to enterprise clients
AT&T
What is a Good Prospect
Enabling Customers & PartnersStrategic Alliances Bearing Fruit
20
AT&T Network
• Global connectivity
• Network technology leadership
+ =
New strategic alliance for network-enabled colocation services AT&T will continue to resell Digital Realty colocation capacity

Connected
Campus
Strategy
21
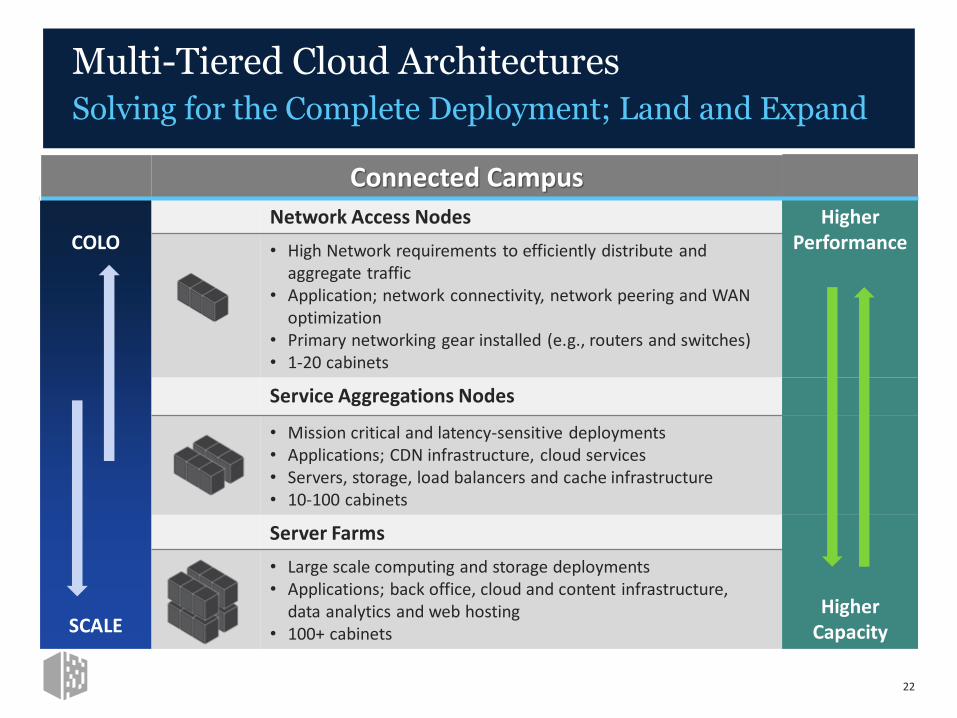
Multi-Tiered Cloud ArchitecturesSolving for the Complete Deployment; Land and Expand
22
Connected Campus
COLO
SCALE
Network Access Nodes HigherPerformance• High Network requirements to efficiently distribute and
aggregate traffic• Application; network connectivity, network peering and WAN
optimization• Primary networking gear installed (e.g., routers and switches)• 1-20 cabinets
Service Aggregations Nodes
• Mission critical and latency-sensitive deployments• Applications; CDN infrastructure, cloud services• Servers, storage, load balancers and cache infrastructure • 10-100 cabinets
Server Farms
HigherCapacity
• Large scale computing and storage deployments• Applications; back office, cloud and content infrastructure,
data analytics and web hosting• 100+ cabinets

Cloud On-Ramp Campus Ashburn
Connect@Scale suites, Powered Base Building, Connect@Campus
colocation
Proximate Campus Chicago
Connect@Scale suites, Powered Base Building,
Connect@Gateway colocation
Density at Scale and at HubsExpand, Tether, and Densify Data Center Campuses
23
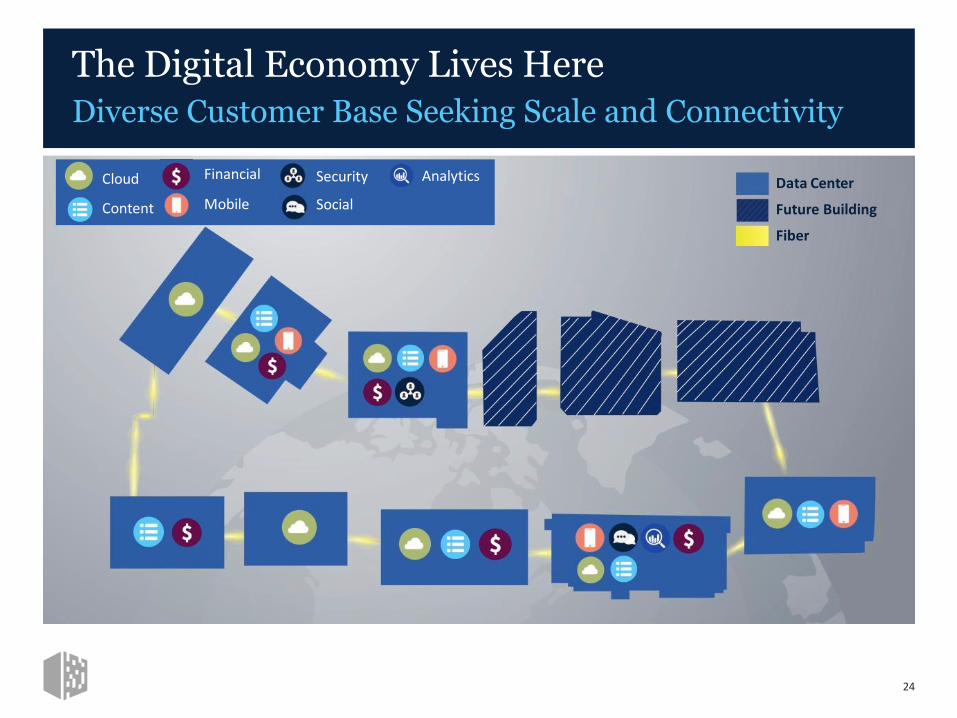
Fiber
Future Building
Data Center
The Digital Economy Lives HereDiverse Customer Base Seeking Scale and Connectivity
24
Analytics
Social
SecurityFinancial
MobileContent
Cloud

CAMPUS LOCATIONS
Ashburn New York Dallas
Singapore
Chicago
Silicon Valley London
IT & Cloud Services Network & Mobility Media & OtherFinancial Services
KEY CUSTOMER ECOSYSTEM
Global Campus Network Attractive Environments for Customers to Land and Grow
25
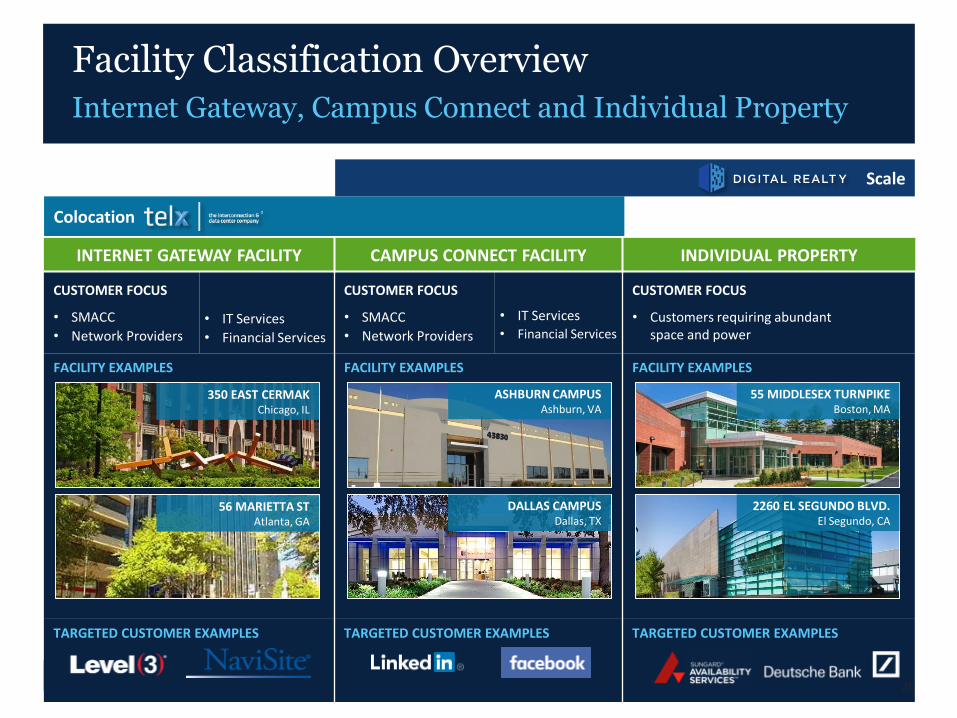
INTERNET GATEWAY FACILITY CAMPUS CONNECT FACILITY INDIVIDUAL PROPERTY
CUSTOMER FOCUS
• SMACC
• Network Providers• IT Services
• Financial Services
CUSTOMER FOCUS
• SMACC
• Network Providers
• IT Services• Financial Services
CUSTOMER FOCUS
• Customers requiring abundant space and power
FACILITY EXAMPLES FACILITY EXAMPLES FACILITY EXAMPLES
TARGETED CUSTOMER EXAMPLES TARGETED CUSTOMER EXAMPLES TARGETED CUSTOMER EXAMPLES
56 MARIETTA STAtlanta, GA
ASHBURN CAMPUSAshburn, VA
55 MIDDLESEX TURNPIKEBoston, MA
2260 EL SEGUNDO BLVD.El Segundo, CA
350 EAST CERMAKChicago, IL
DALLAS CAMPUSDallas, TX
Colocation
Scale
Facility Classification OverviewInternet Gateway, Campus Connect and Individual Property
26
Attractive
Growth
Prospects
27
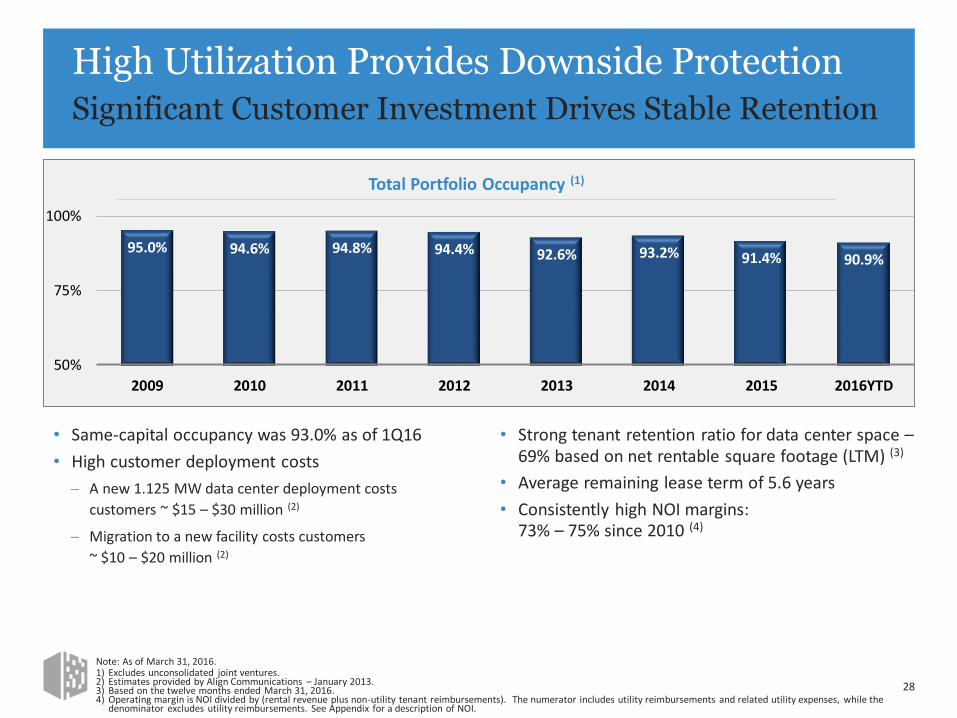
95.0% 94.6% 94.8% 94.4% 92.6% 93.2% 91.4% 90.9%
50%
75%
100%
2009 2010 2011 2012 2013 2014 2015 2016YTD
High Utilization Provides Downside ProtectionSignificant Customer Investment Drives Stable Retention
28
Total Portfolio Occupancy (1)
• Strong tenant retention ratio for data center space –69% based on net rentable square footage (LTM) (3)
• Average remaining lease term of 5.6 years
• Consistently high NOI margins: 73% – 75% since 2010 (4)
• Same-capital occupancy was 93.0% as of 1Q16
• High customer deployment costs
A new 1.125 MW data center deployment costs
customers ~ $15 – $30 million (2)
Migration to a new facility costs customers
~ $10 – $20 million (2)
Note: As of March 31, 2016.1) Excludes unconsolidated joint ventures.2) Estimates provided by Align Communications – January 2013.3) Based on the twelve months ended March 31, 2016.4) Operating margin is NOI divided by (rental revenue plus non-utility tenant reimbursements). The numerator includes utility reimbursements and related utility expenses, while the
denominator excludes utility reimbursements. See Appendix for a description of NOI.

40%
60%
80%
100%
1Q10 3Q10 1Q11 3Q11 1Q12 3Q12 1Q13 3Q13 1Q14 3Q14 1Q15 3Q15 1Q16
Data Center Non-Data Center Data Center Average Non-Data Center Average
Data Center Retention is SolidTenants are Sticky Given Their Capital Investment
Tenant Retention Based on Rentable Square Feet (1)
29
Historical Average = 55%
Historical Average = 82%
1) Represents trailing 12-month average.
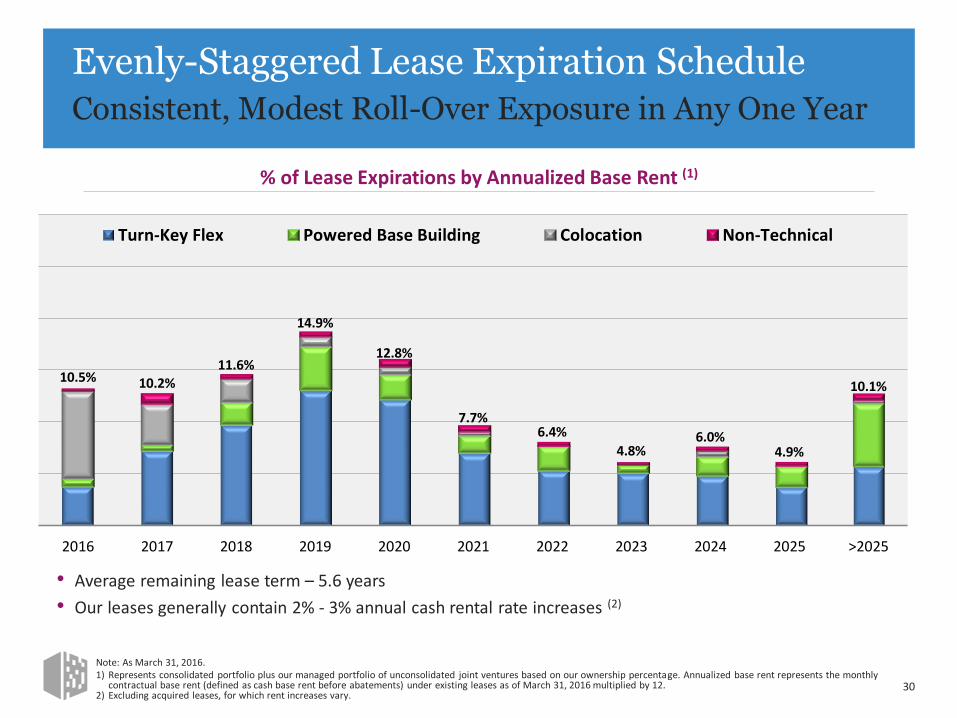
10.5% 10.2%11.6%
14.9%
12.8%
7.7%6.4%
4.8%6.0%
4.9%
10.1%
2016 2017 2018 2019 2020 2021 2022 2023 2024 2025 >2025
Turn-Key Flex Powered Base Building Colocation Non-Technical
Evenly-Staggered Lease Expiration ScheduleConsistent, Modest Roll-Over Exposure in Any One Year
30
• Average remaining lease term – 5.6 years
• Our leases generally contain 2% - 3% annual cash rental rate increases (2)
% of Lease Expirations by Annualized Base Rent (1)
Note: As March 31, 2016.1) Represents consolidated portfolio plus our managed portfolio of unconsolidated joint ventures based on our ownership percentage. Annualized base rent represents the monthly
contractual base rent (defined as cash base rent before abatements) under existing leases as of March 31, 2016 multiplied by 12. 2) Excluding acquired leases, for which rent increases vary.

Uninterrupted Growth throughout the CycleCounter-Cyclical Performance Compares Favorably
31
Ten Consecutive Years of Positive Growth
AVB: 6.9%
BXP: 2.6%
EQR: 3.7%
PSA: 10.5%
DLR: 13.1% (2)
SPG: 7.1%
KIM: (3.4)%
2006 – 2016E FFO / Share CAGR (1)
Financial Crisis
Sources: SNL Financial and FactSet. 1) 10-year FFO per Share CAGR calculated using 2006 actuals and 2016E consensus estimates. Index value starts at 100 and increases or decreases by annual percent FFO per share
growth.2) Core FFO results are show for 2012 to 2016E. Prior years reflect reported FFO results. For reported FFO results for 2006 to 2015 please see the Appendix.
0
100
200
300
400
2006 2007 2008 2009 2010 2011 2012 2013 2014 2015 2016E
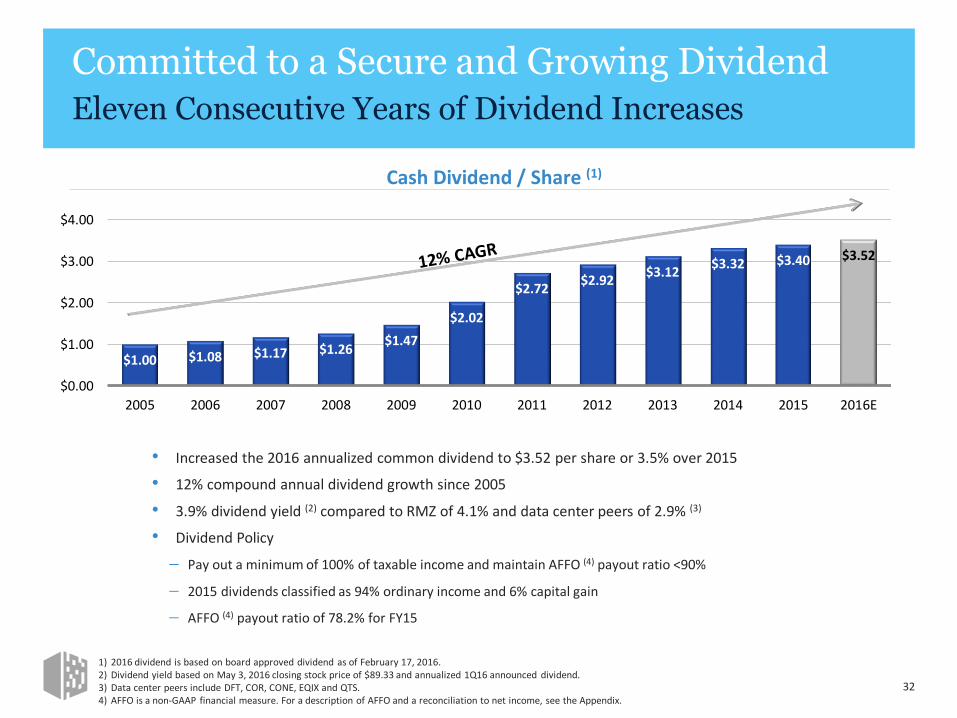
Committed to a Secure and Growing DividendEleven Consecutive Years of Dividend Increases
1) 2016 dividend is based on board approved dividend as of February 17, 2016.2) Dividend yield based on May 3, 2016 closing stock price of $89.33 and annualized 1Q16 announced dividend.3) Data center peers include DFT, COR, CONE, EQIX and QTS. 4) AFFO is a non-GAAP financial measure. For a description of AFFO and a reconciliation to net income, see the Appendix.
Cash Dividend / Share (1)
$1.00 $1.08 $1.17 $1.26$1.47
$2.02
$2.72$2.92
$3.12$3.32 $3.40 $3.52
$0.00
$1.00
$2.00
$3.00
$4.00
2005 2006 2007 2008 2009 2010 2011 2012 2013 2014 2015 2016E
• Increased the 2016 annualized common dividend to $3.52 per share or 3.5% over 2015
• 12% compound annual dividend growth since 2005
• 3.9% dividend yield (2) compared to RMZ of 4.1% and data center peers of 2.9% (3)
• Dividend Policy
Pay out a minimum of 100% of taxable income and maintain AFFO (4) payout ratio <90%
2015 dividends classified as 94% ordinary income and 6% capital gain
AFFO (4) payout ratio of 78.2% for FY15
32
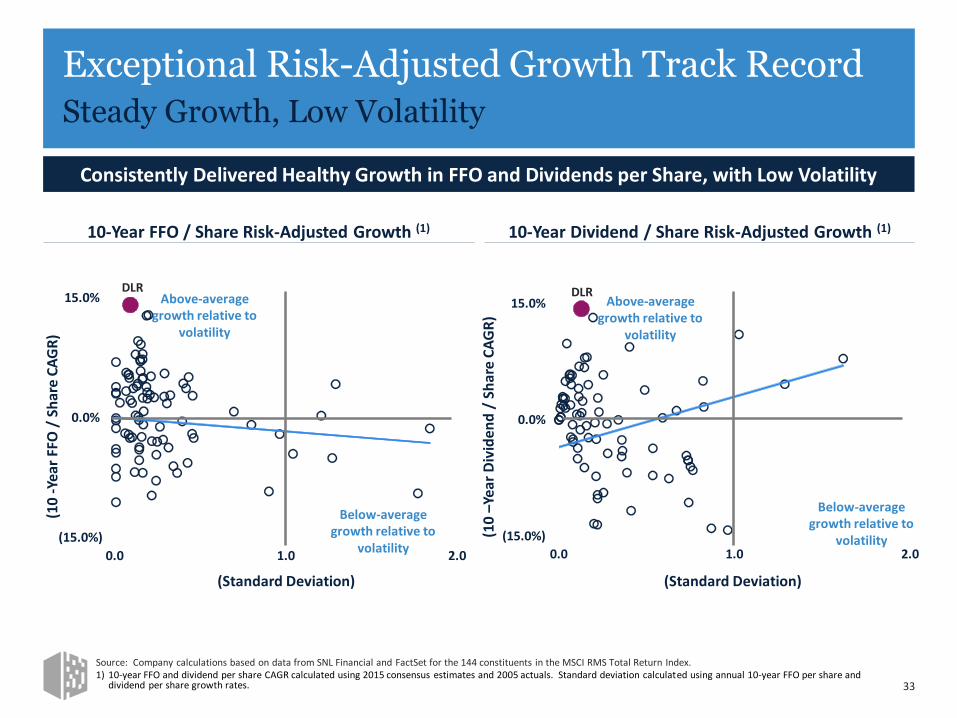
Exceptional Risk-Adjusted Growth Track RecordSteady Growth, Low Volatility
33
(15.0%)
0.0%
15.0%
0.0 1.0 2.0(15.0%)
0.0%
15.0%
0.0 1.0 2.0
(Standard Deviation)
(10
-Yea
r FF
O /
Sh
are
CA
GR
)
(10
–Yea
r D
ivid
end
/ S
har
e C
AG
R)
10-Year Dividend / Share Risk-Adjusted Growth (1)10-Year FFO / Share Risk-Adjusted Growth (1)
Consistently Delivered Healthy Growth in FFO and Dividends per Share, with Low Volatility
(Standard Deviation)
DLR DLRAbove-average growth relative to
volatility
Above-average growth relative to
volatility
Below-average growth relative to
volatility
Below-average growth relative to
volatility
Source: Company calculations based on data from SNL Financial and FactSet for the 144 constituents in the MSCI RMS Total Return Index.1) 10-year FFO and dividend per share CAGR calculated using 2015 consensus estimates and 2005 actuals. Standard deviation calculated using annual 10-year FFO per share and
dividend per share growth rates.

Graham’s Golden RulesDefensive Requirements for the Intelligent Investor (1)
Adequate Size of the Enterprise $20.9 BnENTERPRISE VALUE (2)
Sufficiently Strong Financial Condition BBB / Baa2 / BBBINVESTMENT GRADE BALANCE SHEET
Earnings StabilityGROWTH
IN CORE FFO / SH EACH AND EVERY YEAR
Dividend RecordUNINTERRUPTED GROWTH IN DIVIDENDS PER SHARE
Earnings Growth 14% CAGRIN CORE FFO PER SHARE SINCE 2005
Moderate Price / Earnings Ratio < 17x PRICE / 2016E FFO (2)
Moderate Price to Assets Ratio < 13% PREMIUM TO CONSENSUS NAV (2)
12%CAGR
34
1
2
3
4
5
6
7
05 06 07 08 09 10 11 12 13 14 15
GFC
+
1) Graham, B. (1949). The Intelligent Investor. New York, NY: Harper & Brothers.2) As of March 31, 2016. Closing stock price was $88.49 as of March 31, 2016. For 2016E FFO and a description Net Asset Value (NAV), please see our 1Q16 Earnings Press Release and Supplemental
Information, which was filed with the SEC on April 28, 2016.
PrudentCapital
Allocation
35
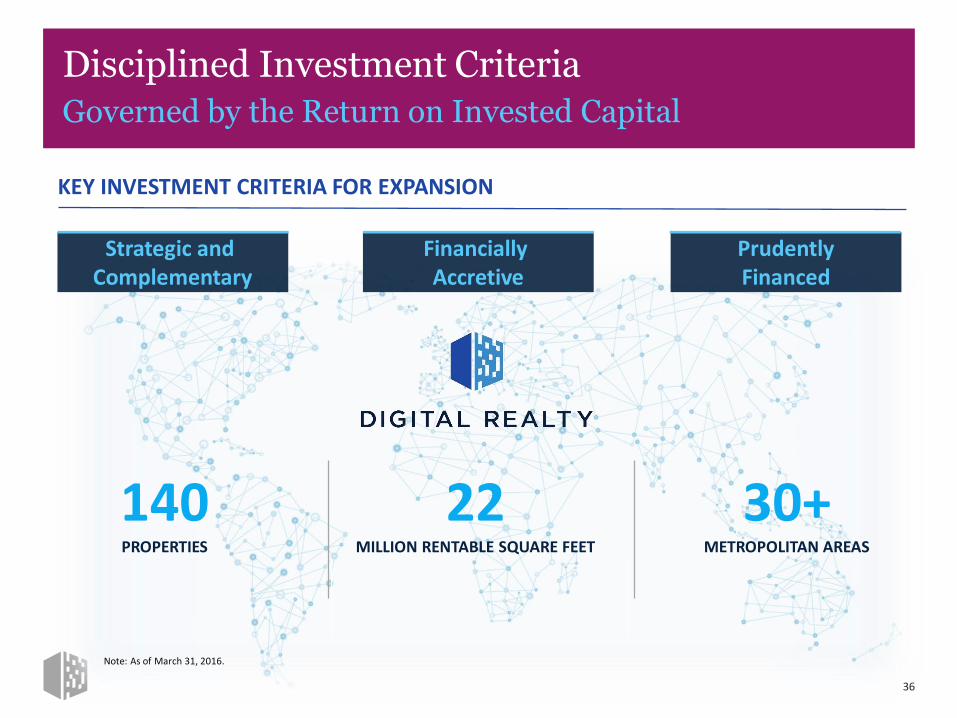
KEY INVESTMENT CRITERIA FOR EXPANSION
Disciplined Investment CriteriaGoverned by the Return on Invested Capital
36
Strategic and Complementary
140PROPERTIES
PrudentlyFinanced
30+METROPOLITAN AREAS
Financially Accretive
22MILLION RENTABLE SQUARE FEET
Note: As of March 31, 2016.
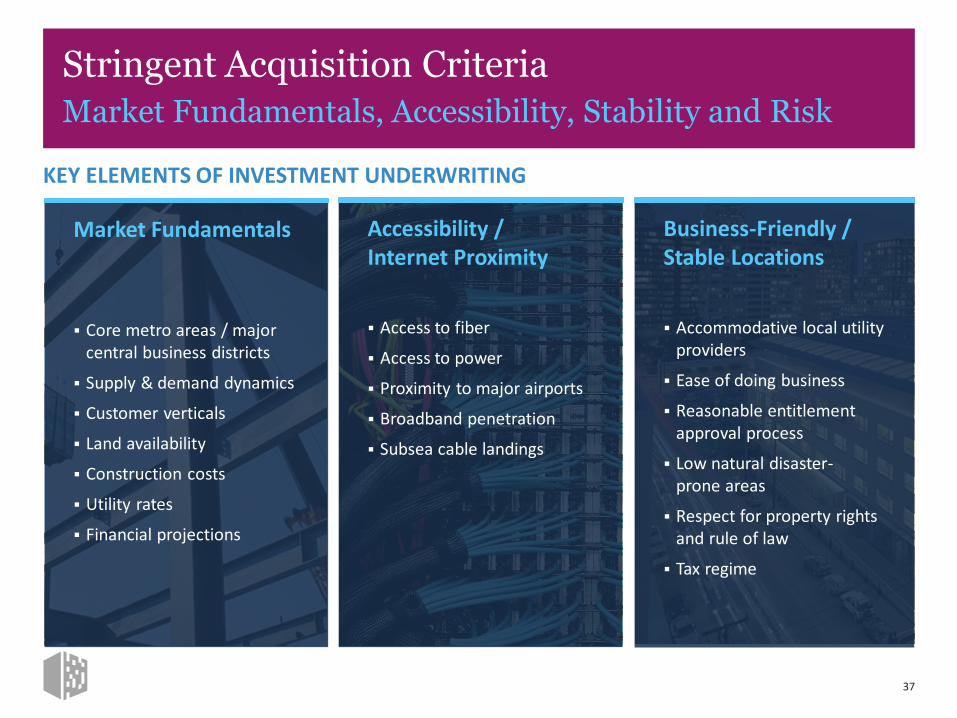
KEY ELEMENTS OF INVESTMENT UNDERWRITING
Stringent Acquisition CriteriaMarket Fundamentals, Accessibility, Stability and Risk
37
Market Fundamentals
Core metro areas / major central business districts
Supply & demand dynamics
Customer verticals
Land availability
Construction costs
Utility rates
Financial projections
Accessibility / Internet Proximity
Access to fiber
Access to power
Proximity to major airports
Broadband penetration
Subsea cable landings
Business-Friendly / Stable Locations
Accommodative local utility providers
Ease of doing business
Reasonable entitlement approval process
Low natural disaster-prone areas
Respect for property rights and rule of law
Tax regime
ConservativeFinancial
Strategy
38
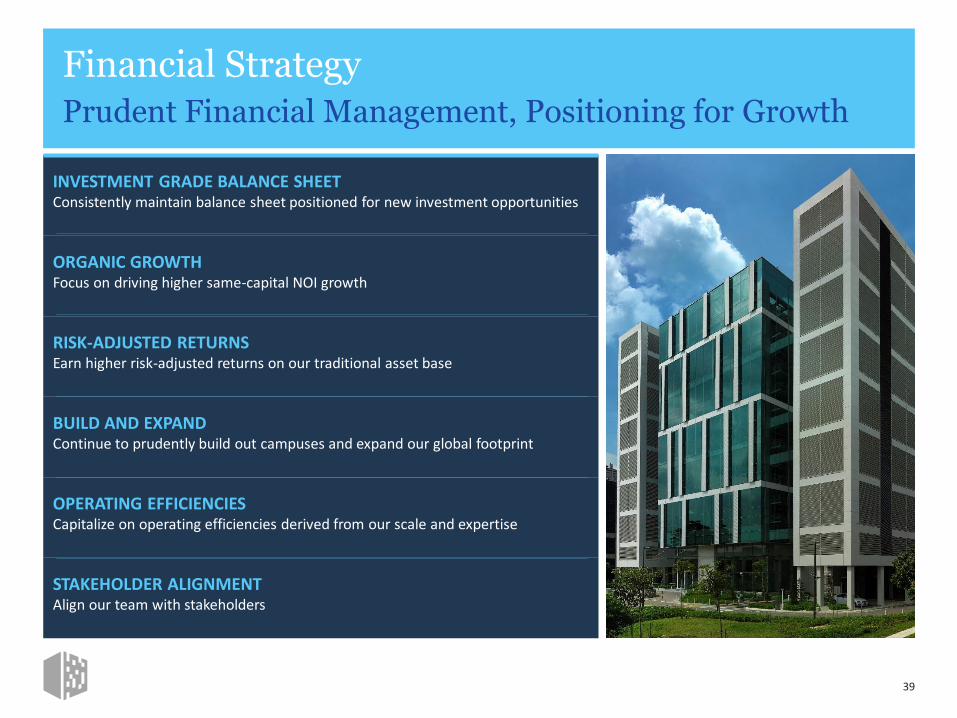
INVESTMENT GRADE BALANCE SHEETConsistently maintain balance sheet positioned for new investment opportunities
ORGANIC GROWTHFocus on driving higher same-capital NOI growth
RISK-ADJUSTED RETURNSEarn higher risk-adjusted returns on our traditional asset base
BUILD AND EXPANDContinue to prudently build out campuses and expand our global footprint
OPERATING EFFICIENCIESCapitalize on operating efficiencies derived from our scale and expertise
STAKEHOLDER ALIGNMENTAlign our team with stakeholders
Financial StrategyPrudent Financial Management, Positioning for Growth
39
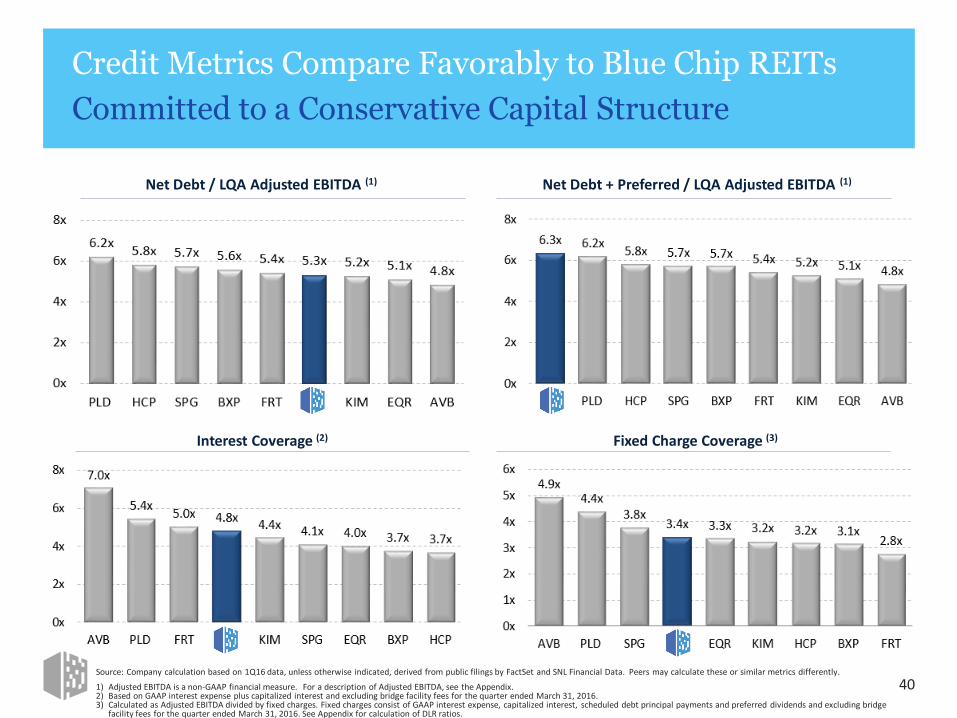
Credit Metrics Compare Favorably to Blue Chip REITs
Committed to a Conservative Capital Structure
Interest Coverage (2)
Net Debt + Preferred / LQA Adjusted EBITDA (1)Net Debt / LQA Adjusted EBITDA (1)
Fixed Charge Coverage (3)
40Source: Company calculation based on 1Q16 data, unless otherwise indicated, derived from public filings by FactSet and SNL Financial Data. Peers may calculate these or similar metrics differently.
1) Adjusted EBITDA is a non-GAAP financial measure. For a description of Adjusted EBITDA, see the Appendix.2) Based on GAAP interest expense plus capitalized interest and excluding bridge facility fees for the quarter ended March 31, 2016.3) Calculated as Adjusted EBITDA divided by fixed charges. Fixed charges consist of GAAP interest expense, capitalized interest, scheduled debt principal payments and preferred dividends and excluding bridge
facility fees for the quarter ended March 31, 2016. See Appendix for calculation of DLR ratios.
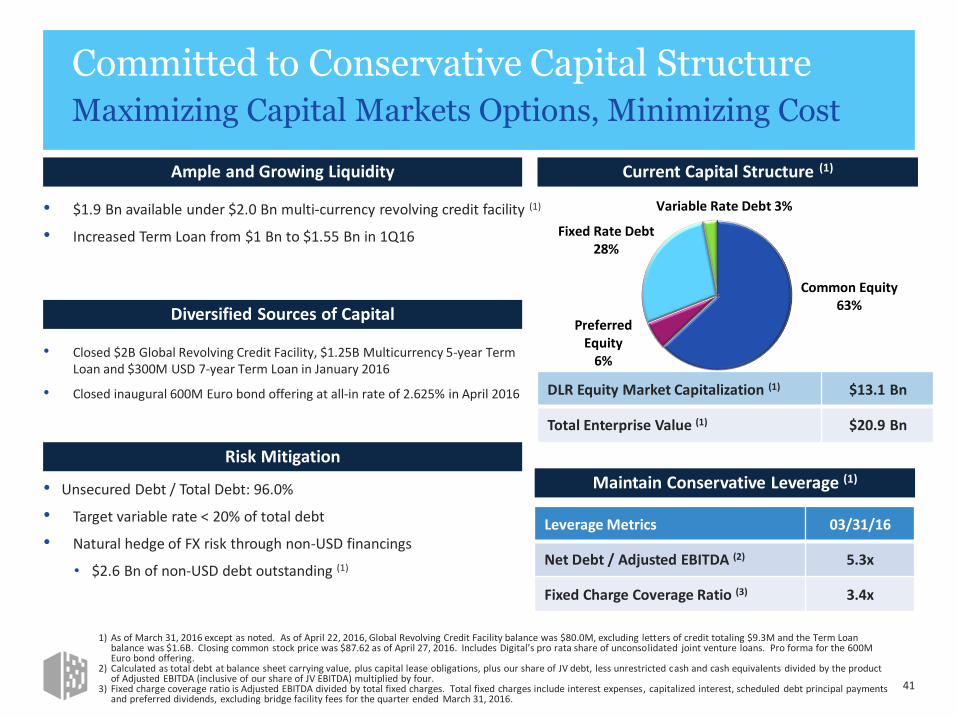
Committed to Conservative Capital StructureMaximizing Capital Markets Options, Minimizing Cost
Leverage Metrics 03/31/16
Net Debt / Adjusted EBITDA (2) 5.3x
Fixed Charge Coverage Ratio (3) 3.4x
Maintain Conservative Leverage (1)
41
• $1.9 Bn available under $2.0 Bn multi-currency revolving credit facility (1)
• Increased Term Loan from $1 Bn to $1.55 Bn in 1Q16
Diversified Sources of Capital
Ample and Growing Liquidity
• Closed $2B Global Revolving Credit Facility, $1.25B Multicurrency 5-year Term Loan and $300M USD 7-year Term Loan in January 2016
• Closed inaugural 600M Euro bond offering at all-in rate of 2.625% in April 2016
Risk Mitigation
• Unsecured Debt / Total Debt: 96.0%
• Target variable rate < 20% of total debt
• Natural hedge of FX risk through non-USD financings
• $2.6 Bn of non-USD debt outstanding (1)
DLR Equity Market Capitalization (1) $13.1 Bn
Total Enterprise Value (1) $20.9 Bn
Current Capital Structure (1)
Common Equity63%
Preferred Equity
6%
Fixed Rate Debt28%
Variable Rate Debt 3%
1) As of March 31, 2016 except as noted. As of April 22, 2016, Global Revolving Credit Facility balance was $80.0M, excluding letters of credit totaling $9.3M and the Term Loan balance was $1.6B. Closing common stock price was $87.62 as of April 27, 2016. Includes Digital’s pro rata share of unconsolidated joint venture loans. Pro forma for the 600M Euro bond offering.
2) Calculated as total debt at balance sheet carrying value, plus capital lease obligations, plus our share of JV debt, less unrestricted cash and cash equivalents divided by the product of Adjusted EBITDA (inclusive of our share of JV EBITDA) multiplied by four.
3) Fixed charge coverage ratio is Adjusted EBITDA divided by total fixed charges. Total fixed charges include interest expenses, capitalized interest, scheduled debt principal payments and preferred dividends, excluding bridge facility fees for the quarter ended March 31, 2016.

$0.1
$1.0
$0.0 $0.1 $0.2
$0.0
$1.0
$1.8
$0.8 $0.7
$0.0
$1.0
$2.0
$3.0
2015 2016 2017 2018 2019 2020 2021 2022 2023 2024 2025
Secured Mortgage Debt Unsecured Prudential Shelf Facility Pro Rata Share of JV Debt
Unsecured Notes Unsecured Term Loan Unsecured Global Facility
Unsecured Green Bonds
$0.7
(1)
Extended Global Unsecured Revolving Credit Facility and Term Loan Maturities to 2021 and 2023
(3) (4)
($ in billions)
Debt Maturity Schedule Pro Forma for EurobondNo Bar Too Tall; Nominal Near-Term Maturities
42
(2)
Revolver Capacity (5)
$1.9 Bn
Debt Profile (6)
Weighted Average Debt Maturity 6.8 Yrs
Weighted Average Coupon 3.8%
% Unsecured Debt 96.0%
Note: Pro forma for the offering of 600 million Euro aggregate principal amount of Digital Euro Finco, LLC’s 2.625% Notes due 20241) Total excludes $404,000 of net loan premiums and $175,000 of deferred financing costs. Balances and exchange rates as of March 31, 2016. 2) Represents Digital Realty’s pro rata share of four unconsolidated joint venture loans. 3) Term loan balance was $1.6 billion as of April 22, 2016. 4) Global Revolving Credit Facility balance was $80.0 million as of April 22, 2016. The unrestricted cash balance was $92.4 mil lion as of April 22, 2016. 5) Reflects Global Revolving Credit Facility capacity of $2.0 billion less $80.0 million outstanding as of April 22, 2016. 6) As of April 22, 2016. Assumes extension of options.
Secured Mortgage Debt (1)
Unsecured Term Loan (3)
Pro Rata Share of JV Debt (2)
Unsecured Global Facility (4)
43
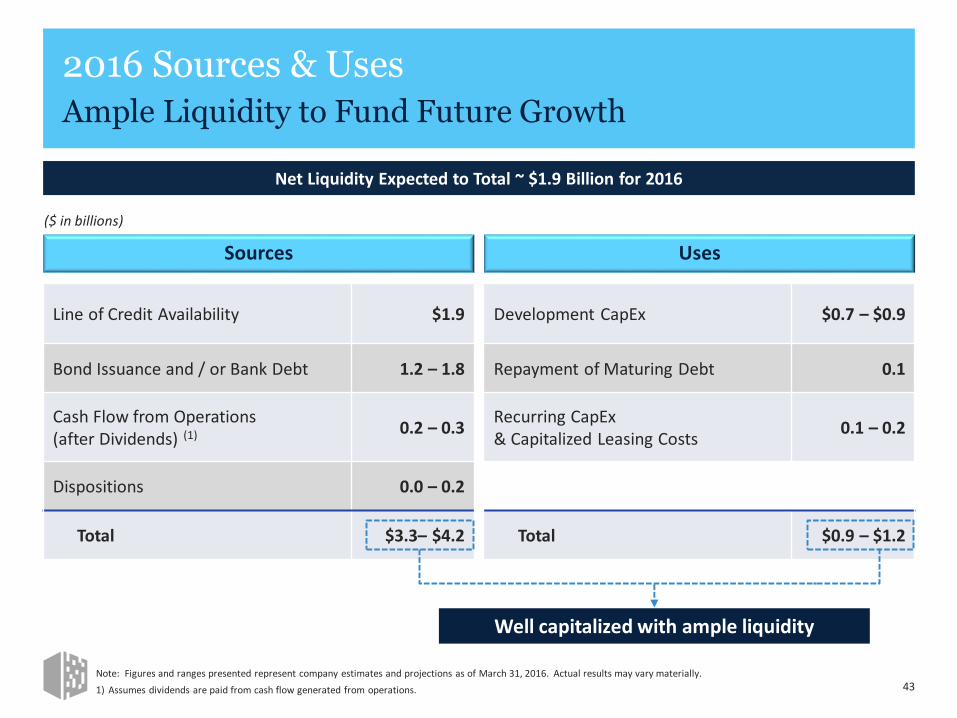
2016 Sources & UsesAmple Liquidity to Fund Future Growth
Development CapEx $0.7 – $0.9
Repayment of Maturing Debt 0.1
Recurring CapEx & Capitalized Leasing Costs
0.1 – 0.2
Total $0.9 – $1.2
(1)
Net Liquidity Expected to Total ~ $1.9 Billion for 2016
Line of Credit Availability $1.9
Bond Issuance and / or Bank Debt 1.2 – 1.8
Cash Flow from Operations(after Dividends) (1) 0.2 – 0.3
Dispositions 0.0 – 0.2
Total $3.3– $4.2
Sources Uses
Well capitalized with ample liquidity
($ in billions)
Note: Figures and ranges presented represent company estimates and projections as of March 31, 2016. Actual results may vary materially.
1) Assumes dividends are paid from cash flow generated from operations.

RecentResults
44
Note: The slides in this section were originally posted to the Company’s website on April 28, 2016 and have not been updated to reflect any changes occurring after that date.
-
20
40
60
Boston Chicago Dallas Houston N Virginia NY Metro Phoenix Silicon Valley
Current Supply New Construction Digital Realty Inventory
-
20
40
60
Boston Chicago Dallas Houston N Virginia NY Metro Phoenix Silicon Valley
Current Supply New Construction Digital Realty InventoryCurrent Supply (1)
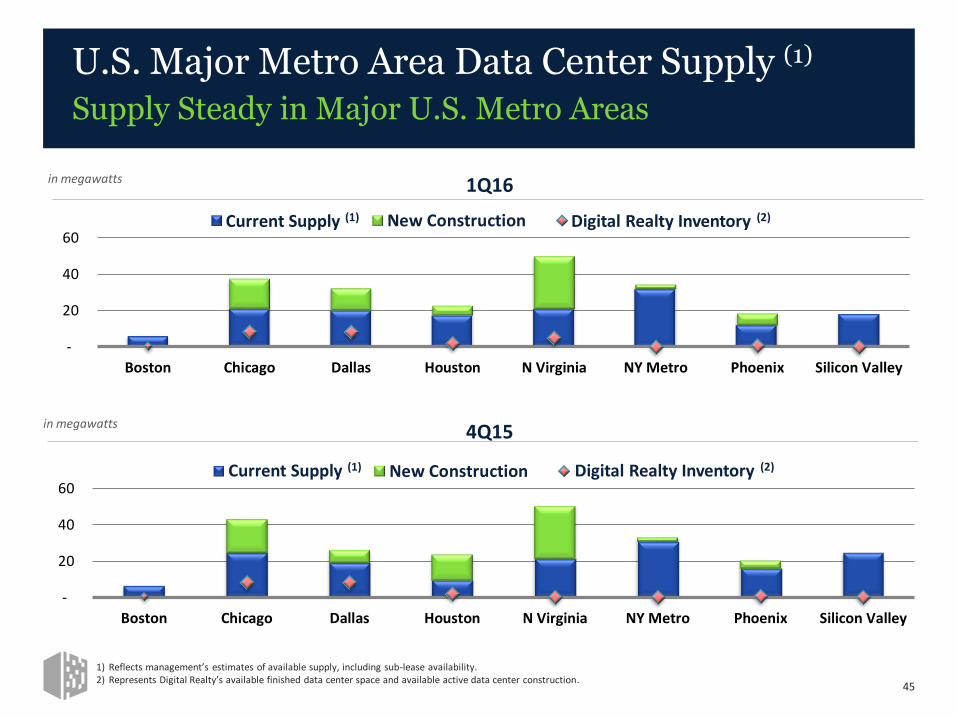
U.S. Major Metro Area Data Center Supply (1)
Supply Steady in Major U.S. Metro Areas
1) Reflects management’s estimates of available supply, including sub-lease availability. 2) Represents Digital Realty’s available finished data center space and available active data center construction.
45
in megawatts 1Q16
4Q15in megawatts
Digital Realty Inventory (2)
Current Supply (1) Digital Realty Inventory (2)
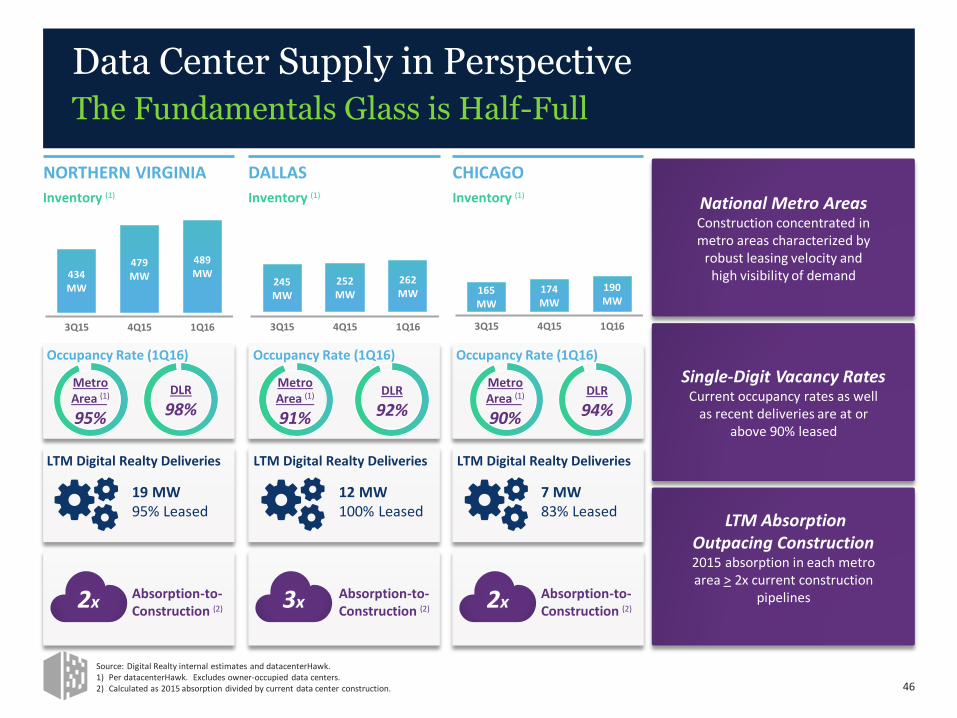
Data Center Supply in PerspectiveThe Fundamentals Glass is Half-Full
Source: Digital Realty internal estimates and datacenterHawk. 1) Per datacenterHawk. Excludes owner-occupied data centers. 2) Calculated as 2015 absorption divided by current data center construction. 46
NORTHERN VIRGINIA DALLAS
National Metro AreasConstruction concentrated in metro areas characterized by
robust leasing velocity and high visibility of demand
Single-Digit Vacancy RatesCurrent occupancy rates as well
as recent deliveries are at or above 90% leased
LTM Absorption Outpacing Construction2015 absorption in each metro area > 2x current construction
pipelines
Occupancy Rate (1Q16)
Metro Area (1)
91%
CHICAGO
Inventory (1)
DLR
92%
Occupancy Rate (1Q16)
MetroArea (1)
95%
DLR
98%
Occupancy Rate (1Q16)
MetroArea (1)
90%
DLR
94%
Inventory (1) Inventory (1)
2x 3x 2xAbsorption-to-Construction (2)
Absorption-to-Construction (2)
Absorption-to-Construction (2)
434 MW
479 MW
489 MW
3Q15 4Q15 1Q16
245 MW
252 MW
262 MW
3Q15 4Q15 1Q16
165 MW
174 MW
190 MW
3Q15 4Q15 1Q16
19 MW95% Leased
LTM Digital Realty Deliveries
12 MW100% Leased
LTM Digital Realty Deliveries
7 MW83% Leased
LTM Digital Realty Deliveries
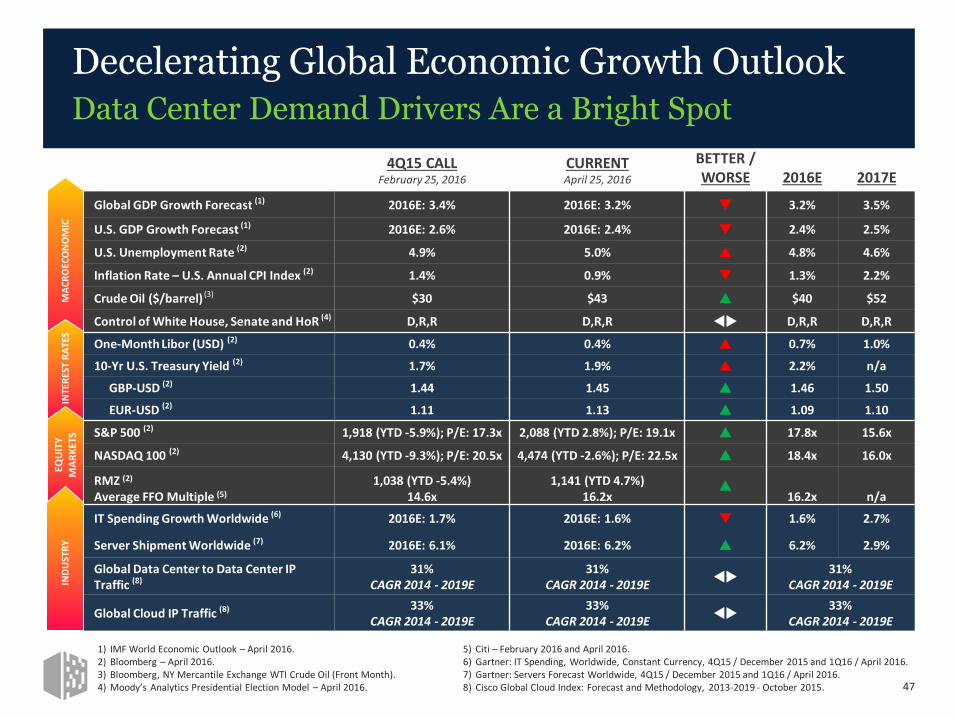
4Q15 CALLFebruary 25, 2016
CURRENTApril 25, 2016
BETTER / WORSE 2016E 2017E
Global GDP Growth Forecast (1) 2016E: 3.4% 2016E: 3.2% q 3.2% 3.5%
U.S. GDP Growth Forecast (1) 2016E: 2.6% 2016E: 2.4% q 2.4% 2.5%
U.S. Unemployment Rate (2) 4.9% 5.0% p 4.8% 4.6%
Inflation Rate – U.S. Annual CPI Index (2) 1.4% 0.9% q 1.3% 2.2%
Crude Oil ($/barrel) (3) $30 $43 p $40 $52
Control of White House, Senate and HoR (4) D,R,R D,R,R tu D,R,R D,R,R
One-Month Libor (USD) (2) 0.4% 0.4% p 0.7% 1.0%
10-Yr U.S. Treasury Yield (2) 1.7% 1.9% p 2.2% n/a
GBP-USD (2) 1.44 1.45 p 1.46 1.50
EUR-USD (2) 1.11 1.13 p 1.09 1.10
S&P 500 (2) 1,918 (YTD -5.9%); P/E: 17.3x 2,088 (YTD 2.8%); P/E: 19.1x p 17.8x 15.6x
NASDAQ 100 (2) 4,130 (YTD -9.3%); P/E: 20.5x 4,474 (YTD -2.6%); P/E: 22.5x p 18.4x 16.0x
RMZ (2)
Average FFO Multiple (5)
1,038 (YTD -5.4%)14.6x
1,141 (YTD 4.7%)16.2x
p
16.2x n/a
IT Spending Growth Worldwide (6) 2016E: 1.7% 2016E: 1.6% q 1.6% 2.7%
Server Shipment Worldwide (7) 2016E: 6.1% 2016E: 6.2% p 6.2% 2.9%
Global Data Center to Data Center IP Traffic (8)
31%CAGR 2014 - 2019E
31%CAGR 2014 - 2019E
tu31%
CAGR 2014 - 2019E
Global Cloud IP Traffic (8) 33%CAGR 2014 - 2019E
33%CAGR 2014 - 2019E
tu33%
CAGR 2014 - 2019E
Decelerating Global Economic Growth OutlookData Center Demand Drivers Are a Bright Spot
47
MA
CR
OEC
ON
OM
ICIN
TER
EST
RA
TES
EQU
ITY
M
AR
KET
SIN
DU
STR
Y
1) IMF World Economic Outlook – April 2016.2) Bloomberg – April 2016.3) Bloomberg, NY Mercantile Exchange WTI Crude Oil (Front Month).4) Moody’s Analytics Presidential Election Model – April 2016.
5) Citi – February 2016 and April 2016.6) Gartner: IT Spending, Worldwide, Constant Currency, 4Q15 / December 2015 and 1Q16 / April 2016.7) Gartner: Servers Forecast Worldwide, 4Q15 / December 2015 and 1Q16 / April 2016.8) Cisco Global Cloud Index: Forecast and Methodology, 2013-2019 - October 2015.

FinancialResults
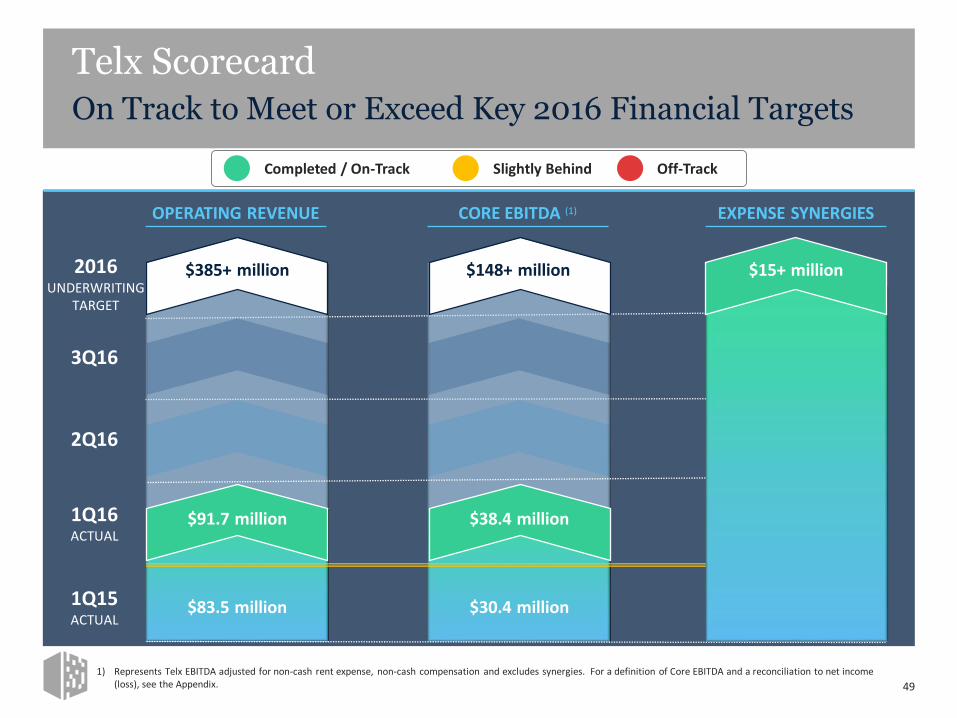
Telx ScorecardOn Track to Meet or Exceed Key 2016 Financial Targets
49
OPERATING REVENUE
2016UNDERWRITING
TARGET
CORE EBITDA (1)
1Q15ACTUAL
1) Represents Telx EBITDA adjusted for non-cash rent expense, non-cash compensation and excludes synergies. For a definition of Core EBITDA and a reconciliation to net income (loss), see the Appendix.
EXPENSE SYNERGIES
Completed / On-Track Slightly Behind Off-Track
$30.4 million
$148+ million
$83.5 million
$385+ million
1Q16ACTUAL
$91.7 million $38.4 million
2Q16
3Q16
$15+ million
$0
$20
$40
$60
1Q 2Q 3Q 4Q 1Q 2Q 3Q 4Q 1Q 2Q 3Q 4Q 1Q 2Q 3Q 4Q 1Q 2Q 3Q 4Q 1Q 2Q 3Q 4Q 1Q 2Q 3Q 4Q 1Q
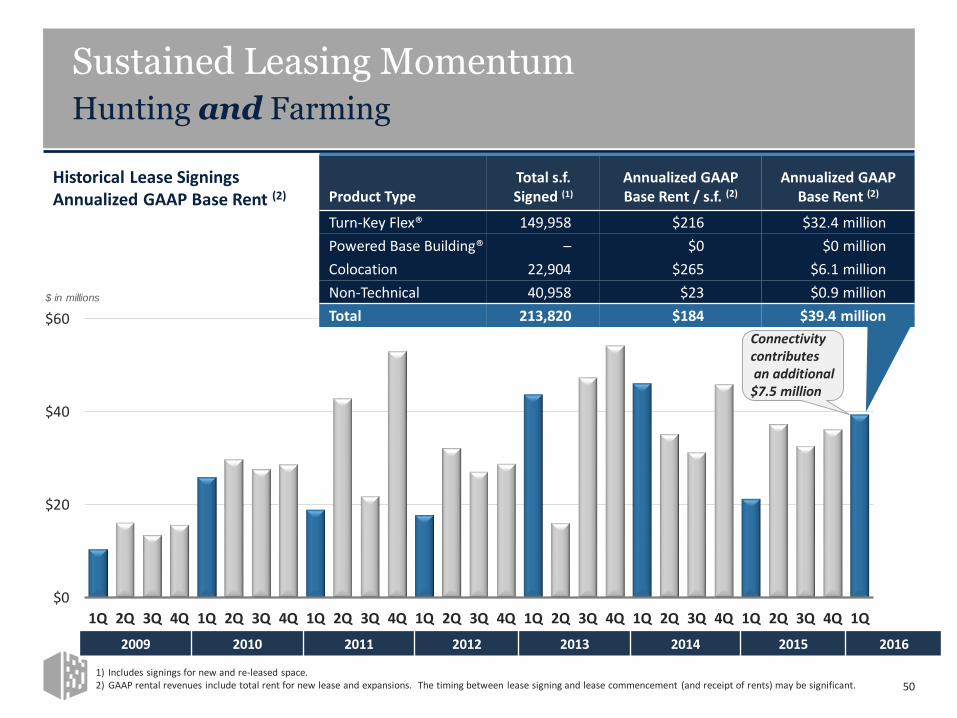
Historical Lease SigningsAnnualized GAAP Base Rent (2)
Sustained Leasing MomentumHunting and Farming
1) Includes signings for new and re-leased space. 2) GAAP rental revenues include total rent for new lease and expansions. The timing between lease signing and lease commencement (and receipt of rents) may be significant.
$ in millions
50
2009 2010 2011 2012 2013 2014 2015 2016
Product TypeTotal s.f. Signed (1)
Annualized GAAPBase Rent / s.f. (2)
Annualized GAAPBase Rent (2)
Turn-Key Flex® 149,958 $216 $32.4 million
Powered Base Building® – $0 $0 million
Colocation 22,904 $265 $6.1 million
Non-Technical 40,958 $23 $0.9 million
Total 213,820 $184 $39.4 million
Connectivity contributesan additional $7.5 million

Healthy Backlog Sets a Solid FoundationSolid Pre-Leasing De-Risks New Market Entry
Note: Amounts shown represent GAAP annualized base rent from signed but not yet commenced leases and are based on current estimates of future lease commencement timing.
Actual results may vary from current estimates. The lag between lease signing and lease commencement (and receipt of rents) may be significant. Expected commencement date at time of signing.
51
$90
$84
$39 $33
$
$25
$50
$75
$100
$125
4Q15 Backlog Signings Commencements 1Q16 Backlog
$ in millions
$50
$90
$31
$9
2016 2017 2018+ Total Backlog
Backlog Roll-Forward + Commencement Timing
Commencements Total BacklogCurrent Period Backlog Signings
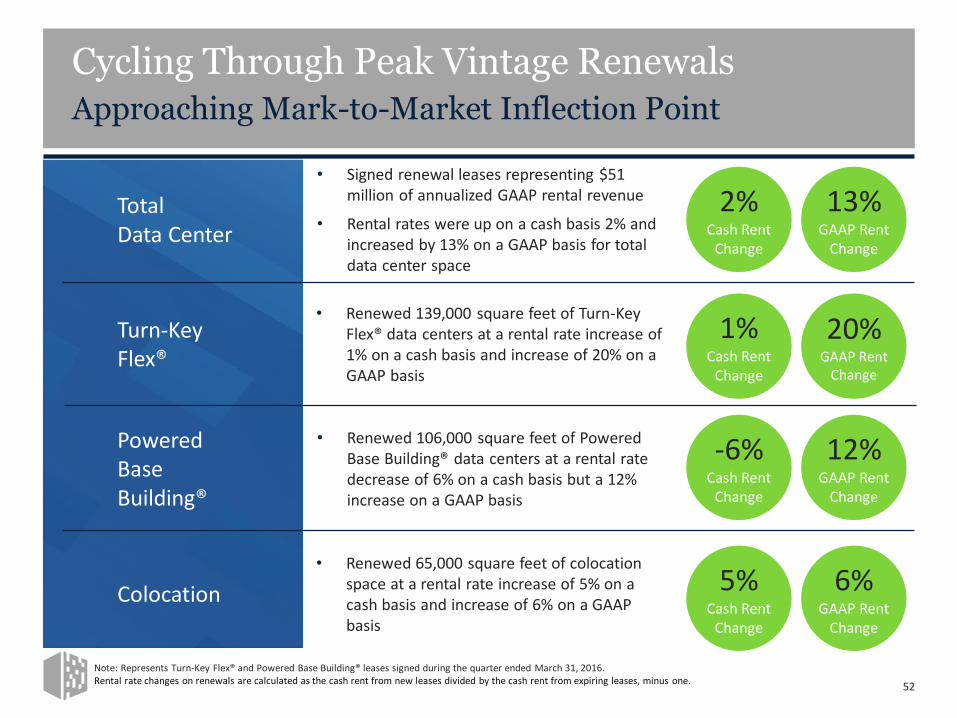
Note: Represents Turn-Key Flex® and Powered Base Building® leases signed during the quarter ended March 31, 2016.Rental rate changes on renewals are calculated as the cash rent from new leases divided by the cash rent from expiring leases, minus one.
Cycling Through Peak Vintage RenewalsApproaching Mark-to-Market Inflection Point
52
• Signed renewal leases representing $51 million of annualized GAAP rental revenue
• Rental rates were up on a cash basis 2% and increased by 13% on a GAAP basis for total data center space
13%GAAP Rent
Change
2%Cash Rent
Change
20%GAAP Rent
Change
1%Cash Rent
Change
6%GAAP Rent
Change
5%Cash Rent
Change
• Renewed 139,000 square feet of Turn-Key Flex® data centers at a rental rate increase of 1% on a cash basis and increase of 20% on a GAAP basis
• Renewed 65,000 square feet of colocation space at a rental rate increase of 5% on a cash basis and increase of 6% on a GAAP basis
TotalData Center
Turn-KeyFlex®
Colocation
12%GAAP Rent
Change
-6%Cash Rent
Change
• Renewed 106,000 square feet of Powered Base Building® data centers at a rental rate decrease of 6% on a cash basis but a 12% increase on a GAAP basis
PoweredBase Building®
$0.01 $0.01 $0.02
$0.03
$1.10
$1.20
$1.30
$1.40
$1.50
1Q16 Core FFO Consensus
Digital RealtyNOI
TelxEBITDA
Digital RealtyG&A
LowerInterest Expense
1Q16 Core FFOActualConsensus (1)
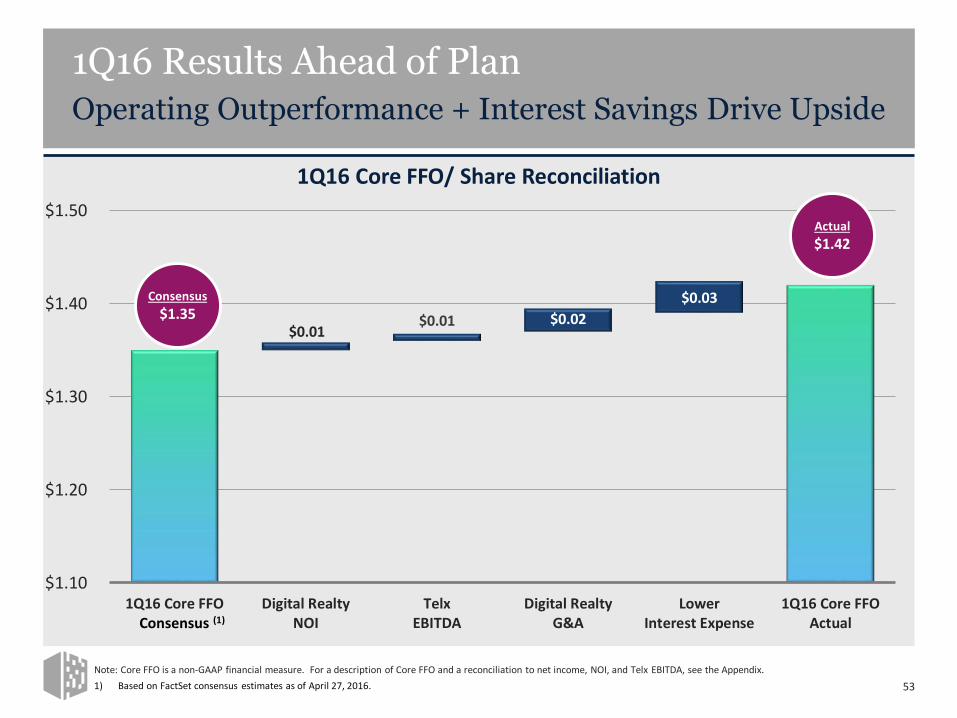
1Q16 Results Ahead of PlanOperating Outperformance + Interest Savings Drive Upside
Note: Core FFO is a non-GAAP financial measure. For a description of Core FFO and a reconciliation to net income, NOI, and Telx EBITDA, see the Appendix.
1) Based on FactSet consensus estimates as of April 27, 2016.
1Q16 Core FFO/ Share Reconciliation
Actual
$1.42
Consensus
$1.35
53
6.8%
7.9%
9.2%
10.5%
4.3% 5.0%
11.7% 12.7%
0%
5%
10%
15%
20%
25%
1Q16 / 1Q15Revenue Growth
1Q16 / 1Q15Adjusted EBITDA Growth
1Q16 / 1Q15Same-Capital Cash
NOI Growth
1Q16 / 1Q15Core FFO / Sh Growth
2016E / 2015Core FFO / Sh Growth
24.0%
25.4%
22.9%
24.3%
7.9%
6.5%
25%
As Reported Constant-Currency Total Including Telx
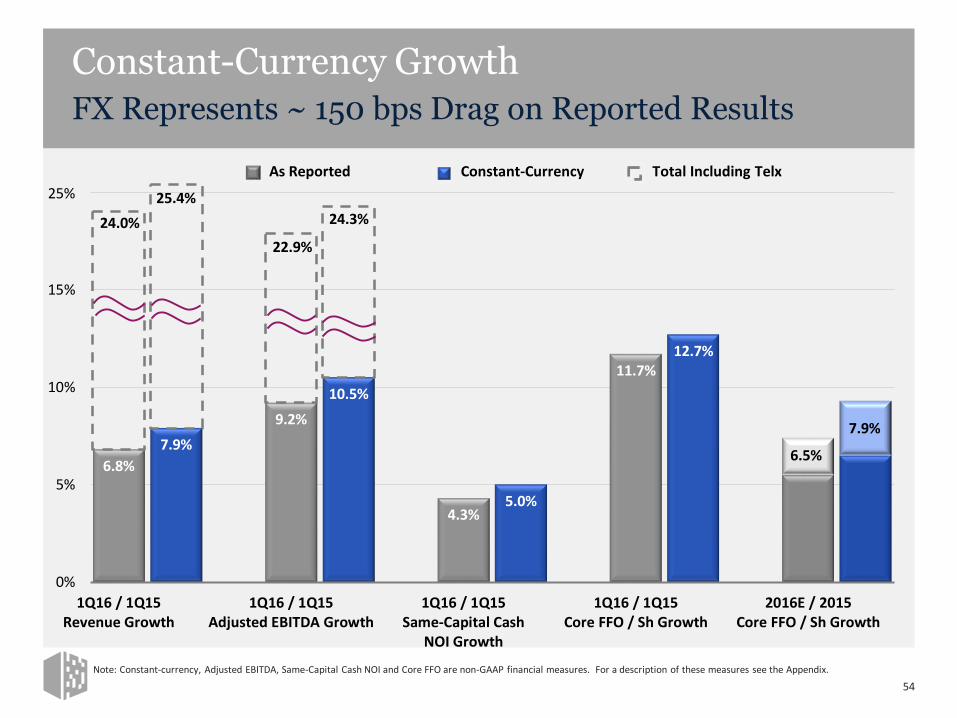
Constant-Currency GrowthFX Represents ~ 150 bps Drag on Reported Results
Note: Constant-currency, Adjusted EBITDA, Same-Capital Cash NOI and Core FFO are non-GAAP financial measures. For a description of these measures see the Appendix.
54
$0.1
$1.0
$0.0 $0.1 $0.2
$0.0
$1.0
$2.4
$0.8
$0.0 $0.0
$1.0
$2.0
$3.0
2015 2016 2017 2018 2019 2020 2021 2022 2023 2024 2025
Secured Mortgage Debt Unsecured Prudential Shelf Facility Pro Rata Share of JV Debt
Unsecured Notes Unsecured Term Loan Unsecured Global Facility
Unsecured Green Bonds
$0.7
(1)
Extended Global Unsecured Revolving Credit Facility and Term Loan Maturities to 2021 and 2023
(3) (4)
($ in billions)
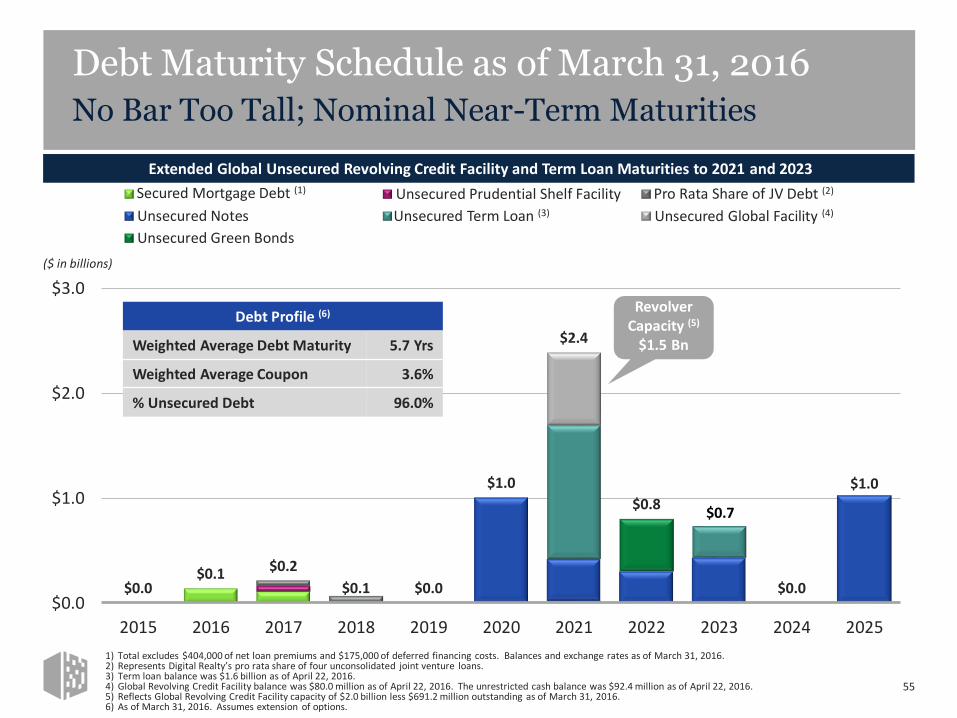
Debt Maturity Schedule as of March 31, 2016No Bar Too Tall; Nominal Near-Term Maturities
55
(2)
Revolver Capacity (5)
$1.5 Bn
Debt Profile (6)
Weighted Average Debt Maturity 5.7 Yrs
Weighted Average Coupon 3.6%
% Unsecured Debt 96.0%
1) Total excludes $404,000 of net loan premiums and $175,000 of deferred financing costs. Balances and exchange rates as of March 31, 2016. 2) Represents Digital Realty’s pro rata share of four unconsolidated joint venture loans. 3) Term loan balance was $1.6 billion as of April 22, 2016. 4) Global Revolving Credit Facility balance was $80.0 million as of April 22, 2016. The unrestricted cash balance was $92.4 million as of April 22, 2016. 5) Reflects Global Revolving Credit Facility capacity of $2.0 billion less $691.2 million outstanding as of March 31, 2016. 6) As of March 31, 2016. Assumes extension of options.
Secured Mortgage Debt (1)
Unsecured Term Loan (3)
Pro Rata Share of JV Debt (2)
Unsecured Global Facility (4)

$0.1
$1.0
$0.0 $0.1 $0.2
$0.0
$1.0
$1.8
$0.8 $0.7
$0.0
$1.0
$2.0
$3.0
2015 2016 2017 2018 2019 2020 2021 2022 2023 2024 2025
Secured Mortgage Debt Unsecured Prudential Shelf Facility Pro Rata Share of JV Debt
Unsecured Notes Unsecured Term Loan Unsecured Global Facility
Unsecured Green Bonds
$0.7
(1)
Extended Global Unsecured Revolving Credit Facility and Term Loan Maturities to 2021 and 2023
(3) (4)
($ in billions)
Debt Maturity Schedule Pro Forma for EurobondNo Bar Too Tall; Nominal Near-Term Maturities
56
(2)
Revolver Capacity (5)
$1.9 Bn
Debt Profile (6)
Weighted Average Debt Maturity 6.8 Yrs
Weighted Average Coupon 3.8%
% Unsecured Debt 96.0%
Note: Pro forma for the offering of 600 million Euro aggregate principal amount of Digital Euro Finco, LLC’s 2.625% Notes due 20241) Total excludes $404,000 of net loan premiums and $175,000 of deferred financing costs. Balances and exchange rates as of March 31, 2016. 2) Represents Digital Realty’s pro rata share of four unconsolidated joint venture loans. 3) Term loan balance was $1.6 billion as of April 22, 2016. 4) Global Revolving Credit Facility balance was $80.0 million as of April 22, 2016. The unrestricted cash balance was $92.4 mil lion as of April 22, 2016. 5) Reflects Global Revolving Credit Facility capacity of $2.0 billion less $80.0 million outstanding as of April 22, 2016. 6) As of April 22, 2016. Assumes extension of options.
Secured Mortgage Debt (1)
Unsecured Term Loan (3)
Pro Rata Share of JV Debt (2)
Unsecured Global Facility (4)

Extending the Global FootprintEntered new target metropolitan area with Frankfurt land acquisition, signed anchor tenant for first project in Japan
Achieving Operating EfficienciesReported 1Q16 core FFO / share of $1.42, seven cents ahead of consensus
Raised GuidanceRevised 2016 core FFO / share outlook from $5.45-$5.60 to $5.55-$5.65
Strengthened the Balance SheetRefinanced line of credit, completed inaugural Euro bond offering in April
57
Recreate S&U on
previous page in
Column Graphs
Consistent Execution on Strategic VisionDelivering Current Results, Seeding Future Growth
Successful 1Q16 Initiatives

Appendix

Definitions of Non-GAAP Financial Measures
The information included in this presentation contains certain non-GAAP financial measures that management believes are helpful in understanding our business, as further described below. Our definition and calculation of non-
GAAP financial measures may differ from those of other REITs, and, therefore, may not be comparable. The non-GAAP financial measures should not be considered an alternative to net income or any other GAAP measurement
of performance and should not be considered an alternative to cash flows from operating, investing or financing activities as a measure of liquidity.
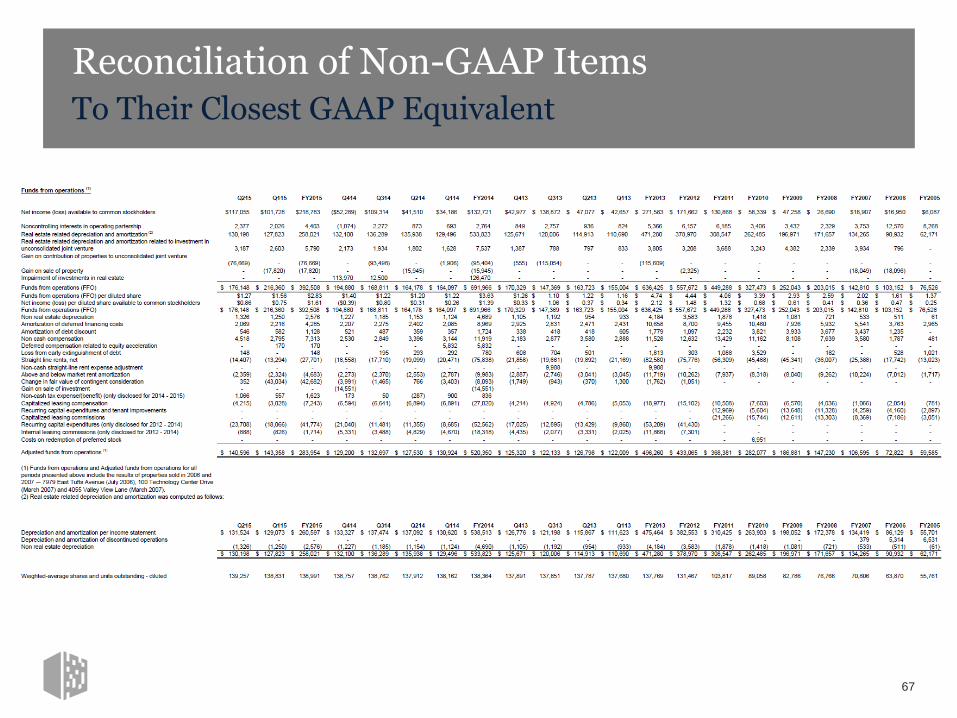
FUNDS FROM OPERATIONS (FFO)
We calculate funds from operations, or FFO, in accordance with the standards established by the National Association of Real Estate Investment Trusts, or NAREIT. FFO represents net income (loss) (computed in accordance with
GAAP), excluding gains (or losses) from sales of property, excluding a gain from a pre-existing relationship, impairment charges, real estate related depreciation and amortization (excluding amortization of deferred financing
costs) and after adjustments for unconsolidated partnerships and joint ventures. Management uses FFO as a supplemental performance measure because, in excluding real estate related depreciation and amortization and gains
and losses from property dispositions and after adjustments for unconsolidated partnerships and joint ventures, it provides a performance measure that, when compared year over year, captures trends in occupancy rates,
rental rates and operating costs. We also believe that, as a widely recognized measure of the performance of REITs, FFO will be used by investors as a basis to compare our operating performance with that of other REITs.
However, because FFO excludes depreciation and amortization and captures neither the changes in the value of our properties that result from use or market conditions, nor the level of capital expenditures and capitalized
leasing commissions necessary to maintain the operating performance of our properties, all of which have real economic effect and could materially impact our financial condition and results from operations, the utility of FFO as
a measure of our performance is limited. Other REITs may not calculate FFO in accordance with the NAREIT definition and, accordingly, our FFO may not be comparable to such other REITs’ FFO. Accordingly, FFO should be
considered only as a supplement to net income computed in accordance with GAAP as a measure of our performance.
CORE FUNDS FROM OPERATATIONS (Core FFO)
We present core funds from operations, or core FFO, as a supplemental operating measure because, in excluding certain items that do not reflect core revenue or expense streams, it provides a performance measure that, when
compared year over year, captures trends in our core business operating performance. We calculate core FFO by adding to or subtracting from FFO (i) termination fees and other non-core revenues, (ii) transaction expenses, (iii)
loss from early extinguishment of debt, (iv) change in fair value of contingent consideration, (v) severance-related accrual, equity acceleration, and legal expenses, (vi) bridge facility fees and (vii) other non-core expense
adjustments. Because certain of these adjustments have a real economic impact on our financial condition and results from operations, the utility of core FFO as a measure of our performance is limited. Other REITs may not
calculate core FFO in a consistent manner. Accordingly, our core FFO may not be comparable to other REITs' core FFO. Core FFO should be considered only as a supplement to net income computed in accordance with GAAP as a
measure of our performance.
CONSTANT CURRENCY CORE FUNDS FROM OPERATIONS
We calculate constant-currency core funds from operations by adjusting the core funds from operations for foreign currency translations.
ADJUSTED FUNDS FROM OPERATIONS (AFFO)
We present adjusted funds from operations, or AFFO, as a supplemental operating measure because, when compared year over year, it assesses our ability to fund dividend and distribution requirements from our operating
activities. We also believe that, as a widely recognized measure of the operations of REITs, AFFO will be used by investors as a basis to assess our ability to fund dividend payments in comparison to other REITs, including on a per
share and unit basis. We calculate AFFO by adding to or subtracting from core FFO (i) non-real estate depreciation, (ii) amortization of deferred financing costs, (iii) amortization of debt discount/premium, (iv) non-cash stock-
based compensation expense, (v) non-cash stock-based compensation expense, (vi) straight-line rent revenue, (vii) straight-line rent expense, (viii) above- and below-market rent amortization, (ix) non-cash tax expense, (x)
capitalized leasing compensation, (xi) recurring capital expenditures and (xii) capitalized internal leasing commissions. Other REITs may not calculate AFFO in a consistent manner. Accordingly, our AFFO may not be comparable to
other REITs’ AFFO. AFFO should be considered only as a supplement to net income computed in accordance with GAAP as a measure of our performance.
59
Definitions of Non-GAAP Financial Measures (cont.)
EBITDA AND ADJUSTED EBITDA:
We believe that earnings before interest, loss from early extinguishment of debt, income taxes and depreciation and amortization, or EBITDA, and Adjusted EBITDA (as defined below), are useful
supplemental performance measures because they allow investors to view our performance without the impact of non-cash depreciation and amortization or the cost of debt and, with respect to
Adjusted EBITDA, change in fair value of contingent consideration, severance related accrual, equity acceleration, and legal expenses, transaction expenses, (gain) loss on sale of property, (gain) loss
on settlement of pre-existing relationship with Telx, other non-core expense adjustments, non-controlling interests, and preferred stock dividends. Adjusted EBITDA is EBITDA excluding change in fair
value of contingent consideration, severance related accrual, equity acceleration, and legal expenses, transaction expenses, gain (loss) on sale of property, gain on settlement of pre-existing
relationship with Telx, other non-core expense adjustments, non-controlling interests, and preferred stock dividends. In addition, we believe EBITDA and Adjusted EBITDA are frequently used by
securities analysts, investors and other interested parties in the evaluation of REITs. Because EBITDA and Adjusted EBITDA are calculated before recurring cash charges including interest expense and
income taxes, exclude capitalized costs, such as leasing commissions, and are not adjusted for capital expenditures or other recurring cash requirements of our business, their utility as a measure of
our performance is limited. Other REITs may calculate EBITDA and Adjusted EBITDA differently than we do; accordingly, our EBITDA and Adjusted EBITDA may not be comparable to such other REITs’
EBITDA and Adjusted EBITDA. Accordingly, EBITDA and Adjusted EBITDA should be considered only as supplements to net income computed in accordance with GAAP as a measure of our financial
performance.
NET OPERATING INCOME (NOI) AND CASH NOI
Net Operating Income (NOI) and Cash NOI: Net operating income, or NOI, represents rental revenue, interconnection revenue and tenant reimbursement revenue less utilities, rental property
operating expenses, repair and maintenance expenses, property taxes and insurance expenses (as reflected in the statement of operations). NOI is commonly used by stockholders, company
management and industry analysts as a measurement of operating performance of the company’s rental portfolio. Cash NOI is NOI less straight-line rents and above and below market rent
amortization. Cash NOI is commonly used by stockholders, company management and industry analysts as a measure of property operating performance on a cash basis. However, because NOI and
cash NOI exclude depreciation and amortization and capture neither the changes in the value of our properties that result from use or market conditions, nor the level of capital expenditures and
capitalized leasing commissions necessary to maintain the operating performance of our properties, all of which have real economic effect and could materially impact our results from operations, the
utility of NOI and cash NOI as measures of our performance is limited. Other REITs may not calculate NOI and cash NOI in the same manner we do and, accordingly, our NOI and cash NOI may not be
comparable to such other REITs’ NOI and cash NOI. Accordingly, NOI and cash NOI should be considered only as supplements to net income computed in accordance with GAAP as measures of our
performance.
SAME-CAPITAL CASH NOI
Same-capital Cash NOI is Cash NOI (as defined above) calculated for “Same-capital” properties. “Same-capital” properties are defined as properties owned as of December 31, 2013 with less than 5%
of total rentable square feet under development and excludes properties that were undergoing, or were expected to undergo, development activities in 2014-2015, properties classified as held for
sale, and properties sold or contributed to joint ventures for all periods presented.
60
Reconciliation of Non-GAAP Items To Their Closest GAAP Equivalent
61
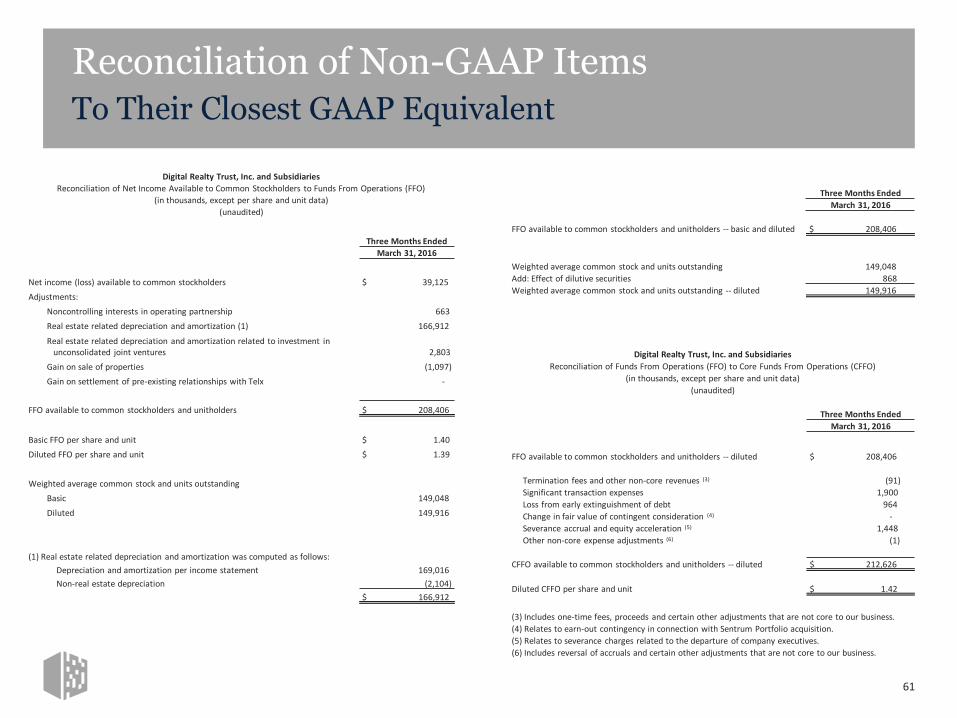
Digital Realty Trust, Inc. and Subsidiaries
Reconciliation of Net Income Available to Common Stockholders to Funds From Operations (FFO)
(in thousands, except per share and unit data)
(unaudited)
Three Months Ended
March 31, 2016
Net income (loss) available to common stockholders $ 39,125
Adjustments:
Noncontrolling interests in operating partnership 663
Real estate related depreciation and amortization (1) 166,912
Real estate related depreciation and amortization related to investment inunconsolidated joint ventures 2,803
Gain on sale of properties (1,097)
Gain on settlement of pre-existing relationships with Telx -
FFO available to common stockholders and unitholders $ 208,406
Basic FFO per share and unit $ 1.40
Diluted FFO per share and unit $ 1.39
Weighted average common stock and units outstanding
Basic 149,048
Diluted 149,916
(1) Real estate related depreciation and amortization was computed as follows:
Depreciation and amortization per income statement 169,016
Non-real estate depreciation (2,104)
$ 166,912
Three Months Ended
March 31, 2016
FFO available to common stockholders and unitholders -- basic and diluted $ 208,406
Weighted average common stock and units outstanding 149,048
Add: Effect of dilutive securities 868
Weighted average common stock and units outstanding -- diluted 149,916
Digital Realty Trust, Inc. and Subsidiaries
Reconciliation of Funds From Operations (FFO) to Core Funds From Operations (CFFO)
(in thousands, except per share and unit data)
(unaudited)
Three Months Ended
March 31, 2016
FFO available to common stockholders and unitholders -- diluted $ 208,406
Termination fees and other non-core revenues (3) (91)
Significant transaction expenses 1,900
Loss from early extinguishment of debt 964
Change in fair value of contingent consideration (4) -
Severance accrual and equity acceleration (5) 1,448
Other non-core expense adjustments (6) (1)
CFFO available to common stockholders and unitholders -- diluted $ 212,626
Diluted CFFO per share and unit $ 1.42
(3) Includes one-time fees, proceeds and certain other adjustments that are not core to our business.
(4) Relates to earn-out contingency in connection with Sentrum Portfolio acquisition.
(5) Relates to severance charges related to the departure of company executives.
(6) Includes reversal of accruals and certain other adjustments that are not core to our business.
Reconciliation of Non-GAAP Items To Their Closest GAAP Equivalent
62
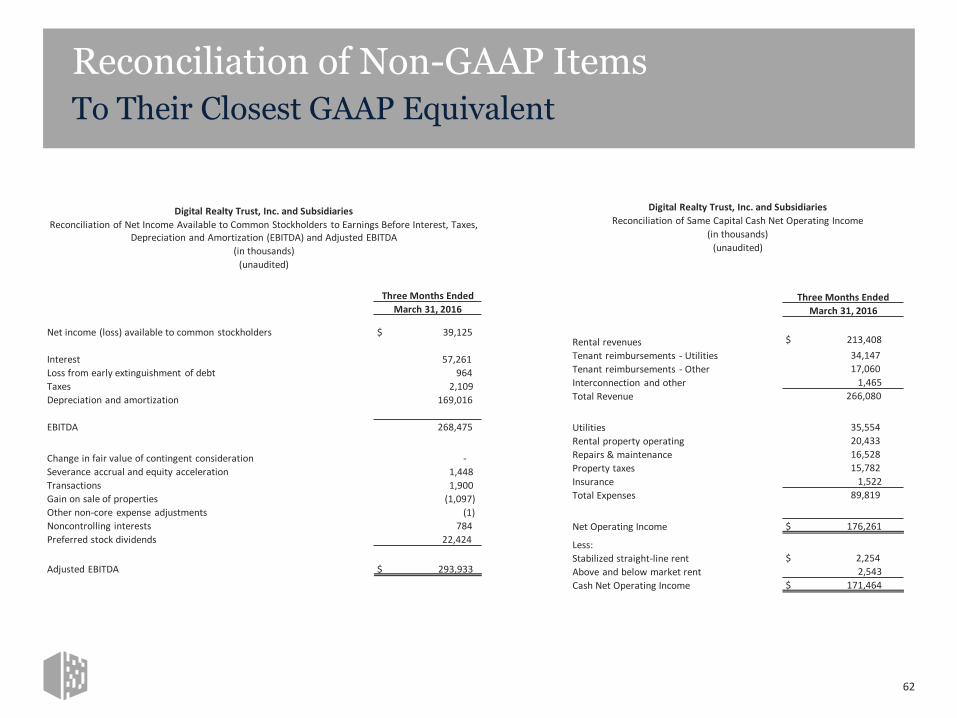
Digital Realty Trust, Inc. and Subsidiaries
Reconciliation of Net Income Available to Common Stockholders to Earnings Before Interest, Taxes, Depreciation and Amortization (EBITDA) and Adjusted EBITDA
(in thousands)
(unaudited)
Three Months Ended
March 31, 2016
Net income (loss) available to common stockholders $ 39,125
Interest 57,261
Loss from early extinguishment of debt 964
Taxes 2,109
Depreciation and amortization 169,016
EBITDA 268,475
Change in fair value of contingent consideration -
Severance accrual and equity acceleration 1,448
Transactions 1,900
Gain on sale of properties (1,097)
Other non-core expense adjustments (1)
Noncontrolling interests 784
Preferred stock dividends 22,424
Adjusted EBITDA $ 293,933
Digital Realty Trust, Inc. and Subsidiaries
Reconciliation of Same Capital Cash Net Operating Income
(in thousands)
(unaudited)
Three Months Ended
March 31, 2016
Rental revenues $ 213,408
Tenant reimbursements - Utilities 34,147
Tenant reimbursements - Other 17,060
Interconnection and other 1,465
Total Revenue 266,080
Utilities 35,554
Rental property operating 20,433
Repairs & maintenance 16,528
Property taxes 15,782
Insurance 1,522
Total Expenses 89,819
Net Operating Income $ 176,261
Less:
Stabilized straight-line rent $ 2,254
Above and below market rent 2,543
Cash Net Operating Income $ 171,464
Reconciliation of Non-GAAP Items To Their Closest GAAP Equivalent
63
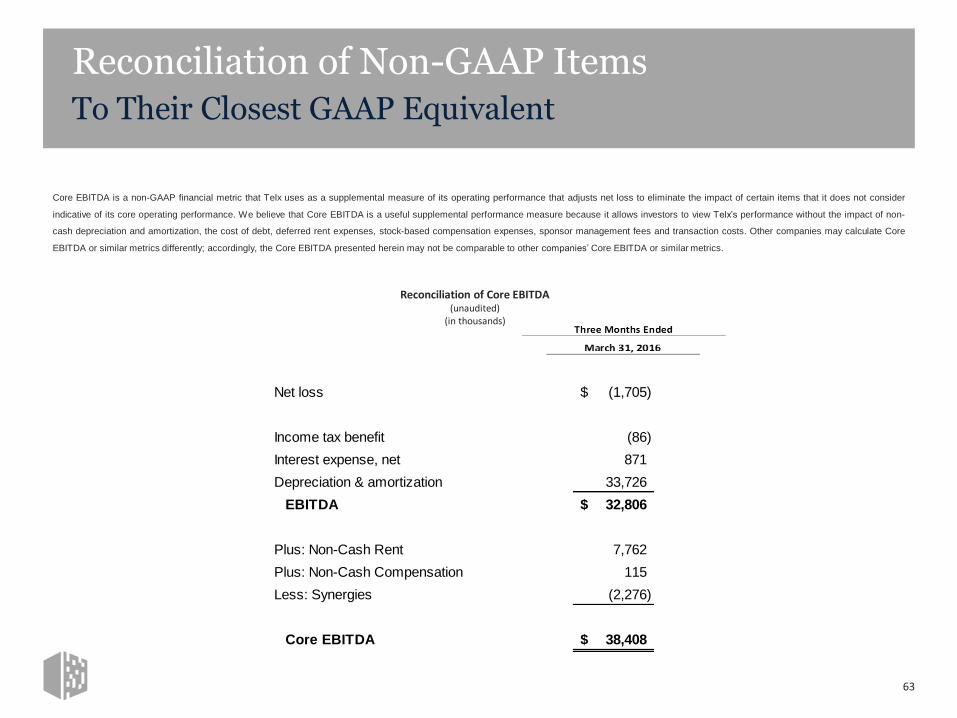
Reconciliation of Core EBITDA(unaudited)
(in thousands)
Net loss (1,705)$
Income tax benefit (86)
Interest expense, net 871
Depreciation & amortization 33,726
EBITDA 32,806$
Plus: Non-Cash Rent 7,762
Plus: Non-Cash Compensation 115
Less: Synergies (2,276)
Core EBITDA 38,408$
Core EBITDA is a non-GAAP financial metric that Telx uses as a supplemental measure of its operating performance that adjusts net loss to eliminate the impact of certain items that it does not consider
indicative of its core operating performance. We believe that Core EBITDA is a useful supplemental performance measure because it allows investors to view Telx’s performance without the impact of non-
cash depreciation and amortization, the cost of debt, deferred rent expenses, stock-based compensation expenses, sponsor management fees and transaction costs. Other companies may calculate Core
EBITDA or similar metrics differently; accordingly, the Core EBITDA presented herein may not be comparable to other companies’ Core EBITDA or similar metrics.
Reconciliation of Non-GAAP Items To Their Closest GAAP Equivalent
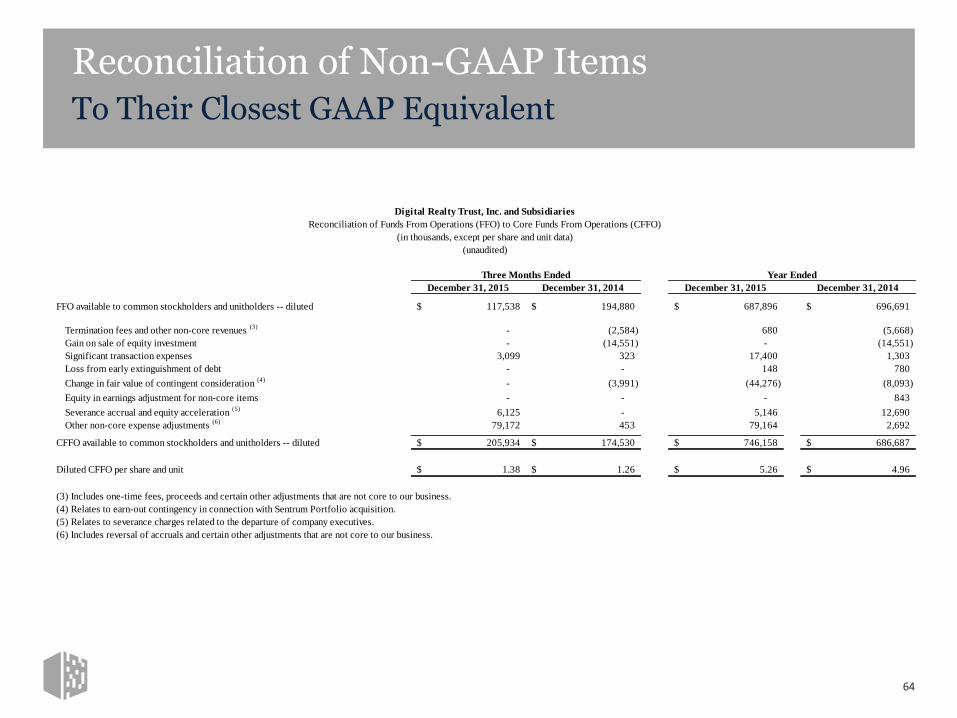
64
December 31, 2015 December 31, 2014 December 31, 2015 December 31, 2014
FFO available to common stockholders and unitholders -- diluted 117,538$ 194,880$ 687,896$ 696,691$
Termination fees and other non-core revenues (3)
- (2,584) 680 (5,668)
Gain on sale of equity investment - (14,551) - (14,551)
Significant transaction expenses 3,099 323 17,400 1,303
Loss from early extinguishment of debt - - 148 780
Change in fair value of contingent consideration (4)
- (3,991) (44,276) (8,093)
Equity in earnings adjustment for non-core items - - - 843
Severance accrual and equity acceleration (5)
6,125 - 5,146 12,690
Other non-core expense adjustments (6)
79,172 453 79,164 2,692
CFFO available to common stockholders and unitholders -- diluted 205,934$ 174,530$ 746,158$ 686,687$
Diluted CFFO per share and unit 1.38$ 1.26$ 5.26$ 4.96$
(3) Includes one-time fees, proceeds and certain other adjustments that are not core to our business.
(4) Relates to earn-out contingency in connection with Sentrum Portfolio acquisition.
(5) Relates to severance charges related to the departure of company executives.
(6) Includes reversal of accruals and certain other adjustments that are not core to our business.
Digital Realty Trust, Inc. and Subsidiaries
Reconciliation of Funds From Operations (FFO) to Core Funds From Operations (CFFO)
(in thousands, except per share and unit data)
(unaudited)
Three Months Ended Year Ended
Reconciliation of Non-GAAP Items To Their Closest GAAP Equivalent
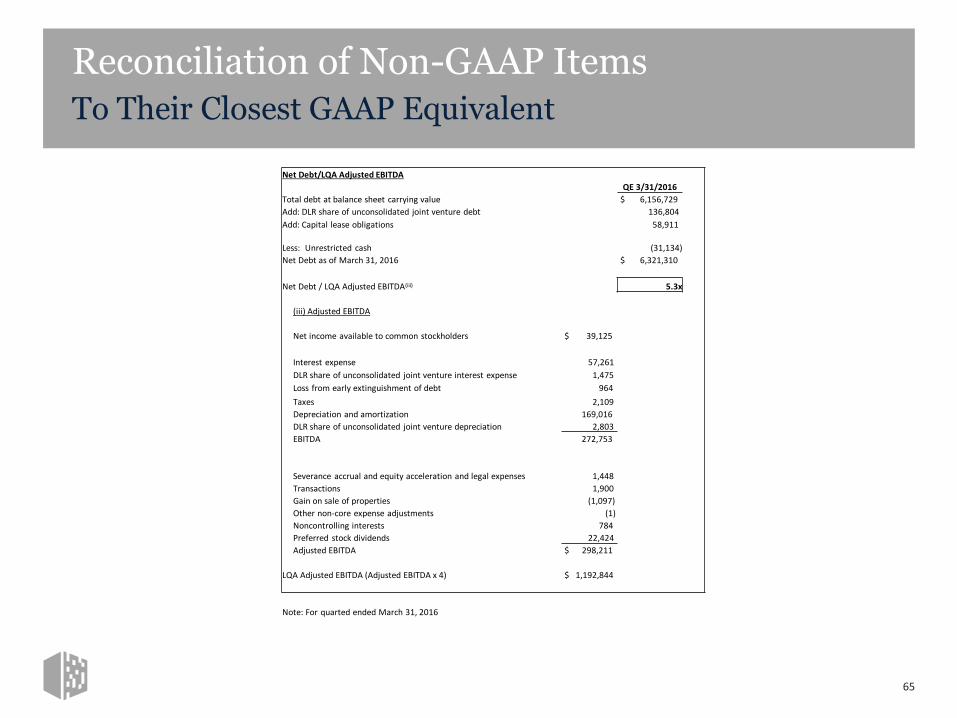
65
Net Debt/LQA Adjusted EBITDA
QE 3/31/2016
Total debt at balance sheet carrying value $ 6,156,729
Add: DLR share of unconsolidated joint venture debt 136,804
Add: Capital lease obligations 58,911
Less: Unrestricted cash (31,134)
Net Debt as of March 31, 2016 $ 6,321,310
Net Debt / LQA Adjusted EBITDA(iii) 5.3x
(iii) Adjusted EBITDA
Net income available to common stockholders $ 39,125
Interest expense 57,261
DLR share of unconsolidated joint venture interest expense 1,475
Loss from early extinguishment of debt 964
Taxes 2,109
Depreciation and amortization 169,016
DLR share of unconsolidated joint venture depreciation 2,803
EBITDA 272,753
Severance accrual and equity acceleration and legal expenses 1,448
Transactions 1,900
Gain on sale of properties (1,097)
Other non-core expense adjustments (1)
Noncontrolling interests 784
Preferred stock dividends 22,424
Adjusted EBITDA $ 298,211
LQA Adjusted EBITDA (Adjusted EBITDA x 4) $ 1,192,844
Note: For quarted ended March 31, 2016
Reconciliation of Non-GAAP Items To Their Closest GAAP Equivalent
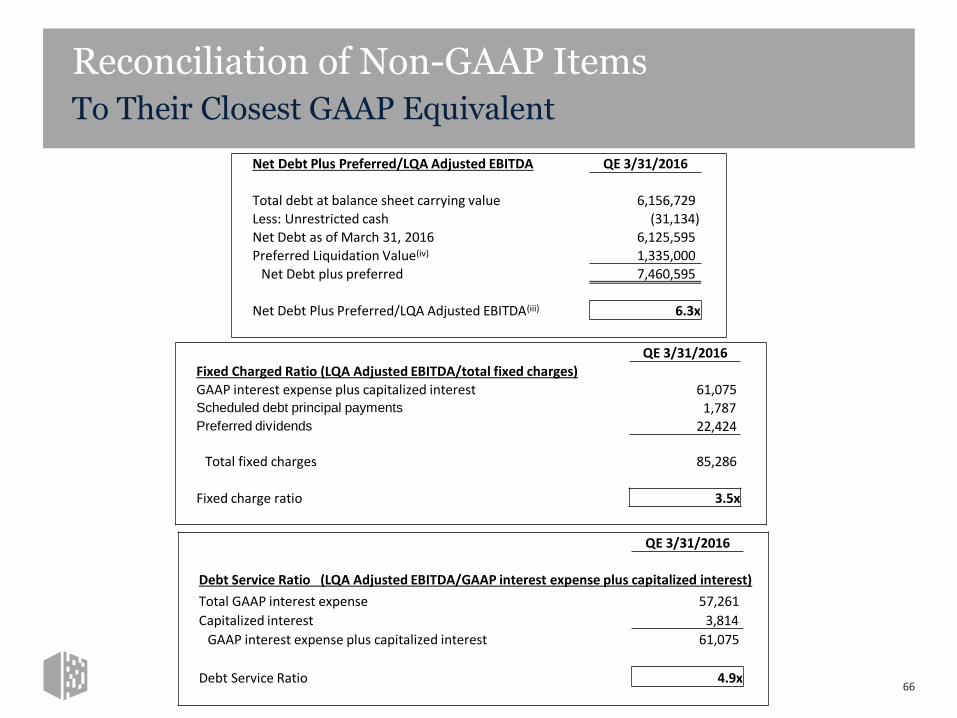
66
Net Debt Plus Preferred/LQA Adjusted EBITDA QE 3/31/2016
Total debt at balance sheet carrying value 6,156,729 Less: Unrestricted cash (31,134)
Net Debt as of March 31, 2016 6,125,595
Preferred Liquidation Value(iv) 1,335,000
Net Debt plus preferred 7,460,595
Net Debt Plus Preferred/LQA Adjusted EBITDA(iii) 6.3x
QE 3/31/2016
Fixed Charged Ratio (LQA Adjusted EBITDA/total fixed charges)
GAAP interest expense plus capitalized interest 61,075 Scheduled debt principal payments 1,787 Preferred dividends 22,424
Total fixed charges 85,286
Fixed charge ratio 3.5x
QE 3/31/2016
Debt Service Ratio (LQA Adjusted EBITDA/GAAP interest expense plus capitalized interest)
Total GAAP interest expense 57,261
Capitalized interest 3,814
GAAP interest expense plus capitalized interest 61,075
Debt Service Ratio 4.9x
Reconciliation of Non-GAAP Items To Their Closest GAAP Equivalent
67

Forward-Looking Statements
The information included in this presentation contains forward-looking statements. Such statements are based on management’s beliefs and assumptions made based on information currently available to
management. Such forward-looking statements include statements relating to: our economic outlook; opportunities and strategies, including ROIC, recycling assets and capital, and sources of growth; the
expected effect of foreign currency translation adjustments on our financials; business drivers; sources and uses; our expected development plans and completions, including timing, total square footage, IT
capacity and raised floor space upon completion; expected availability for leasing efforts, sales incentive program, mid-market and colocation initiatives; organizational initiatives; joint venture opportunities;
our partnerships and alliances; occupancy and total investment; our expected investment in our properties; our estimated time to stabilization and targeted returns at stabilization of our properties; our
expected future acquisitions; acquisitions strategy; available inventory and development strategy; the signing and commencement of leases, and related rental revenue; lag between signing and
commencement of leases; our expected same capital portfolio growth; our expected growth and stabilization of development completions and acquisitions; our expected mark-to-market rates on lease
expirations, lease rollovers and expected rental rate changes; our expected yields on investments; our expectations with respect to capital investments at lease expiration on existing Turn-Key Flex space;
barriers to entry; competition; debt maturities; lease maturities; our expected returns on invested capital; estimated absorption rates; our other expected future financial and other results, and the
assumptions underlying such results; our top investment markets and market opportunities; our ability to access the capital markets; expected time and cost savings to our customers; our customers’ capital
investments; our plans and intentions; future data center utilization, utilization rates, growth rates, trends, supply and demand, and demand drivers; datacenter outsourcing trends; datacenter expansion
plans; estimated kW/MW requirements; growth in the overall Internet infrastructure sector and segments thereof; the replacement cost of our assets; the development costs of our buildings, and lead times;
estimated costs for customers to deploy or migrate to a new data center; capital expenditures; the effect new leases and increases in rental rates will have on our rental revenues and results of operations;
lease expiration rates; our ability to borrow funds under our credit facilities; estimates of the value of our development portfolio; our ability to meet our liquidity needs, including the ability to raise
additional capital; credit ratings; capitalization rates, or cap rates, potential new markets; dividend payments and our dividend policy; projected financial information and covenant metrics; annualized; other
forward-looking financial data; leasing expectations; our exposure to tenants in certain industries; our expectations and underlying assumptions regarding our sensitivity to fluctuations in foreign exchange
rates and energy prices; and the sufficiency of our capital to fund future requirements. You can identify forward-looking statements by the use of forward-looking terminology such as “believes,” “expects,”
“may,” “will,” “should,” “seeks,” “approximately,” “intends,” “plans,” “pro forma,” “estimates” or “anticipates” or the negative of these words and phrases or similar words or phrases which are predictions
of or indicate future events or trends and discussions which do not relate solely to historical matters. Such statements are subject to risks, uncertainties and assumptions, are not guarantees of future
performance and may be affected by known and unknown risks, trends, uncertainties and factors that are beyond our control that may cause actual results to vary materially. Some of the risks and
uncertainties include, among others, the following: the impact of current global economic, credit and market conditions; current local economic conditions in the geographies in which we operate; decreases
in information technology spending, including as a result of economic slowdowns or recession; adverse economic or real estate developments in our industry or the industry sectors that we sell to (including
risks relating to decreasing real estate valuations and impairment charges); our dependence upon significant tenants; bankruptcy or insolvency of a major tenant or a significant number of smaller tenants;
defaults on or non-renewal of leases by tenants; our failure to obtain necessary debt and equity financing; risks associated with using debt to fund our business activities, including re-financing and interest
rate risks, our failure to repay debt when due, adverse changes in our credit ratings or our breach of covenants or other terms contained in our loan facilities and agreements; financial market fluctuations;
changes in foreign currency exchange rates; our inability to manage our growth effectively; difficulty acquiring or operating properties in foreign jurisdictions; our failure to successfully integrate and operate
acquired or developed properties or businesses, including Telx; the suitability for our properties and data center infrastructure, delays or disruptions in connectivity, failure of our physical infrastructure or
services or availability of power; risks related to joint venture investments, including as a result of our lack of control of such investments; delays or unexpected costs in development of properties; decreased
rental rates, increased operating costs or increased vacancy rates; increased competition or available supply of data center space; our inability to successfully develop and lease new properties and
development space; difficulties in identifying properties to acquire and completing acquisitions; our inability to acquire off-market properties; our inability to comply with the rules and regulations applicable
to reporting companies; our failure to maintain our status as a REIT; possible adverse changes to tax laws; restrictions on our ability to engage in certain business activities; environmental uncertainties and
risks related to natural disasters; losses in excess of our insurance coverage; changes in foreign laws and regulations, including those related to taxation and real estate ownership and operation; and changes
in local, state and federal regulatory requirements, including changes in real estate and zoning laws and increases in real property tax rates. The risks described above are not exhaustive, and additional
factors could adversely affect our business and financial performance, including those discussed in our annual report on Form 10-K for the year ended December 31, 2015, as amended, and subsequent filings
with the Securities and Exchange Commission. We expressly disclaim any responsibility to update forward-looking statements, whether as a result of new information, future events or otherwise.
68