Embed Size (px)
Citation preview

COMPANY PRESENTATION
03.2015
Equity Story
Deutsche EuroShop is Germany´s only public company that invests solely in shopping centers.
Shopping centers are attractive investments because of – continuously positive development of rents – stable long term growth – prime locations – high quality standards
Deutsche EuroShop does not seek short-term success, but rather long-term growth and the resulting stable increase in the value of the portfolio.
03.2015 COMPANY PRESENTATION
2
COMPANY

At a Glance
19 shopping centers on high street and in established locations – 16 in Germany and one each in Austria, Hungary and Poland.
2014 portfolio valuation: 5.87% net initial yield (EPRA)
Professional center management by ECE, the European market leader in this industry
03.2015 COMPANY PRESENTATION
3
COMPANY
1) 100%-view
Lettable space approx. 930,000 sqm
Retail shops approx. 2,350
Market value approx. €3.7 billion
Rents per year €240 million1)
Occupancy rate 99%
avg. lettable space per DES-center: inner city 39,200 sqm est. Locations 100,900 sqm

Key Figures3)
03.2015 COMPANY PRESENTATION
4
COMPANY
1) 2010-2014, Compound Annual Growth Rate (CAGR) 2) Proposal 3) Preliminary Results
REVENUE €m
EBIT €m
NUMBER OF SHARES mn
FFO €m
DIVIDEND PER SHARE €
NAV PER SHARE (EPRA) €
51.63 51.63 53.95 53.95 53.95
2010 2011 2012 2013 2014
61.5
83.1 87.0 112.0
120.5
2010 2011 2012 2013 2014
1.10 1.10
1.20 1.25
2010 2011 2012 2013 2014
26.36 27.64 28.53 30.59 33.17
2010 2011 2012 2013 2014
+1%1) +5.9%1)
+18%1)
144.2
190.0 178.2 188.0 200.8
2010 2011 2012 2013 2014
1.302) +4.3%1)
Equity method Equity method
124.0
165.7 151.6
165.8 177.5
2010 2011 2012 2013 2014
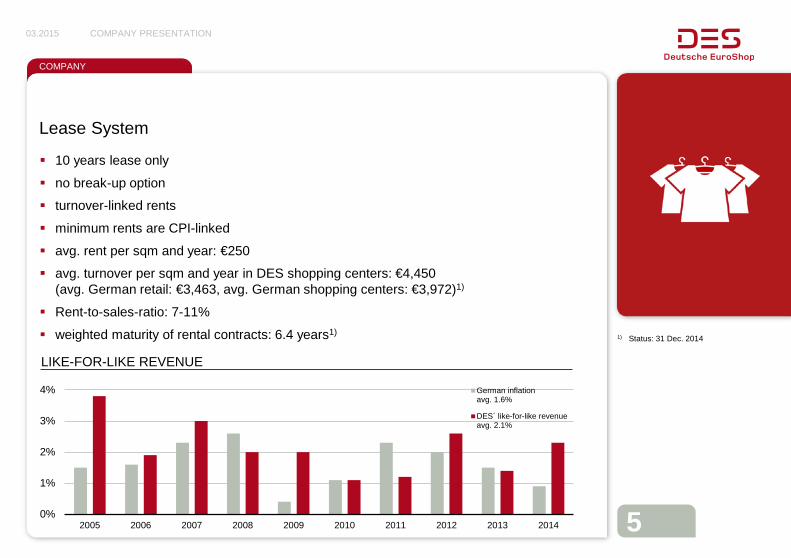
Lease System
10 years lease only
no break-up option
turnover-linked rents
minimum rents are CPI-linked
avg. rent per sqm and year: €250
avg. turnover per sqm and year in DES shopping centers: €4,450
(avg. German retail: €3,463, avg. German shopping centers: €3,972)1)
Rent-to-sales-ratio: 7-11%
weighted maturity of rental contracts: 6.4 years1)
03.2015 COMPANY PRESENTATION
5
COMPANY
0%
1%
2%
3%
4%
2005 2006 2007 2008 2009 2010 2011 2012 2013 2014
German inflationavg. 1.6%
DES´ like-for-like revenueavg. 2.1%
LIKE-FOR-LIKE REVENUE
1) Status: 31 Dec. 2014
Targets
Long term net asset value enhancement
Main focus on NAV and dividend
“buy & hold”-strategy, Continuous growth
Stable and attractive dividends Dividend yield: currently 2.9%
Investment-focus: At least 75% Germany and up to 25% Europe
Portfolio extension – by acquisition of new shopping centers – by increasing existing amounts of holdings – by expansion of portfolio centers
03.2015 COMPANY PRESENTATION
6
COMPANY
03.2015 COMPANY PRESENTATION
7
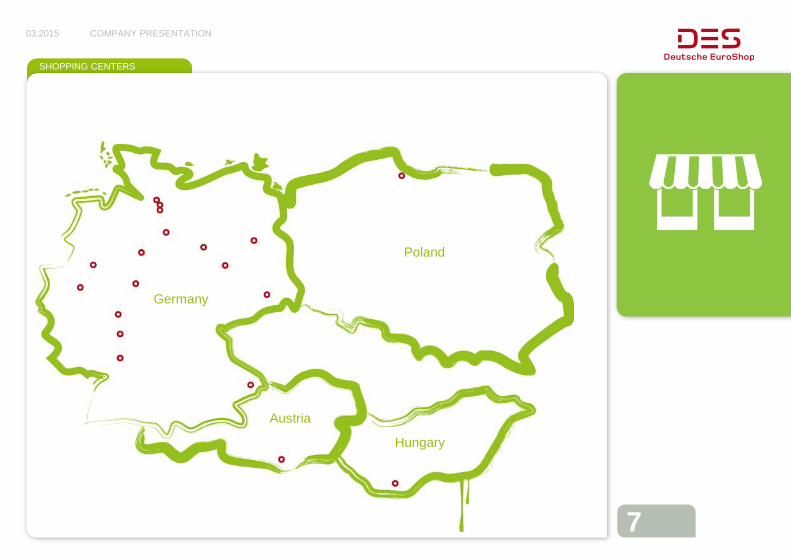
SHOPPING CENTERS
Germany
Austria
Poland
Hungary
Germany
03.2015 COMPANY PRESENTATION
8
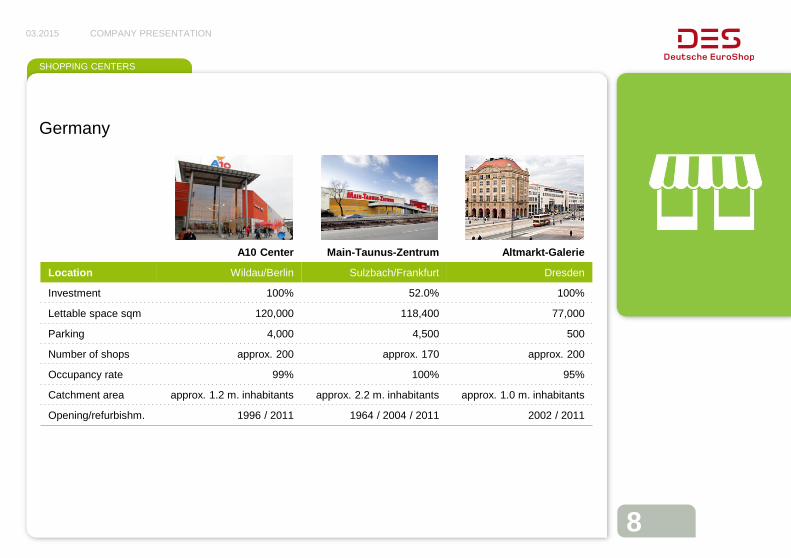
SHOPPING CENTERS
A10 Center Main-Taunus-Zentrum Altmarkt-Galerie
Location Wildau/Berlin Sulzbach/Frankfurt Dresden
Investment 100% 52.0% 100%
Lettable space sqm 120,000 118,400 77,000
Parking 4,000 4,500 500
Number of shops approx. 200 approx. 170 approx. 200
Occupancy rate 99% 100% 95%
Catchment area approx. 1.2 m. inhabitants approx. 2.2 m. inhabitants approx. 1.0 m. inhabitants
Opening/refurbishm. 1996 / 2011 1964 / 2004 / 2011 2002 / 2011
Germany
03.2015 COMPANY PRESENTATION
9
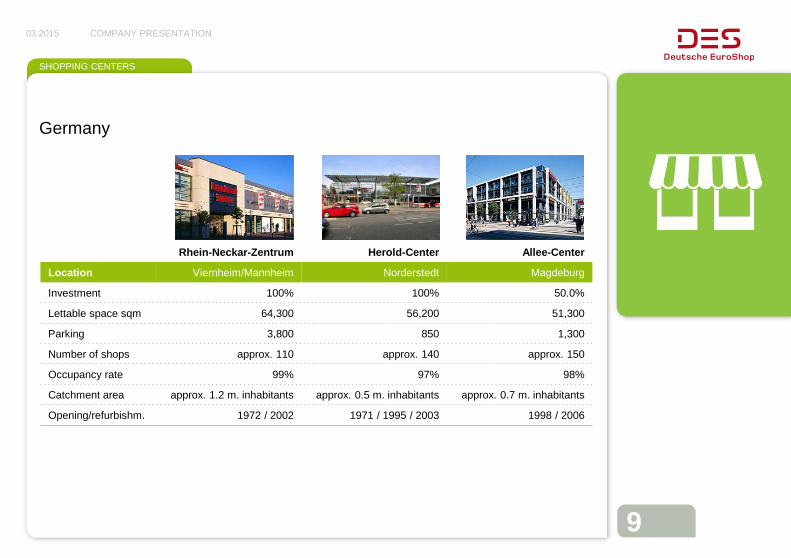
SHOPPING CENTERS
Rhein-Neckar-Zentrum Herold-Center Allee-Center
Location Viernheim/Mannheim Norderstedt Magdeburg
Investment 100% 100% 50.0%
Lettable space sqm 64,300 56,200 51,300
Parking 3,800 850 1,300
Number of shops approx. 110 approx. 140 approx. 150
Occupancy rate 99% 97% 98%
Catchment area approx. 1.2 m. inhabitants approx. 0.5 m. inhabitants approx. 0.7 m. inhabitants
Opening/refurbishm. 1972 / 2002 1971 / 1995 / 2003 1998 / 2006

Germany
03.2015 COMPANY PRESENTATION
10
SHOPPING CENTERS
Billstedt-Center Phoenix-Center Forum
Location Hamburg Hamburg Wetzlar
Investment 100% 50.0% 65.0%
Lettable space sqm 42,800 39,200 34,400
Parking 1,500 1,600 1,700
Number of shops approx. 110 approx. 110 approx. 110
Occupancy rate 99% 100% 100%
Catchment area approx. 0.7 m. inhabitants approx. 0.6 m. inhabitants approx. 0.5 m. inhabitants
Opening/refurbishm. 1969 / 1977 / 1996 2004 2005
Germany
03.2015 COMPANY PRESENTATION
11
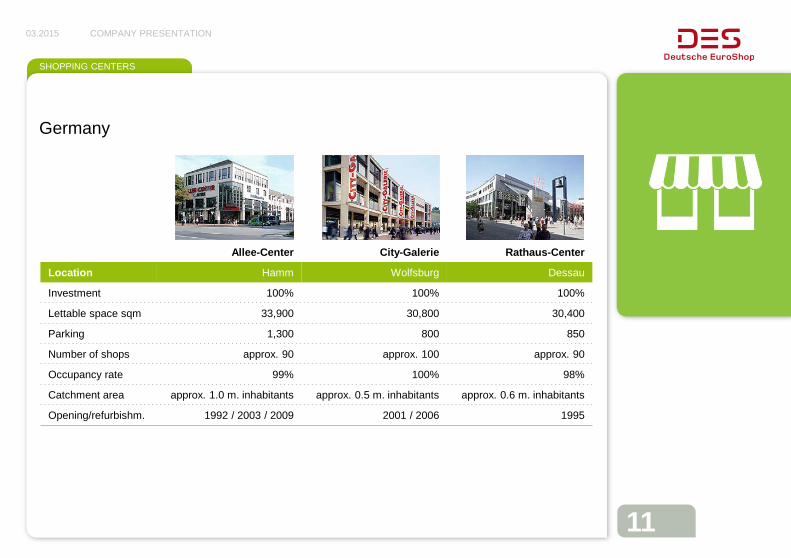
SHOPPING CENTERS
Allee-Center City-Galerie Rathaus-Center
Location Hamm Wolfsburg Dessau
Investment 100% 100% 100%
Lettable space sqm 33,900 30,800 30,400
Parking 1,300 800 850
Number of shops approx. 90 approx. 100 approx. 90
Occupancy rate 99% 100% 98%
Catchment area approx. 1.0 m. inhabitants approx. 0.5 m. inhabitants approx. 0.6 m. inhabitants
Opening/refurbishm. 1992 / 2003 / 2009 2001 / 2006 1995
Germany
03.2015 COMPANY PRESENTATION
12
SHOPPING CENTERS
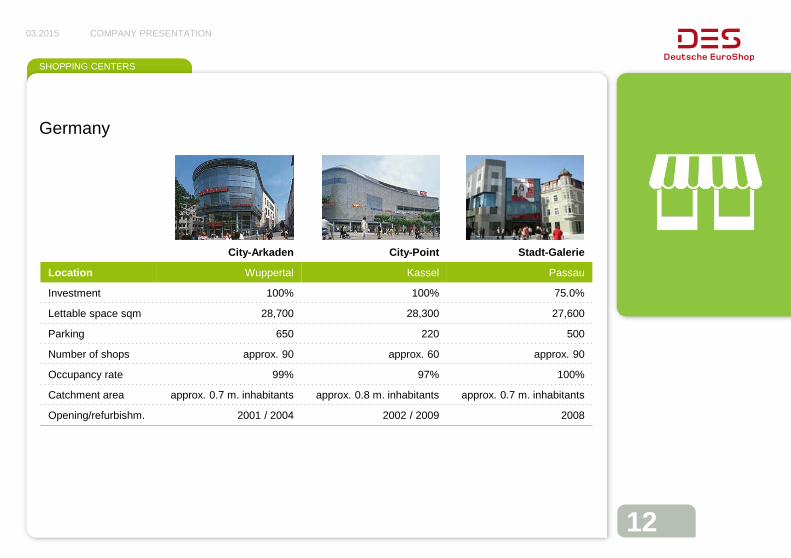
City-Arkaden City-Point Stadt-Galerie
Location Wuppertal Kassel Passau
Investment 100% 100% 75.0%
Lettable space sqm 28,700 28,300 27,600
Parking 650 220 500
Number of shops approx. 90 approx. 60 approx. 90
Occupancy rate 99% 97% 100%
Catchment area approx. 0.7 m. inhabitants approx. 0.8 m. inhabitants approx. 0.7 m. inhabitants
Opening/refurbishm. 2001 / 2004 2002 / 2009 2008
Germany
03.2015 COMPANY PRESENTATION
13
SHOPPING CENTERS
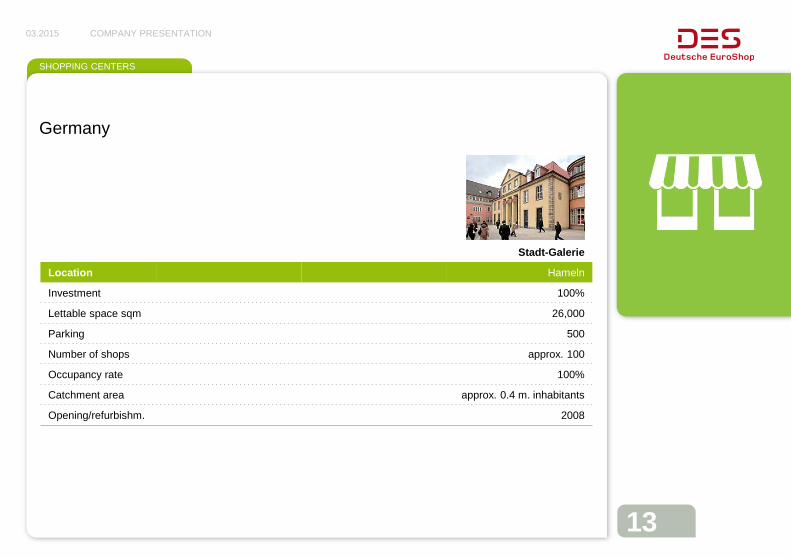
Stadt-Galerie
Location Hameln
Investment 100%
Lettable space sqm 26,000
Parking 500
Number of shops approx. 100
Occupancy rate 100%
Catchment area approx. 0.4 m. inhabitants
Opening/refurbishm. 2008

Europe
03.2015 COMPANY PRESENTATION
14
SHOPPING CENTERS
Galeria Bałtycka City Arkaden Árkád
Location Gdansk, Poland Klagenfurt, Austria Pécs, Hungary
Investment 74.0% 50.0% 50.0%
Lettable space sqm 48,700 36,900 35,400
Parking 1.050 880 850
Number of shops approx. 195 approx. 120 approx. 130
Occupancy rate 99% 100% 96%
Catchment area approx. 1.1 m. inhabitants approx. 0.4 m. inhabitants approx. 1.0 m. inhabitants
Opening/refurbishm. 2007 2006 2004
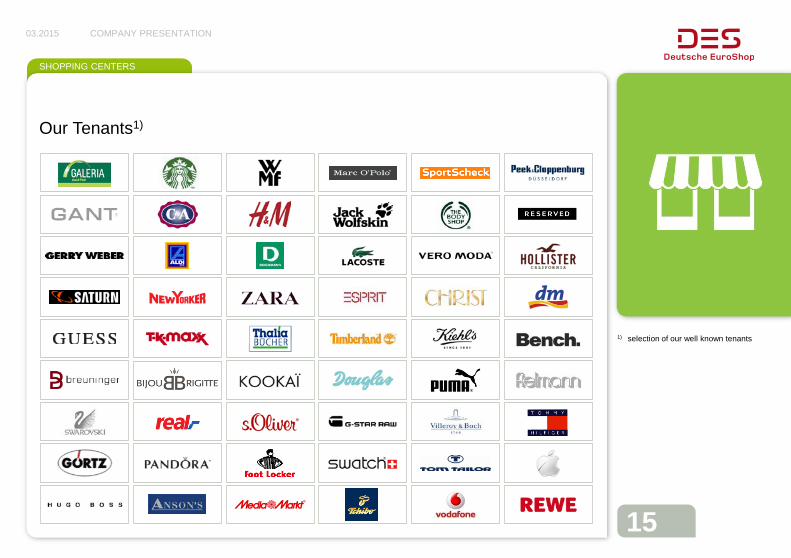
Our Tenants1)
03.2015 COMPANY PRESENTATION
15
SHOPPING CENTERS
1) selection of our well known tenants
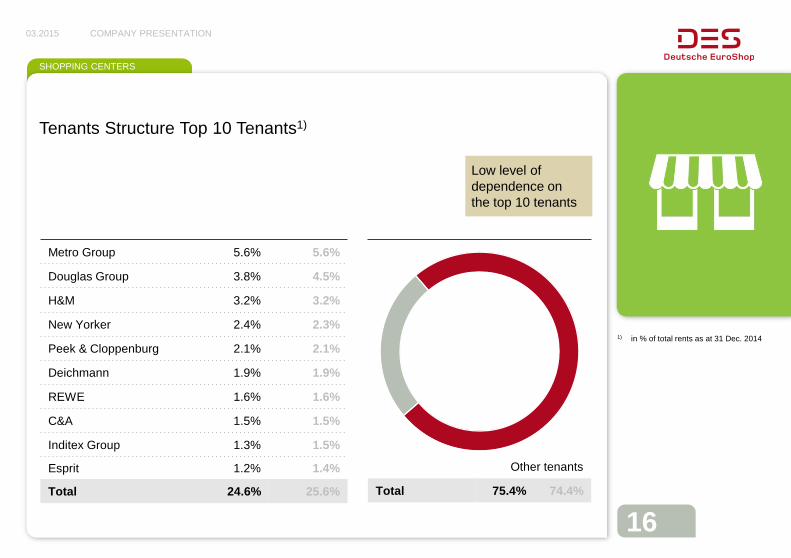
Tenants Structure Top 10 Tenants1)
03.2015 COMPANY PRESENTATION
16
SHOPPING CENTERS
1) in % of total rents as at 31 Dec. 2014
Low level of dependence on the top 10 tenants
Metro Group 5.6% 5.6%
Douglas Group 3.8% 4.5%
H&M 3.2% 3.2%
New Yorker 2.4% 2.3%
Peek & Cloppenburg 2.1% 2.1%
Deichmann 1.9% 1.9%
REWE 1.6% 1.6%
C&A 1.5% 1.5%
Inditex Group 1.3% 1.5%
Esprit 1.2% 1.4%
Total 24.6% 25.6%
Other tenants
Total 75.4% 74.4%
03.2015 COMPANY PRESENTATION
17
SHOPPING CENTERS
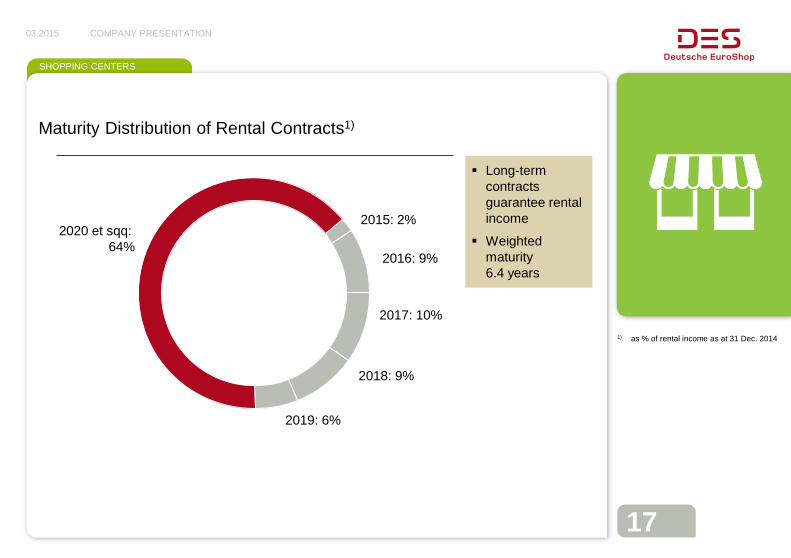
Maturity Distribution of Rental Contracts1)
1) as % of rental income as at 31 Dec. 2014
Long-term contracts guarantee rental income
Weighted maturity 6.4 years
2020 et sqq: 64%
2015: 2%
2016: 9%
2017: 10%
2018: 9%
2019: 6%
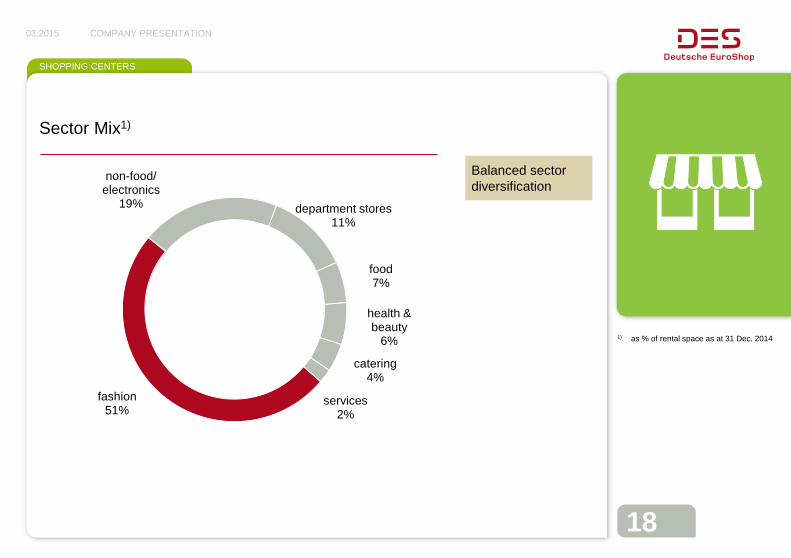
Sector Mix1)
03.2015 COMPANY PRESENTATION
18
SHOPPING CENTERS
Balanced sector diversification
fashion 51%
non-food/ electronics
19% department stores 11%
food 7%
health & beauty
6%
catering 4%
services 2%
1) as % of rental space as at 31 Dec. 2014
03.2015 COMPANY PRESENTATION
19
FINANCIALS
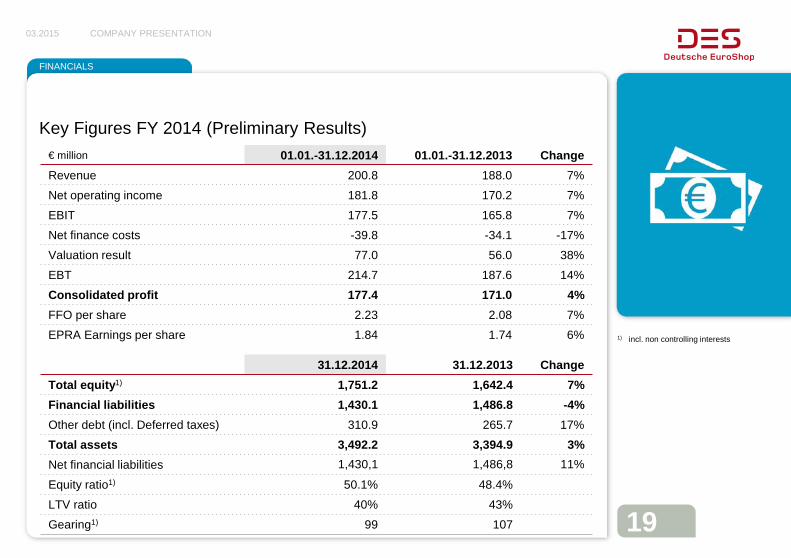
Key Figures FY 2014 (Preliminary Results)
1) incl. non controlling interests
€ million 01.01.-31.12.2014 01.01.-31.12.2013 Change Revenue 200.8 188.0 7%
Net operating income 181.8 170.2 7%
EBIT 177.5 165.8 7%
Net finance costs -39.8 -34.1 -17%
Valuation result 77.0 56.0 38%
EBT 214.7 187.6 14%
Consolidated profit 177.4 171.0 4% FFO per share 2.23 2.08 7%
EPRA Earnings per share 1.84 1.74 6%
€ million 31.12.2014 31.12.2013 Change Total equity1) 1,751.2 1,642.4 7% Financial liabilities 1,430.1 1,486.8 -4% Other debt (incl. Deferred taxes) 310.9 265.7 17%
Total assets 3,492.2 3,394.9 3% Net financial liabilities 1,430,1 1,486,8 11%
Equity ratio1) 50.1% 48.4%
LTV ratio 40% 43%
Gearing1) 99 107
03.2015 COMPANY PRESENTATION
20
FINANCIALS
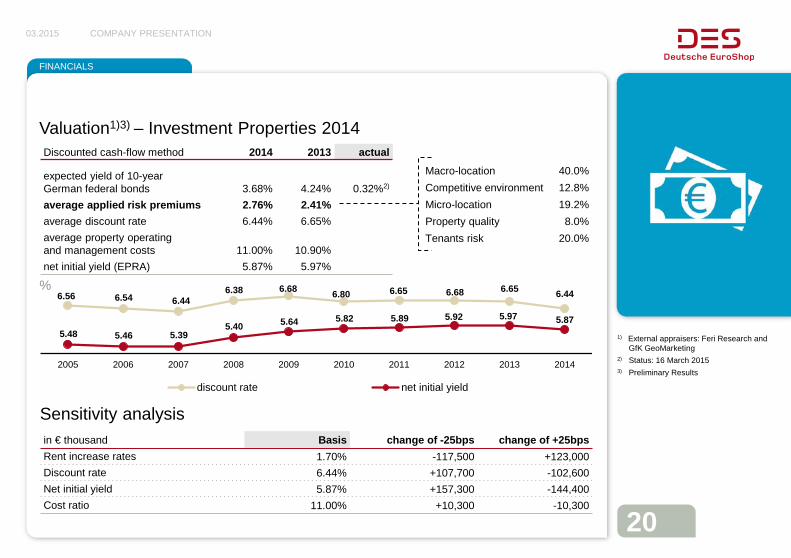
Valuation1)3) – Investment Properties 2014
1) External appraisers: Feri Research and GfK GeoMarketing
2) Status: 16 March 2015 3) Preliminary Results
Discounted cash-flow method 2014 2013 actual
expected yield of 10-year German federal bonds 3.68% 4.24% 0.32%2) average applied risk premiums 2.76% 2.41% average discount rate 6.44% 6.65% average property operating and management costs 11.00% 10.90% net initial yield (EPRA) 5.87% 5.97%
Macro-location 40.0% Competitive environment 12.8% Micro-location 19.2% Property quality 8.0% Tenants risk 20.0%
6.56 6.54 6.44 6.38 6.68 6.80 6.65 6.68 6.65 6.44
5.48 5.46 5.39 5.40 5.64 5.82 5.89 5.92 5.97 5.87
2005 2006 2007 2008 2009 2010 2011 2012 2013 2014
discount rate net initial yield
in € thousand Basis change of -25bps change of +25bps Rent increase rates 1.70% -117,500 +123,000 Discount rate 6.44% +107,700 -102,600 Net initial yield 5.87% +157,300 -144,400 Cost ratio 11.00% +10,300 -10,300
%
Sensitivity analysis
03.2015 COMPANY PRESENTATION
21
FINANCIALS
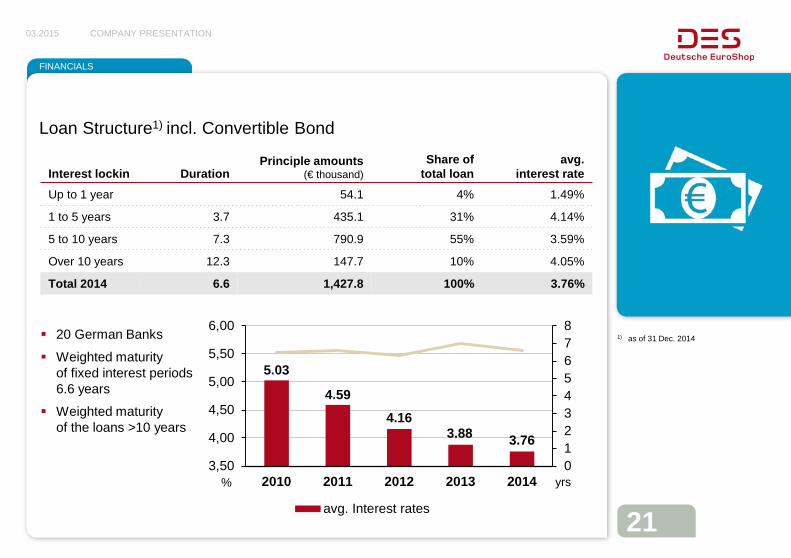
Loan Structure1) incl. Convertible Bond
1) as of 31 Dec. 2014
Interest lockin Duration Principle amounts
(€ thousand) Share of
total loan avg.
interest rate Up to 1 year 54.1 4% 1.49%
1 to 5 years 3.7 435.1 31% 4.14%
5 to 10 years 7.3 790.9 55% 3.59%
Over 10 years 12.3 147.7 10% 4.05%
Total 2014 6.6 1,427.8 100% 3.76%
20 German Banks
Weighted maturity of fixed interest periods 6.6 years
Weighted maturity of the loans >10 years
5.03
4.59 4.16
3.88 3.76
012345678
3,50
4,00
4,50
5,00
5,50
6,00
2010 2011 2012 2013 2014
avg. Interest rates
yrs %
03.2015 COMPANY PRESENTATION
22
FINANCIALS
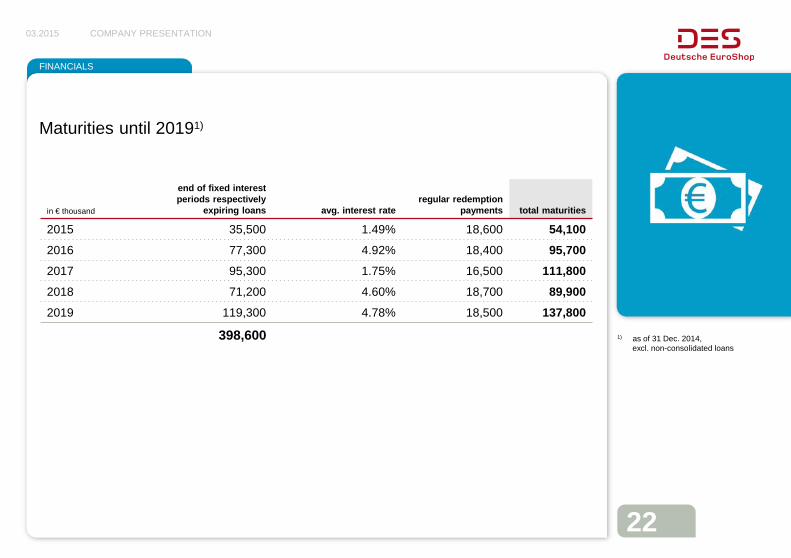
1) as of 31 Dec. 2014, excl. non-consolidated loans
Maturities until 20191)
in € thousand
end of fixed interest periods respectively
expiring loans avg. interest rate regular redemption
payments total maturities
2015 35,500 1.49% 18,600 54,100 2016 77,300 4.92% 18,400 95,700 2017 95,300 1.75% 16,500 111,800 2018 71,200 4.60% 18,700 89,900 2019 119,300 4.78% 18,500 137,800
398,600
03.2015 COMPANY PRESENTATION
23
FINANCIALS
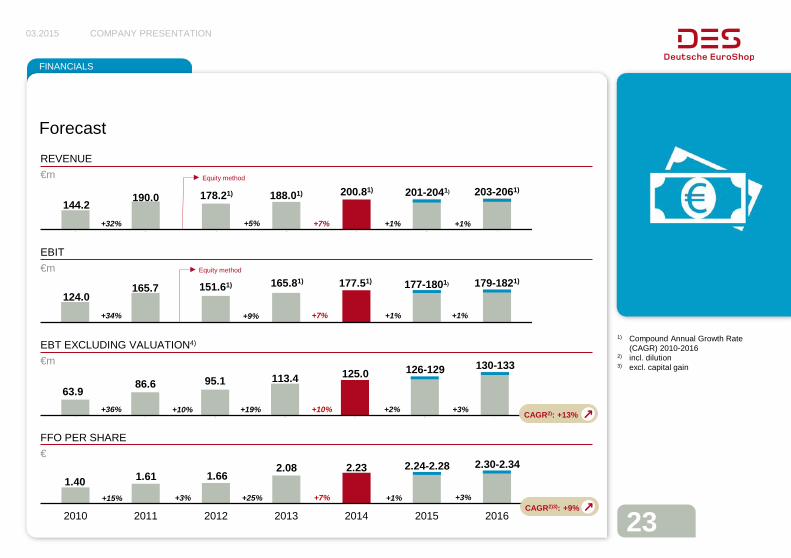
1) Compound Annual Growth Rate (CAGR) 2010-2016 2) incl. dilution 3) excl. capital gain
Forecast REVENUE €m
EBIT
€m
EBT EXCLUDING VALUATION4)
€m
FFO PER SHARE €
1.40 1.61 1.66 2.08 2.23
2010 2011 2012 2013 2014 2015 2016
63.9 86.6 95.1 113.4
1 2 3 4 5 6 7
124.0 165.7 151.61) 165.81) 177.51) 179-1821)
144.2 190.0 178.21) 188.01) 200.81) 203-2061)
1 2 3 4 5 6 7
+1%
+1%
+3%
+3%
+32%
+34%
+36%
+15%
+10%
+3%
+19%
+25%
+7%
+7%
+10%
+7%
201-2041)
177-1801)
125.0 126-129 130-133
2.24-2.28 2.30-2.34
Equity method
Equity method
CAGR2)3): +9%
CAGR2): +13%
+1% +5%
+9% +1%
+2%
+1%
03.2015 COMPANY PRESENTATION
24
SHOPPING CENTER SHARES
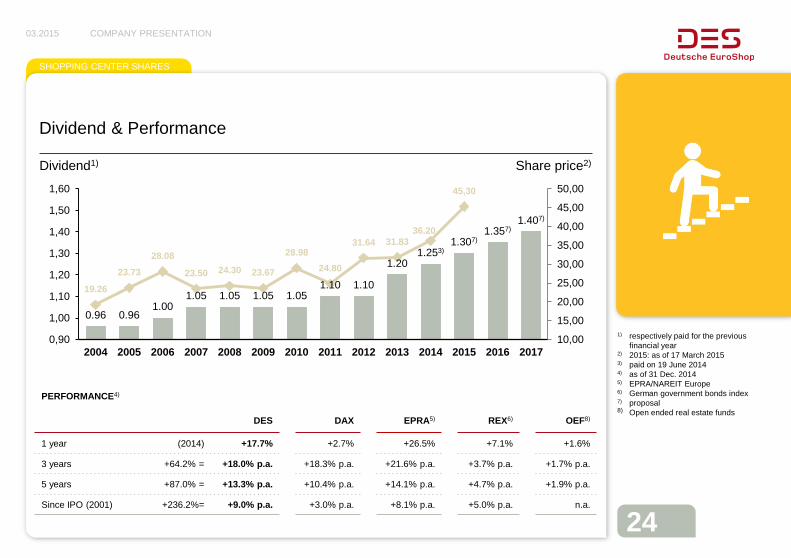
Dividend & Performance
1) respectively paid for the previous financial year 2) 2015: as of 17 March 2015 3) paid on 19 June 2014 4) as of 31 Dec. 2014 5) EPRA/NAREIT Europe 6) German government bonds index 7) proposal 8) Open ended real estate funds
Dividend1) Share price2)
0.96 0.96 1.00
1.05 1.05 1.05 1.05 1.10 1.10
1.20 1.253)
1.307) 1.357)
1.407)
19.26
23.73
28.08
23.50 24.30 23.67
28.98 24.80
31.64 31.83 36.20
45,30
10,00
15,00
20,00
25,00
30,00
35,00
40,00
45,00
50,00
0,90
1,00
1,10
1,20
1,30
1,40
1,50
1,60
2004 2005 2006 2007 2008 2009 2010 2011 2012 2013 2014 2015 2016 2017
PERFORMANCE4)
DES DAX EPRA5) REX6) OEF8)
1 year (2014) +17.7% +2.7% +26.5% +7.1% +1.6%
3 years +64.2% = +18.0% p.a. +18.3% p.a. +21.6% p.a. +3.7% p.a. +1.7% p.a.
5 years +87.0% = +13.3% p.a. +10.4% p.a. +14.1% p.a. +4.7% p.a. +1.9% p.a.
Since IPO (2001) +236.2%= +9.0% p.a. +3.0% p.a. +8.1% p.a. +5.0% p.a. n.a.
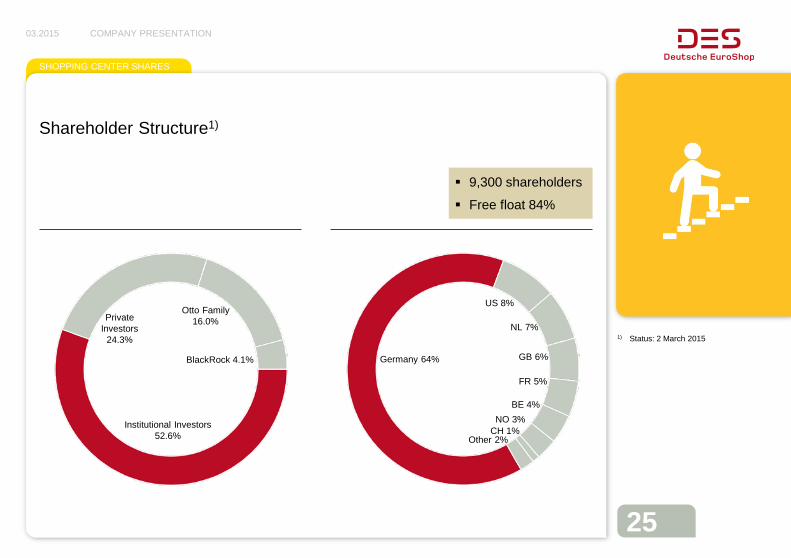
Shareholder Structure1)
03.2015 COMPANY PRESENTATION
25
SHOPPING CENTER SHARES
1) Status: 2 March 2015
9,300 shareholders
Free float 84%
Institutional Investors 52.6%
Private Investors
24.3%
Otto Family 16.0%
BlackRock 4.1%
US 8%
Germany 64%
NL 7%
BE 4%
GB 6%
FR 5%
Other 2%
NO 3% CH 1%
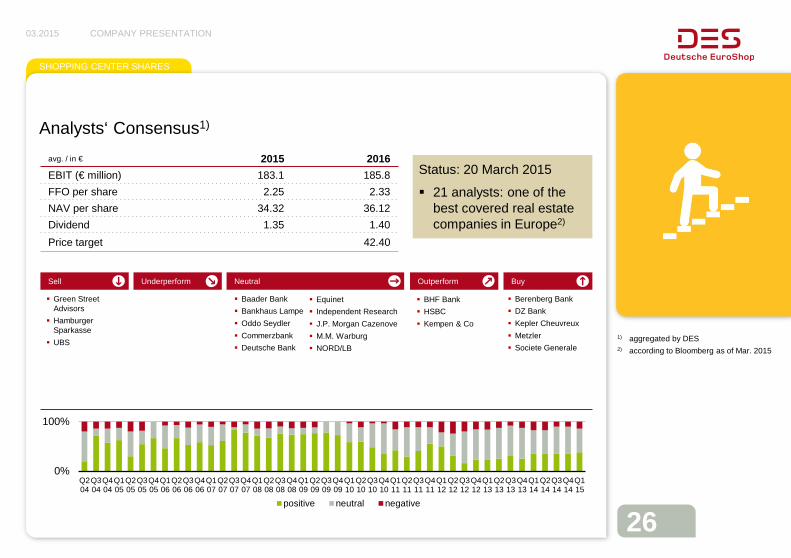
Analysts‘ Consensus1)
03.2015 COMPANY PRESENTATION
26
SHOPPING CENTER SHARES
1) aggregated by DES
2) according to Bloomberg as of Mar. 2015
avg. / in € 2015 2016 EBIT (€ million) 183.1 185.8 FFO per share 2.25 2.33 NAV per share 34.32 36.12 Dividend 1.35 1.40 Price target 42.40
Status: 20 March 2015
21 analysts: one of the best covered real estate companies in Europe2)
Sell Underperform Neutral Outperform Buy
Berenberg Bank DZ Bank Kepler Cheuvreux Metzler Societe Generale
Baader Bank Bankhaus Lampe Oddo Seydler Commerzbank Deutsche Bank
0%
100%
Q204
Q304
Q404
Q105
Q205
Q305
Q405
Q106
Q206
Q306
Q406
Q107
Q207
Q307
Q407
Q108
Q208
Q308
Q408
Q109
Q209
Q309
Q409
Q110
Q210
Q310
Q410
Q111
Q211
Q311
Q411
Q112
Q212
Q312
Q412
Q113
Q213
Q313
Q413
Q114
Q214
Q314
Q414
Q115
positive neutral negative
Equinet Independent Research J.P. Morgan Cazenove M.M. Warburg NORD/LB
Green Street Advisors
Hamburger Sparkasse
UBS
BHF Bank HSBC Kempen & Co
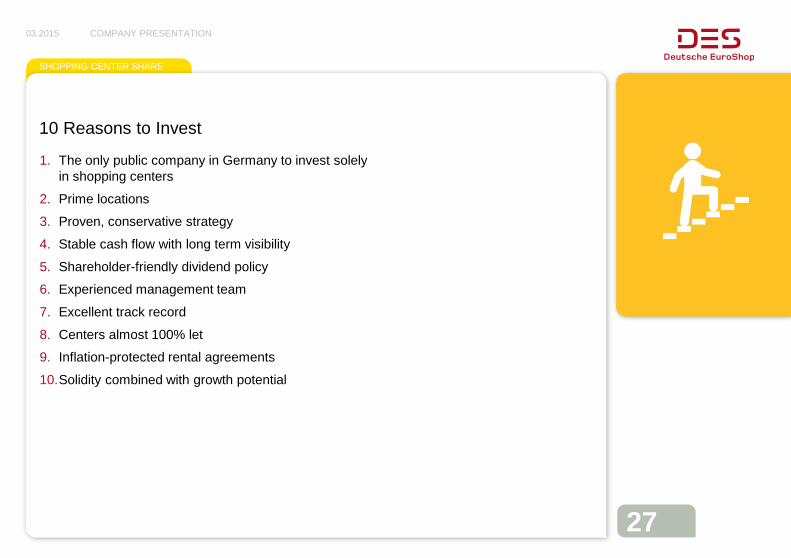
10 Reasons to Invest
1. The only public company in Germany to invest solely in shopping centers
2. Prime locations
3. Proven, conservative strategy
4. Stable cash flow with long term visibility
5. Shareholder-friendly dividend policy
6. Experienced management team
7. Excellent track record
8. Centers almost 100% let
9. Inflation-protected rental agreements
10.Solidity combined with growth potential
03.2015 COMPANY PRESENTATION
27
SHOPPING CENTER SHARE
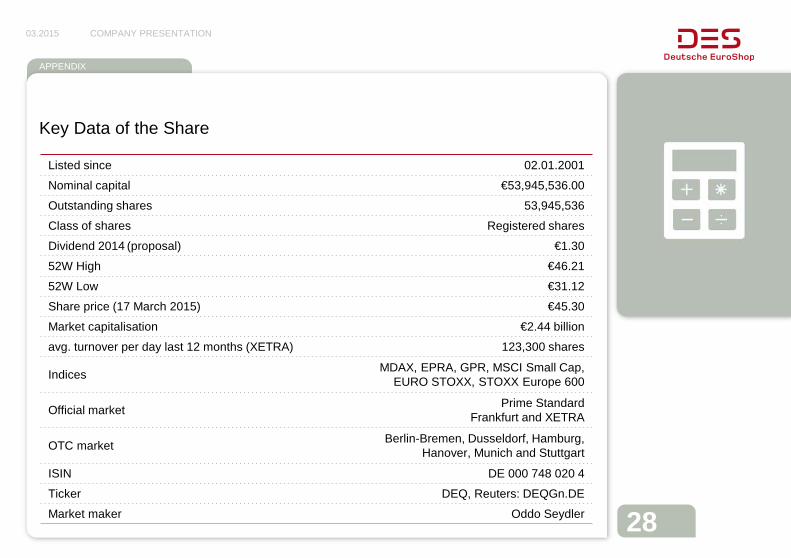
Listed since 02.01.2001
Nominal capital €53,945,536.00
Outstanding shares 53,945,536
Class of shares Registered shares
Dividend 2014 (proposal) €1.30
52W High €46.21
52W Low €31.12
Share price (17 March 2015) €45.30
Market capitalisation €2.44 billion
avg. turnover per day last 12 months (XETRA) 123,300 shares
Indices MDAX, EPRA, GPR, MSCI Small Cap, EURO STOXX, STOXX Europe 600
Official market Prime Standard Frankfurt and XETRA
OTC market Berlin-Bremen, Dusseldorf, Hamburg, Hanover, Munich and Stuttgart
ISIN DE 000 748 020 4
Ticker DEQ, Reuters: DEQGn.DE
Market maker Oddo Seydler
Key Data of the Share
03.2015 COMPANY PRESENTATION
28
APPENDIX
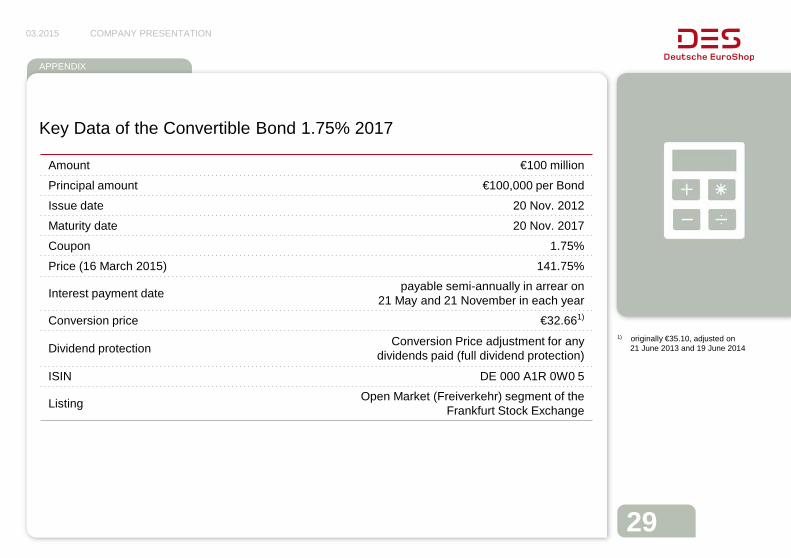
Amount €100 million
Principal amount €100,000 per Bond
Issue date 20 Nov. 2012
Maturity date 20 Nov. 2017
Coupon 1.75%
Price (16 March 2015) 141.75%
Interest payment date payable semi-annually in arrear on 21 May and 21 November in each year
Conversion price €32.661)
Dividend protection Conversion Price adjustment for any dividends paid (full dividend protection)
ISIN DE 000 A1R 0W0 5
Listing Open Market (Freiverkehr) segment of the Frankfurt Stock Exchange
Key Data of the Convertible Bond 1.75% 2017
03.2015 COMPANY PRESENTATION
29
APPENDIX
1) originally €35.10, adjusted on 21 June 2013 and 19 June 2014

03.2015 COMPANY PRESENTATION
30
APPENDIX
30
Retail turnover 2014*
* German centers on a like-for-like basis (turnover: €2.0 billion)
Retail sector % change
in 2014 rent-to-sales
ratio in % % of
sales % of
space
Department stores -2.6 5.8 7.6 13.1
Food -0.7 7.3 9.1 6.2
Fashion textiles -1.5 12.0 29.5 39.1
Shoes & leather goods -0.2 14.0 5.5 6.4
Sports 0.2 8.7 4.0 4.6
Health & Beauty 2.4 7.2 11.6 6.1
General Retail -1.2 10.0 11.8 11.1
Electronics -1.2 3.0 11.9 7.7
Services 2.9 4.5 4.7 1.6
Food catering -1.0 13.2 4.3 4.1
Total -0.7 8.9 100.0 100.0
retail turnover development abroad on a like-for-like basis: -0.4% DES-Portfolio overall: -0.6%
absolute turnover development: Germany +0.3%, Abroad +0.2% DES-Portfolio overall: +0.3%
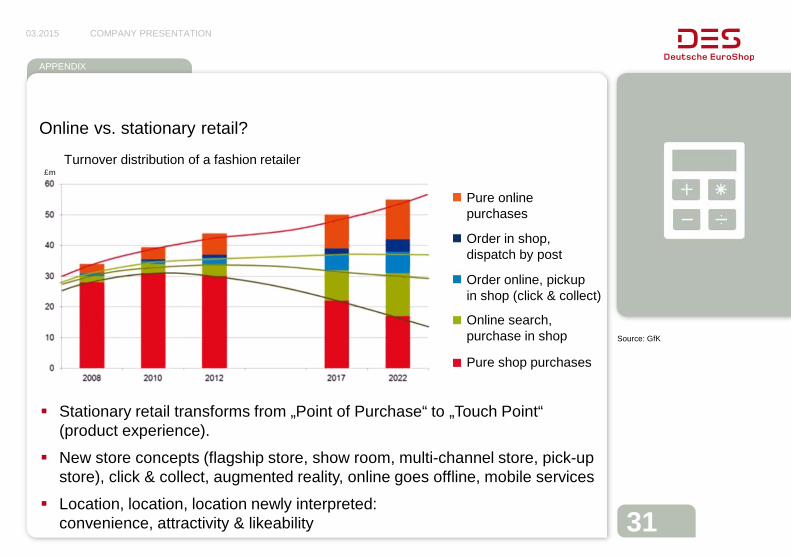
Online vs. stationary retail?
03.2015 COMPANY PRESENTATION
31
APPENDIX
Source: GfK
Pure online purchases
Order in shop, dispatch by post
Order online, pickup in shop (click & collect)
Online search, purchase in shop
Pure shop purchases
Stationary retail transforms from „Point of Purchase“ to „Touch Point“ (product experience).
New store concepts (flagship store, show room, multi-channel store, pick-up store), click & collect, augmented reality, online goes offline, mobile services
Location, location, location newly interpreted: convenience, attractivity & likeability
Turnover distribution of a fashion retailer £m
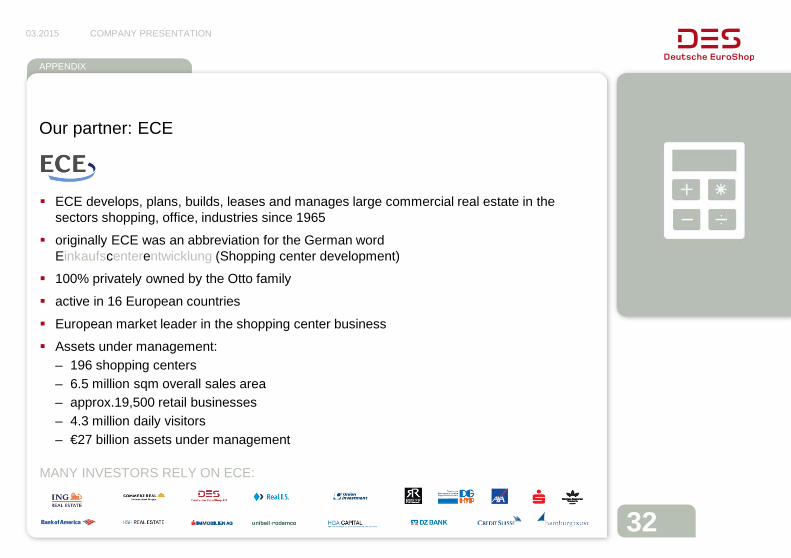
Our partner: ECE
ECE develops, plans, builds, leases and manages large commercial real estate in the sectors shopping, office, industries since 1965
originally ECE was an abbreviation for the German word Einkaufscenterentwicklung (Shopping center development)
100% privately owned by the Otto family
active in 16 European countries
European market leader in the shopping center business
Assets under management: – 196 shopping centers – 6.5 million sqm overall sales area – approx.19,500 retail businesses – 4.3 million daily visitors – €27 billion assets under management
MANY INVESTORS RELY ON ECE:
03.2015 COMPANY PRESENTATION
32
APPENDIX
Environment
Climate protection is one of the most important issues for Deutsche EuroShop. We believe that sustainability and profitability, the shopping experience and environmental awareness are not opposing forces. Long-term thinking is part of our strategy. This includes playing our part in environmental protection.
In 2013, all our German shopping centers had contracts with suppliers that use regenerative energy sources such as hydroelectric power for their electricity needs. The “EnergieVision” organisation certified the green electricity for our centers in Germany with the renowned “ok-power” accreditation in 2013. We plan to switch the centers in other countries to green electricity as well in the next few years.
The German centers used a total of around 67.4 million kWh of green electricity in 2013. This represented 100% of the electricity requirements in these shopping centers. As a result, based on conservative calculations this meant a reduction of around 22,500 tonnes in carbon dioxide emissions – this equates to the annual CO2 emissions of around 1,020 two-person households. We have already reduced the energy consumption of our shopping centers by using heat exchangers and energy-saving light bulbs.
Deutsche EuroShop, through its shopping centers, also supports a range of activities at local and regional level in the areas of ecology, society and economy.
03.2015 COMPANY PRESENTATION
33
APPENDIX
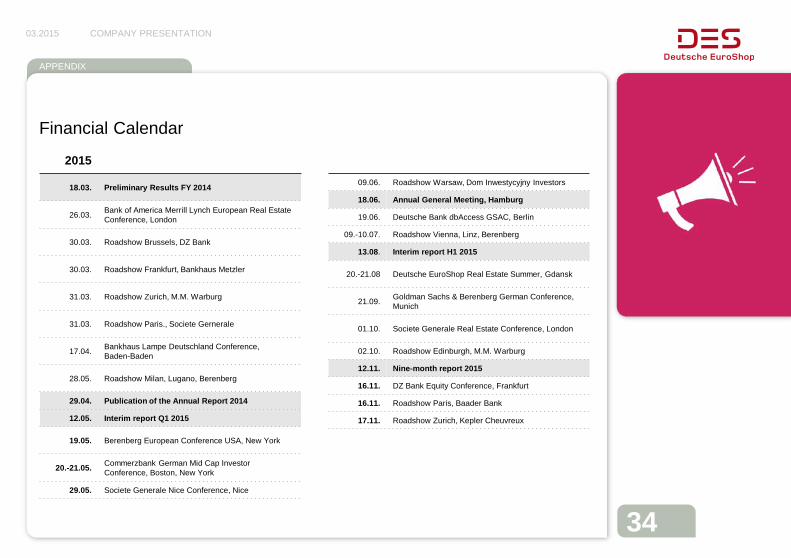
Financial Calendar
03.2015 COMPANY PRESENTATION
34
APPENDIX
2015
18.03. Preliminary Results FY 2014
26.03. Bank of America Merrill Lynch European Real Estate Conference, London
30.03. Roadshow Brussels, DZ Bank
30.03. Roadshow Frankfurt, Bankhaus Metzler
31.03. Roadshow Zurich, M.M. Warburg
31.03. Roadshow Paris., Societe Gernerale
17.04. Bankhaus Lampe Deutschland Conference, Baden-Baden
28.05. Roadshow Milan, Lugano, Berenberg
29.04. Publication of the Annual Report 2014
12.05. Interim report Q1 2015
19.05. Berenberg European Conference USA, New York
20.-21.05. Commerzbank German Mid Cap Investor Conference, Boston, New York
29.05. Societe Generale Nice Conference, Nice
09.06. Roadshow Warsaw, Dom Inwestycyjny Investors
18.06. Annual General Meeting, Hamburg
19.06. Deutsche Bank dbAccess GSAC, Berlin
09.-10.07. Roadshow Vienna, Linz, Berenberg
13.08. Interim report H1 2015
20.-21.08 Deutsche EuroShop Real Estate Summer, Gdansk
21.09. Goldman Sachs & Berenberg German Conference, Munich
01.10. Societe Generale Real Estate Conference, London
02.10. Roadshow Edinburgh, M.M. Warburg
12.11. Nine-month report 2015
16.11. DZ Bank Equity Conference, Frankfurt
16.11. Roadshow Paris, Baader Bank
17.11. Roadshow Zurich, Kepler Cheuvreux
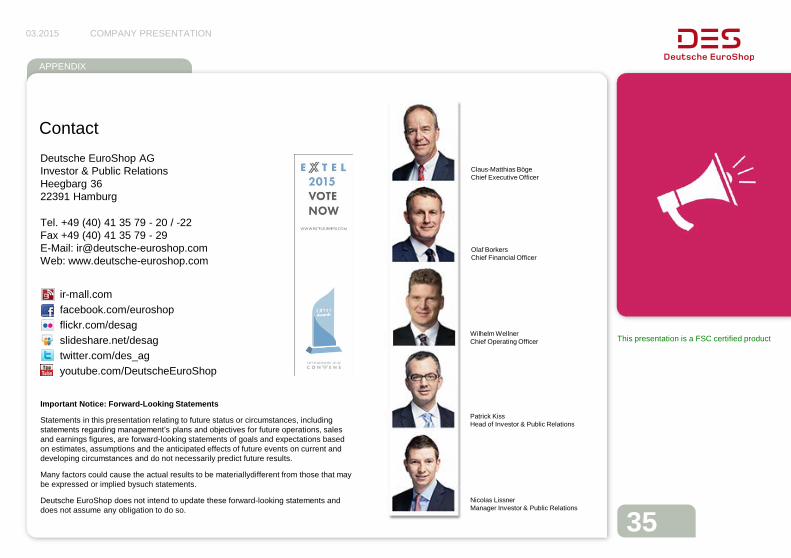
Contact
03.2015 COMPANY PRESENTATION
35
APPENDIX
This presentation is a FSC certified product
Deutsche EuroShop AG Investor & Public Relations Heegbarg 36 22391 Hamburg
Tel. +49 (40) 41 35 79 - 20 / -22 Fax +49 (40) 41 35 79 - 29 E-Mail: [email protected] Web: www.deutsche-euroshop.com
Important Notice: Forward-Looking Statements
Statements in this presentation relating to future status or circumstances, including statements regarding management’s plans and objectives for future operations, sales and earnings figures, are forward-looking statements of goals and expectations based on estimates, assumptions and the anticipated effects of future events on current and developing circumstances and do not necessarily predict future results.
Many factors could cause the actual results to be materiallydifferent from those that may be expressed or implied bysuch statements.
Deutsche EuroShop does not intend to update these forward-looking statements and does not assume any obligation to do so.
ir-mall.com facebook.com/euroshop flickr.com/desag slideshare.net/desag twitter.com/des_ag youtube.com/DeutscheEuroShop
Patrick Kiss Head of Investor & Public Relations
Nicolas Lissner Manager Investor & Public Relations
Claus-Matthias Böge Chief Executive Officer
Olaf Borkers Chief Financial Officer
Wilhelm Wellner Chief Operating Officer