Embed Size (px)
Citation preview

InfraREIT, Inc.Q3 2016 Results & Supplemental Information
November 3, 2016

Safe Harbor
Forward Looking StatementsThese presentations contain “forward-looking statements” about the business, financial performance, contracts, leases and prospects of InfraREIT, Inc. (the Company).
Words such as “could,” “will,” “may,” “assume,” “forecast,” “position,” “predict,” “strategy,” “guidance,” “outlook,” “target,” “expect,” “intend,” “plan,” “estimate,” “anticipate,”
“believe,” “project,” “budget,” “potential” or “continue” and similar expressions are used to identify forward-looking statements, although not all forward-looking statements
contain such identifying words. These forward-looking statements are based on management’s current expectations and assumptions about future events and are based on
currently available information as to the outcome and timing of future events. The Company’s actual results, performance or achievements could differ materially from those
expressed or implied by any forward-looking statements made in connection with this presentation. The Company’s capabilities or performance, stockholder value as well
as any other statements that are not historical facts in this presentation are forward-looking statements that involve certain risks and uncertainties, many of which are difficult
to predict and beyond the Company’s control. Factors that could cause actual results to differ materially from the results contemplated by such forward-looking statements
include, without limitation, decisions by regulators or changes in governmental policies or regulations with respect to the Company’s organizational structure, lease
arrangements, capitalization, acquisitions and dispositions of assets, recovery of investments, authorized rate of return and other regulatory parameters; the Company’s
current reliance on its tenant for all of its revenues and, as a result, the Company’s dependency on its tenant’s solvency and financial and operating performance; risks that
the capital expenditures the Company expects will not materialize for a variety of reasons; risks related to future lease negotiations or non-renewal of leases with the
Company’s tenant; insufficient cash available to meet distribution requirements; the Company’s ability to make strategic acqu isitions that add to its rate base; the price and
availability of debt and equity financing; the Company’s level of indebtedness or debt service obligations; cyber breaches, weather conditions or other natural phenomena;
the effects of existing and future tax and other laws and governmental regulations; the Company’s failure to qualify or maintain its status as a real estate investment trust
(REIT) or changes in the tax laws applicable to REITs; the termination of the Company’s management agreement or the loss of the services of the Company’s manager or
other qualified personnel; and adverse economic developments in the electric power industry or in business conditions general ly, particularly in Texas. When considering
forward-looking statements, you should keep in mind the risk factors and other cautionary statements described under the heading “Risk Factors” included in the Company’s
filings with the U.S. Securities and Exchange Commission. Should one or more of these risks or uncertainties materialize, or should underlying assumptions prove incorrect,
actual results may vary materially from those indicated. Forward-looking statements speak only as of the date made and reaffirmed, and the Company disclaims any
obligation to update or revise any forward-looking statements, whether as a result of new information, future events or otherwise, except as required by law.
Non-GAAP LegendThis presentation contains certain financial measures that are not recognized under generally accepted accounting principles (GAAP). InfraREIT’s management uses non-
GAAP measures as important supplemental measures of its operating performance. For example, management uses the cash available for distribution (CAD)
measurement when recommending dividends to its Board of Directors. These non-GAAP measures are also presented because management believes they help investors
understand InfraREIT’s business, performance and ability to earn and distribute cash to its stockholders by providing perspec tives not immediately apparent from net
income. InfraREIT has a diverse set of investors, including investors that primarily focus on utilities, yieldcos, MLPs or REITs. Management believes that each of these
different classes of investors focus on different types of metrics in their evaluation of InfraREIT. For instance, many util ity investors focus on earnings per share (EPS) and
management believes its presentation of non-GAAP earnings per share (Non-GAAP EPS) enables a better comparison to other utilities. Management believes it is
appropriate to calculate and provide these measures in order to be responsive to these investors. Including the reporting on these measures in InfraREIT’s public
disclosures also ensures that this information is available to all of InfraREIT’s investors. The presentation of Non-GAAP EPS; CAD; net income (loss) before interest
expense, net, income tax expense, depreciation and amortization (EBITDA); Adjusted EBITDA; funds from operations (FFO); and adjusted FFO (AFFO) in this presentation
are not intended to be considered in isolation or as a substitute for, or superior to, the financial information prepared and presented in accordance with GAAP. In addition,
InfraREIT’s method of calculating these measures may be different from methods used by other companies, and, accordingly, may not be comparable to similar measures
as calculated by other companies that do not use the same methodology as InfraREIT. Reconciliations of these measures to their most directly comparable GAAP
measures are included in Schedules 1-5 to this presentation.
2

Q3 2016 Highlights
Solid Q3 2016 performance; in line with expectations
Increase in lease revenue and net income
Increase in Non-GAAP EPS, CAD and Adjusted EBITDA
$56.6 million of capital expenditures (accrual basis)
Rate case progressed with issuance of a Preliminary Order
Hunt Projects update
Southline Transmission project
• Discussions continue with open solicitation participants
• Filed application with the Arizona Corporation Commission for a Certificate of Environmental
Compatibility (CEC) in October 2016
Verde Transmission project
• Bureau of Land Management (BLM) published the Notice of Intent (NOI) to prepare an
Environmental Impact Study (EIS) in the Federal Register in October 2016
3

1.02
1.19
1.35
1.63
1.871.95 1.98 1.96
2011 2012 2013 2014 2015 Q1 2016 Q2 2016 Q3 2016
Millions barrels (bbls) / day
Permian Region Total Oil Production
4
Change in Annual Average
bbls/day 2010-2015
2011 vs. 2010 10.1%
2012 vs. 2011 16.7%
2013 vs. 2012 13.8%
2014 vs. 2013 20.5%
2015 vs. 2014 14.9%
Change in Quarterly
Average bbls/day 2015-2016
Q2 15 vs. Q1 15 5.7%
Q3 15 vs. Q2 15 0.2%
Q4 15 vs. Q3 15 0.3%
Q1 16 vs. Q4 15 2.7%
Q2 16 vs. Q1 16 1.3%
Q3 16 vs. Q2 16 -1.0%
Source: U.S. EIA Monthly Drilling Productivity Report for the Permian Basin

Permian Basin Rig Deployment By County
5Source: Baker Hughes, North American Rotary Rig Count
As of 9/26/2014
(33) (45) (22) (1) (2)
(4) (1)(4) (1)
(15) (39) (41) (2)
(1)(16)(29)(33)
As of 9/30/2016
(1) (17) (11) (1) (3)
(0) (1) (2) (1)
(2) (31) (10) (1)
(0)(2)(7)(11)
As of 9/25/2015
(11) (21) (9) (2) (1)
(0) (1)(3) (1)
(3) (29) (16) (0)
(0)(3)(14)(12)

System
Peak Load
(MW)
Annual
Change
2011 230
2012 259 12.6%
2013 296 14.3%
2014 341 15.2%
2015 392 15.0%
2016 YTD (1) 426 8.7%
230
259
296
341
392
426
0 MW
100 MW
200 MW
300 MW
400 MW
2011 2012 2013 2014 2015 2016
2011-2016 Sharyland System Peak Load
System Coincident Peak Load (MW)
6
System Coincident Peak Load (MW)
Source: Sharyland Utilities
(1) 2016 System Coincident Peak occurred on Aug. 8, 2016

2011-2016 Sharyland Distribution Volume Trends
7
Total Distribution GWh (1)
1,240
1,487
1,823
2,148
2,421
1,7991,915
2011 2012 2013 2014 2015 2015Q1-Q3
2016Q1-Q3
19.9%
6.5%
22.6%
17.9%
12.7%
Source: Sharyland Utilities
(1) Reflects total distribution volumes adjusted for cancel/rebills and normalized weather for 2014-2016. These adjustments
netted to a < 2% downward adjustment to 2016 volumes and a < 1% upward adjustment to 2014 and 2015 volumes.

Sharyland Distribution:
Residential And Industrial Trends
8Source: Sharyland Utilities
(1) Change in net residential customers – end of the period vs. beginning of the period.
(2) Change in total billed KW for Primary and Large Secondary (>10 kW) rate classes
Growth in Residential Customers (1)
Growth in Industrial and Large
Business Customer Demand, KW (2)Period
% Growth Over
Prior Quarter/Year
Q1 2015 1.6%
Q2 2015 1.2%
Q3 2015 1.6%
Q4 2015 1.5%
2015 6.0%
Q1 2016 0.3%
Q2 2016 0.8%
Q3 2016 1.7%
Q3 2016 vs.
Q3 20154.3%
Period
% Growth
Over
Prior Year
2015 vs 2014 23.8%
Q1 2016 vs Q1 2015 16.9%
Q2 2016 vs Q2 2015 25.4%
Q3 2016 vs Q3 2015 19.7%
Q1-Q3 2016 vs Q1-Q3 2015 20.7%

208 208
1,278
2,6723,172 3,172 3,172
8991,672
2,321248
2,091
4,094
208 MW 208 MW
1,278 MW
2,672 MW
4,319 MW
6,935 MW
9,587 MW
0 MW
2,000 MW
4,000 MW
6,000 MW
8,000 MW
10,000 MW
2012 2013 2014 2015 2016 2017 2018
Cumulative MW Installed IA Signed - Financial Security Posted IA Signed - No Financial Security
Interconnections Agreements For Panhandle Wind
Generation
9 Source: ERCOT – Seasonal Assessment of Resource Adequacy (Fall 2016) and Generation Interconnection Status Report (Sept. 2016)

Pipeline of Hunt Projects
10
NV
CA
OK
TX
AZNM
MEXICO
Additional U.S. –
Mexico DC Ties
Additional South Texas
Transmission / Generation
Interconnections
South Plains
Reinforcement
Southline
Transmission
Project
Verde Transmission
Project
Cross Valley
Transmission Line
Golden Spread Electric
Cooperative (GSEC)
Interconnection
Lubbock Power & Light
Interconnection
Under Development
Operational; Owned by
Sharyland Utilities, L.P.

Filed with the PUCT on April 29, 2016 under Docket No. 45414
PUCT approved a preliminary order in October 2016 that requires Sharyland and
Sharyland Distribution & Transmission Services, L.L.C. (SDTS) to:
File amended rate filing packages no later than January 1, 2017;
Amend the rate case application to request PUCT approval of a tariff establishing terms and
conditions for the leases between Sharyland and SDTS; and
Amend the rate case application to request the PUCT to issue SDTS its own certificate of
convenience and necessity (CCN)
We expect other issues to be addressed and resolved during the subsequent phase of
the rate case, including:
Approval of leases that comply with PURA and meet with “true lease” requirements
Methodology for regulating the leases and updating lease payments to account for new assets
placed in service
Approval of a CCN for SDTS
All other economic issues, including the allowed return on equity, capital structure, income tax
allowance and cost of debt
Pending Rate Case
11

Q3 2016 Performance Summary$ millions, except per share amounts
12
Strong growth in lease revenue and net income, in line with expectations
Net Income Attributable to InfraREIT, Inc.
Common Stockholders Per Share
$0.32
$0.39
Q3 2015 Q3 2016
Lease Revenue
$41.5
$49.4
Q3 2015 Q3 2016
+19%
Net Income
$19.4
$23.6
Q3 2015 Q3 2016
+22%
+22%

Q3 2016 Performance Summary$ millions, except per share amounts
13
Strong growth in adjusted EBITDA, in line with expectations. CAD and Non-GAAP EPS also in
line with expectations, reflecting impact of higher interest expense and depreciation
Cash Available for Distribution
$17.1$19.4
Q3 2015 Q3 2016
Non-GAAP EPS
$0.28$0.32
Q3 2015 Q3 2016
Adjusted EBITDA
$33.5
$39.7
Q3 2015 Q3 2016
+19%
+14% +13%

September YTD 2016 Performance Summary$ millions, except per share amounts
14
YTD performance of lease revenue and net income in line with expectations
Net Income (Loss) Attributable to InfraREIT, Inc.
Common Stockholders Per Share
-$0.15
$0.69
YTD 2015 YTD 2016
Lease Revenue
$100.3$116.9
YTD 2015 YTD 2016
+17%
Net Income (Loss)
-$7.6
$41.6
YTD 2015 YTD 2016

September YTD 2016 Performance Summary$ millions, except per share amounts
15
Increase in Adjusted EBITDA, CAD and Non-GAAP EPS in line with expectations, reflecting
impact of higher interest expense and depreciation
Cash Available for Distribution
$53.6$57.0
YTD 2015 YTD 2016
Non-GAAP EPS (1)
$0.90 $0.93
YTD 2015 YTD 2016
Adjusted EBITDA
$101.8
$115.6
YTD 2015 YTD 2016
+14%
+6%
(1) Non-GAAP EPS for the nine months ended September 30, 2016 was based on 60.6 million weighted average shares outstanding compared to 58.8 million weighted average
shares outstanding during the same period of 2015.
+3%

Summary Income StatementQ3 2016 vs. Q3 2015
16
Net income increased in Q3 2016 based on an increase in lease revenue, offset by
increased depreciation and interest expense
($ thousands) Q3 2016 Q3 2015 % Change
Lease revenue $ 49,419 $ 41,452 19%
G&A expense (5,336) (5,504) —
Depreciation (11,828) (10,259) 15%
Income from operations 32,255 25,689 —
Interest expense, net (9,379) (6,723) 40%
Other income, net 1,024 707 —
Income tax expense (299) (243) —
Net income $ 23,601 $ 19,430 22%

Summary Income StatementSeptember YTD 2016 vs. September YTD 2015
17
Net income increased YTD 2016 based on an increase in lease revenue and a decrease
in G&A due to a lack of IPO related expenses, partially offset by increased depreciation
and interest expense
($ thousands) YTD 2016 YTD 2015 % Change
Lease revenue $ 116,869 $ 100,282 17%
G&A expense (15,861) (58,965) —
Depreciation (34,312) (29,438) 17%
Income (loss) from operations 66,696 (11,879) —
Interest expense, net (27,276) (21,084) 29%
Other income, net 2,920 2,180 —
Income tax expense (778) (575) —
Net income (loss) $ 41,562 $ (7,600) —

Non-GAAP EPSQ3 2016 vs. Q3 2015
18
Non-GAAP EPS increased 14%, reflecting net income drivers
($ thousands, except per share amounts)
Q3 2016
Amount Per Share
Q3 2015
Amount Per Share
Net income attributable to InfraREIT, Inc. $ 17,041 $ 0.39 $ 13,972 $ 0.32
Net income attributable to noncontrolling
interest 6,560 0.39 5,458 0.32
Net income 23,601 0.39 19,430 0.32
Non-cash reorganization structuring fee — — — —
Reorganization expenses — — — —
Percentage rent adjustment (2,998) (0.05) (2,791) (0.05)
Base rent adjustment (1,396) (0.02) 338 0.01
Non-GAAP net income (1) $ 19,207 $ 0.32 $ 16,977 $ 0.28
(1) Non-GAAP EPS for the quarters ended September 30, 2016 and 2015 was based on 60.6 million weighted average shares outstanding.

Non-GAAP EPSSeptember YTD 2016 vs. September YTD 2015
19
Non-GAAP EPS increased 3%, reflecting net income drivers and higher
weighted average shares outstanding during 2016 due to the timing of InfraREIT’s IPO
($ thousands, except per share amounts)
YTD 2016
Amount Per Share
YTD 2015
Amount Per Share
Net income (loss) attributable to InfraREIT, Inc. $ 29,964 $ 0.69 $ (6,539) $ (0.15)
Net income (loss) attributable to noncontrolling
interest 11,598 0.68 (1,061) (0.07)
Net income (loss) 41,562 0.69 (7,600) (0.13)
Non-cash reorganization structuring fee — — 44,897 0.76
Reorganization expenses — — 333 0.01
Percentage rent adjustment 10,038 0.16 9,768 0.17
Base rent adjustment 4,602 0.08 5,469 0.09
Non-GAAP net income (1) $ 56,202 $ 0.93 $ 52,867 $ 0.90
(1) Non-GAAP EPS for the nine months ended September 30, 2016 was based on 60.6 million weighted average shares outstanding compared to 58.8 million weighted average shares
outstanding during the same period of 2015.

Cash Available For DistributionQ3 2016 vs. Q3 2015
20
CAD increased 13% for the quarter, reflecting growth in lease revenue
($ thousands) Q3 2016 Q3 2015
Increase
$ %
Net income $ 23,601 $ 19,430
Depreciation 11,828 10,259
Non-cash reorganization structuring fee — —
Percentage rent adjustment (2,998) (2,791)
Base rent adjustment (1,396) 338
Amortization of deferred financing costs 1,003 612
Reorganization expenses — —
Non-cash equity compensation 230 185
Other income, net (1,024) (707)
Capital expenditures to maintain net assets (11,828) (10,259)
Cash Available For Distribution (CAD) $ 19,416 $ 17,067 $ 2,349 13%

Cash Available For DistributionSeptember YTD 2016 vs. September YTD 2015
21
YTD 2016 CAD grew by 6% over YTD 2015, reflecting growth in lease revenue
($ thousands) YTD 2016 YTD 2015
Increase
$ %
Net income (loss) $ 41,562 $ (7,600)
Depreciation 34,312 29,438
Non-cash reorganization structuring fee — 44,897
Percentage rent adjustment 10,038 9,768
Base rent adjustment 4,602 5,469
Amortization of deferred financing costs 3,010 2,436
Reorganization expenses — 333
Non-cash equity compensation 750 493
Other income, net (2,920) (2,180)
Capital expenditures to maintain net assets (34,312) (29,438)
Cash Available For Distribution (CAD) $ 57,042 $ 53,616 $ 3,426 6%

Debt Obligations and Available Liquidity$ millions
22
Long-Term Debt (rate / maturity)
Outstanding
As of
September 30, 2016
TDC – Senior Secured Notes (8.50% / December 30, 2020) $ 17.8
SDTS – Senior Secured Notes (5.04% / June 20, 2018) 60.0
SDTS – Senior Secured Notes, Series A (3.86% / December 3, 2025) 400.0
SDTS – Senior Secured Notes, Series B (3.86% / January 14, 2026) 100.0
SDTS – Senior Secured Notes (7.25% / December 30, 2029) 43.1
SDTS – Senior Secured Notes (6.47% / September 30, 2030) 98.5
Total $ 719.4
Liquidity Facilities Amount
Outstanding
As of
September 30, 2016 Available
InfraREIT Partners Revolver $ 75.0 $ — $ 75.0
SDTS Revolver 250.0 92.5 157.5
Total $ 325.0 $ 92.5 $ 232.5
Cash (as of September 30, 2016) 11.0
Total Available Liquidity $ 243.5

Growth and Financing Strategy
23
Focus on Regulated
T&D Opportunities
Maintain Strong Financial Profile
Grow Dividends
► Sign multi-year leases that reflect
regulated rate structure
► Minimize regulatory lag through regulatory
filings
► Construct Footprint Projects
► Acquire Hunt projects
► Opportunistically acquire T&D assets
► Maintain significant liquidity to support
capex plan and financial flexibility
► Maintain 55% debt to capitalization at
InfraREIT’s regulated subsidiary, SDTS
► Target consolidated credit metrics of 60%
debt to capitalization and 12% AFFO to
debt

Reaffirming FY 2016 guidance metrics with the following ranges:
CAD $70 million - $76 million
Non-GAAP EPS $1.15 - $1.25
Annualized dividends per share $1.00
Updating FY 2016 guidance metrics with the following ranges:
Net income $67 million - $73 million
Net income attributable to InfraREIT, Inc.
common shareholders per share range $1.10 – $1.20
Lowering guidance for footprint capital expenditures for 2016 – 2018 in the range of
$470 million - $630 million
Due to lower levels of commitments and follow-through in customer-identified projects and
forecasts; a slower pace of load growth; and the relative geographic concentration of recent and
expected load growth in Sharyland’s service territory
Suspending guidance for 2017 and beyond for all other metrics due to the uncertain
impacts of the treatment of our leases as part of an SDTS tariff
Expect to reset guidance after the rate case
Expect to maintain annualized dividends of $1.00 per share through the rate case
Forward Outlook
24

2016E - 2018E Footprint Capital Expenditures (1)
$ millions
25
(1) Footprint Projects are transmission or distribution projects primarily situated within our distribution service territory, or that physically hang from our existing transmission assets
Forecast range of $470 million - $630 million for 2016 – 2018
2016 2017 2018
Base Distribution $80 - $85 $35 - $60 $35 - $60
Base Transmission $120 - $125 $45 - $75 $20 - $50
Base Footprint
Capex$200 - $210 $80 - $135 $55 - $110
Synchronous
Condensers$10 - $15 $45 - $50 $15 - $30
Second Circuit $10 - $15 $50 - $55 $5 - $10
Total Footprint
Capex$220 - $240 $175 - $240 $75 - $150

Reg G Reconciliation
26

Schedule 1:
Reconciliation of Non-GAAP EPSQ3 2016 vs. Q3 2015
27
Non-GAAP EPS
InfraREIT defines non-GAAP net income as net income (loss) adjusted in a manner the Company believes is appropriate to show
its core operational performance, including: (a) adding back the non-cash reorganization structuring fee, (b) adding back the
reorganization expense related to the Company’s initial public offering (IPO) and related reorganization transactions, (c) adding
back the expense related to the contingent consideration issued as deemed capital credits, (d) a quarterly, not annual, adjustment
for the difference between the amount of percentage rent payments that the Company expects to receive with respect to the
applicable period and the amount of percentage rent the Company recognizes under GAAP during the period and (e) an
adjustment for the difference between the amount of base rent payments that the Company receives with respect to the applicable
period and the amount of straight-line base rent recognized under GAAP. The Company defines Non-GAAP EPS as non-GAAP
net income (loss) divided by the weighted average shares outstanding calculated in the manner described in the footnotes below.
The following table set forth a reconciliation of net income attributable to InfraREIT, Inc. per diluted share to Non-GAAP EPS for
the three months ended September 30, 2016 and 2015:
($ thousands, except per share amounts)
Q3 2016
Amount Per Share (3)
Q3 2015
Amount Per Share (4)
Net income attributable to InfraREIT, Inc. $ 17,041 $ 0.39 $ 13,972 $ 0.32
Net income attributable to noncontrolling interest 6,560 0.39 5,458 0.32
Net income 23,601 0.39 19,430 0.32
Non-cash reorganization structuring fee — — — —
Reorganization expenses — — — —
Percentage rent adjustment (1) (2,998) (0.05) (2,791) (0.05)
Base rent adjustment (2) (1,396) (0.02) 338 0.01
Non-GAAP net income $ 19,207 $ 0.32 $ 16,977 $ 0.28

Schedule 1:
Reconciliation of Non-GAAP EPSSeptember YTD 2016 vs. September YTD 2015
28
Non-GAAP EPS
The following table set forth a reconciliation of net income (loss) attributable to InfraREIT, Inc. per diluted share to Non-GAAP EPS
for the nine months ended September 30, 2016 and 2015:
($ thousands, except per share amounts)
YTD 2016
Amount Per Share (5)
YTD 2015
Amount Per Share (6)
Net income (loss) attributable to InfraREIT, Inc. $ 29,964 $ 0.69 $ (6,539) $ (0.15)
Net income (loss) attributable to noncontrolling
interest11,598 0.68 (1,061) (0.15)
Net income (loss) 41,562 0.69 (7,600) (0.13)
Non-cash reorganization structuring fee — — 44,897 0.76
Reorganization expenses — — 333 0.01
Percentage rent adjustment (1) 10,038 0.16 9,768 0.17
Base rent adjustment (2) 4,602 0.08 5,469 0.09
Non-GAAP net income $ 56,202 $ 0.93 $ 52,867 $ 0.90

Schedule 1:
Reconciliation of Non-GAAP EPS
(1) Represents the difference between the amount of percentage rent payments and the amount recognized during the applicable
period, if any. Although the Company receives percentage rent payments related to each quarter, it does not recognize lease
revenue related to these percentage rent payments until the Company’s tenant’s annual gross revenues exceed minimum specified
annual breakpoints under the leases.
(2) This adjustment relates to the difference between the timing of cash base rent payments made under the Company’s leases and
when the Company recognizes base rent revenue under GAAP. The Company recognizes base rent on a straight-line basis over
the applicable term of the lease commencing when the related assets are placed in service, which is frequently different than the
period in which the cash rent becomes due.
(3) The weighted average common shares outstanding during the three months ended September 30, 2016 of 43.7 million was used to
calculate net income attributable to InfraREIT, Inc. per diluted share. The weighted average redeemable partnership units
outstanding during the three months ended September 30, 2016 of 16.9 million was used to calculate the net income attributable to
noncontrolling interest per share. The combination of the weighted average common shares and redeemable partnership units
outstanding during the three months ended September 30, 2016 of 60.6 million was used for the remainder of the per share
calculations.
(4) The weighted average shares outstanding of 43.6 million was used to calculate net income attributable to InfraREIT, Inc. per diluted
share. The weighted average redeemable partnership units outstanding of 17.0 million was used to calculate the net income
attributable to noncontrolling interest per share. The combination of the weighted average shares and redeemable partnership units
outstanding of 60.6 million was used for the remainder of the per share calculations.
(5) The weighted average common shares outstanding during the nine months ended September 30, 2016 of 43.6 million was used to
calculate net income attributable to InfraREIT, Inc. per diluted share. The weighted average redeemable partnership units
outstanding during the nine months ended September 30, 2016 of 17.0 million was used to calculate net income attributable to
noncontrolling interest per share. The combination of the weighted average common shares and redeemable partnership units
outstanding during the nine months ended September 30, 2016 of 60.6 million was used for the remainder of the per share
calculations.
(6) The weighted average common shares outstanding during the nine months ended September 30, 2015 of 42.8 million was used to
calculate net loss attributable to InfraREIT, Inc. per diluted share. The weighted average redeemable partnership units outstanding
during the nine months ended September 30, 2015 of 16.0 million was used to calculate net loss attributable to noncontrolling
interest per share. The combination of the weighted average common shares and redeemable partnership units outstanding during
the nine months ended September 30, 2015 of 58.8 million was used for the remainder of the per share calculations.
29

Schedule 2:
Explanation and Reconciliation of CADQ3 2016 vs. Q3 2015
30
CAD
The Company defines CAD in a manner that it believes is appropriate to show its core operational performance, which includes a
deduction of the portion of capital expenditures needed to maintain its net assets. This deduction equals depreciation expense
within the applicable period. The portion of the capital expenditures in excess of depreciation, which the Company refers to as
growth capital expenditures, will increase the Company’s net assets. The CAD calculation also includes various other
adjustments from net income, as outlined below and described in more detail on Schedules 1, 3 and 4.
The following table sets forth a reconciliation of net income to CAD for the three months ended September 30, 2016 and 2015:
($ thousands) Q3 2016 Q3 2015
Net income $ 23,601 $ 19,430
Depreciation 11,828 10,259
Non-cash reorganization structuring fee — —
Percentage rent adjustment (1) (2,998) (2,791)
Base rent adjustment (2) (1,396) 338
Amortization of deferred financing costs 1,003 612
Reorganization expenses — —
Non-cash equity compensation 230 185
Other income, net (3) (1,024) (707)
Capital expenditures to maintain net assets (11,828) (10,259)
CAD $ 19,416 $ 17,067

Schedule 2:
Explanation and Reconciliation of CADSeptember YTD 2016 vs. September YTD 2015
31
CAD
The following table sets forth a reconciliation of net income (loss) to CAD for the nine months ended September 30, 2016 and
2015:
($ thousands) YTD 2016 YTD 2015
Net income (loss) $ 41,562 $ (7,600)
Depreciation 34,312 29,438
Non-cash reorganization structuring fee — 44,897
Percentage rent adjustment (1) 10,038 9,768
Base rent adjustment (2) 4,602 5,469
Amortization of deferred financing costs 3,010 2,436
Reorganization expenses — 333
Non-cash equity compensation 750 493
Other income, net (3) (2,920) (2,180)
Capital expenditures to maintain net assets (34,312) (29,438)
CAD $ 57,042 $ 53,616
(1) See footnote (1) on Schedule 1 on Explanation and Reconciliation on Non-GAAP EPS
(2) See footnote (2) on Schedule 1 on Explanation and Reconciliation on Non-GAAP EPS
(3) Includes allowance for funds used during construction (AFUDC) on other funds of $1.0 million and $0.7 million for the
three months ended September 30, 2016 and 2015, respectively, and $2.9 million and $2.2 million for the nine months
ended September 30, 2016 and 2015, respectively.

Schedule 3:
Explanation and Reconciliation of EBITDA and Adjusted EBITDAQ3 2016 vs. Q3 2015
32
EBITDA and Adjusted EBITDA
InfraREIT defines EBITDA as net income (loss) before interest expense, net; income tax expense; depreciation and amortization.
Adjusted EBITDA is defined as EBITDA adjusted in a manner the Company believes is appropriate to show its core operational
performance, including: (a) adding back the non-cash reorganization structuring fee, (b) a quarterly, not annual, adjustment for the
difference between the amount of percentage rent payments that the Company expects to receive with respect to the applicable
period and the amount of percentage rent the Company recognizes under GAAP during the period, (c) an adjustment for the
difference between the amount of base rent payments that the Company receives with respect to the applicable period and the
amount of straight-line base rent recognized under GAAP, (d) adding back the reorganization expense related to the Company’s
IPO and related reorganization transactions and (e) adjusting for other income (expense), net.
The following table sets forth a reconciliation of net income to EBITDA and Adjusted EBITDA for the three months ended
September 30, 2016 and 2015:
($ thousands) Q3 2016 Q3 2015
Net income $ 23,601 $ 19,430
Interest expense, net 9,379 6,723
Income tax expense 299 243
Depreciation 11,828 10,259
EBITDA 45,107 36,655
Non-cash reorganization structuring fee — —
Percentage rent adjustment (1) (2,998) (2,791)
Base rent adjustment (2) (1,396) 338
Reorganization expenses — —
Other income, net (3) (1,024) (707)
Adjusted EBITDA $ 39,689 $ 33,495
(1) See footnote (1) on Schedule 1 on Explanation and Reconciliation of Non-GAAP EPS
(2) See footnote (2) on Schedule 1 on Explanation and Reconciliation of Non-GAAP EPS
(3) See footnote (3) on Schedule 2 on Explanation and Reconciliation of CAD

Schedule 3:
Explanation and Reconciliation of EBITDA and Adjusted EBITDASeptember YTD 2016 vs. September YTD 2015
33
EBITDA and Adjusted EBITDA
The following table sets forth a reconciliation of net income (loss) to EBITDA and Adjusted EBITDA for the nine months ended
September 30, 2016 and 2015:
($ thousands) YTD 2016 YTD 2015
Net income (loss) $ 41,562 $ (7,600)
Interest expense, net 27,276 21,084
Income tax expense 778 575
Depreciation 34,312 29,438
EBITDA 103,928 43,497
Non-cash reorganization structuring fee — 44,897
Percentage rent adjustment (1) 10,038 9,768
Base rent adjustment (2) 4,602 5,469
Reorganization expenses — 333
Other income, net (3) (2,920) (2,180)
Adjusted EBITDA $ 115,648 $ 101,784
(1) See footnote (1) on Schedule 1 on Explanation and Reconciliation of Non-GAAP EPS
(2) See footnote (2) on Schedule 1 on Explanation and Reconciliation of Non-GAAP EPS
(3) See footnote (3) on Schedule 2 on Explanation and Reconciliation of CAD

Schedule 4:
Explanation of FFO and AFFO
34
FFO and AFFO
The National Association of Real Estate Investment Trusts (NAREIT) defines FFO as net income (computed in accordance with
GAAP), excluding gains and losses from sales of property (net) and impairments of depreciated real estate, plus real estate
depreciation and amortization (excluding amortization of deferred financing costs) and after adjustments for unconsolidated
partnerships and joint ventures. Applying the NAREIT definition to the Company’s consolidated financial statements, which is the
basis for the FFO and the reconciliations below, results in FFO representing net income (loss) before depreciation, impairment of
assets and gain (loss) on sale of assets. FFO does not represent cash generated from operations as defined by GAAP and it is
not indicative of cash available to fund all cash needs, including distributions.
AFFO is defined as FFO adjusted in a manner the Company believes is appropriate to show its core operational performance,
including: (a) adding back the non-cash reorganization structuring fee, (b) a quarterly, not annual, adjustment for the difference
between the amount of percentage rent payments that the Company expects to receive with respect to the applicable period and
the amount of percentage rent the Company recognizes under GAAP during the period, (c) an adjustment for the difference
between the amount of base rent payments that the Company receives with respect to the applicable period and the amount of
straight-line base rent recognized under GAAP, (d) adding back the reorganization expense related to the Company’s IPO and
related reorganization transactions and (e) adjusting for other income (expense), net.

Schedule 4:
Reconciliation of FFO and AFFOQ3 2016 vs. Q3 2015
35
FFO and AFFO
The following table sets forth a reconciliation of net income to FFO and AFFO for the three months ended September 30, 2016 and
2015:
($ thousands) Q3 2016 Q3 2015
Net income $ 23,601 $ 19,430
Depreciation 11,828 10,259
FFO 35,429 29,689
Non-cash reorganization structuring fee — —
Percentage rent adjustment (1) (2,998) (2,791)
Base rent adjustment (2) (1,396) 338
Reorganization expenses — —
Other income, net (3) (1,024) (707)
AFFO $ 30,011 $ 26,529
(1) See footnote (1) on Schedule 1 on Explanation and Reconciliation of Non-GAAP EPS
(2) See footnote (2) on Schedule 1 on Explanation and Reconciliation of Non-GAAP EPS
(3) See footnote (3) on Schedule 2 on Explanation and Reconciliation of CAD

Schedule 4:
Reconciliation of FFO and AFFOSeptember YTD 2016 vs. September YTD 2015
36
FFO and AFFO
The following table sets forth a reconciliation of net income (loss) to FFO and AFFO for the nine months ended September 30, 2016
and 2015:
($ thousands) YTD 2016 YTD 2015
Net income (loss) $ 41,562 $ (7,600)
Depreciation 34,312 29,438
FFO 75,874 21,838
Non-cash reorganization structuring fee — 44,897
Percentage rent adjustment (1) 10,038 9,768
Base rent adjustment (2) 4,602 5,469
Reorganization expenses — 333
Other income, net (3) (2,920) (2,180)
AFFO $ 87,594 $ 80,125
(1) See footnote (1) on Schedule 1 on Explanation and Reconciliation of Non-GAAP EPS
(2) See footnote (2) on Schedule 1 on Explanation and Reconciliation of Non-GAAP EPS
(3) See footnote (3) on Schedule 2 on Explanation and Reconciliation of CAD

Schedule 5:
Forecasted Guidance for 2016Reconciliation of GAAP to Non-GAAP
37
Forecasted Guidance for 2016
The Company provides yearly guidance for the supplemental financial measures it uses in evaluating the Company’s operating
performance. These metrics include Non-GAAP EPS and CAD. These financial measures help the Company and investors better
understand the Company’s business, performance and ability to earn and distribute cash to stockholders by providing
perspectives not immediately apparent from net income.
The following table sets forth a reconciliation of the forecasted GAAP net income attributable to InfraREIT, Inc. per share to Non-
GAAP EPS for the year ending December 31, 2016:
(Per share amounts) Low High
Net income attributable to InfraREIT, Inc. $ 1.10 $ 1.20
Net income attributable to noncontrolling interest 1.10 1.20
Net income 1.10 1.20
Base rent adjustment 0.05 0.05
Non-GAAP net income $ 1.15 $ 1.25

Schedule 5:
Forecasted Guidance for 2016Reconciliation of GAAP to Non-GAAP
38
Forecasted Guidance for 2016
The following table sets forth a reconciliation of the forecasted GAAP net income to CAD for the year ending December 31, 2016:
($ millions) Low High
Net income $ 67 $ 73
Depreciation 47 47
Base rent adjustment 3 3
Amortization of deferred financing costs 3 3
Non-cash equity compensation 1 1
Other income, net (4) (4)
Capital expenditures to maintain net assets (47) (47)
CAD $ 70 $ 76

Appendix
39

Attractive Asset Profile
Transmission
► ~75% of our rate base is
transmission
► ~848 circuit miles of transmission
lines
► Transmission Operations Center
► Railroad DC Tie with Mexico
(300 MW)
Distribution
► ~25% of our rate base is distribution
► ~35,300 circuit miles of overhead
distribution lines
► ~4,600 circuit miles of underground
distribution lines
► ~54,000 electric delivery points
As of December 31, 201540

Sharyland Service Territory in West Texas
41
Dallas
Austin
San Antonio
Source: Sharyland Utilities
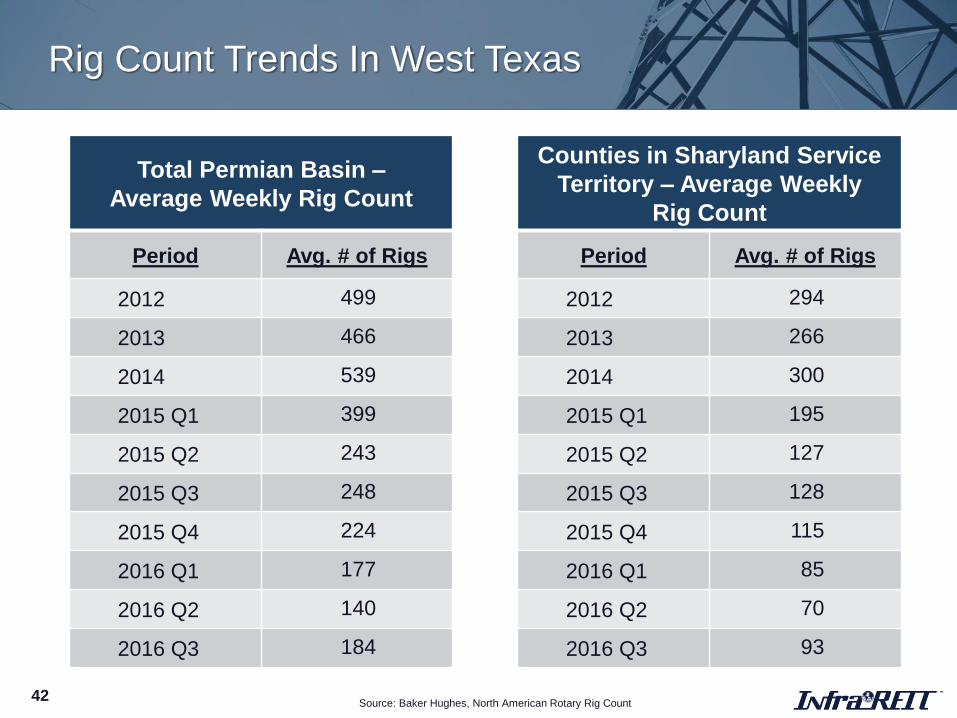
Total Permian Basin –
Average Weekly Rig Count
Period Avg. # of Rigs
2012 499
2013 466
2014 539
2015 Q1 399
2015 Q2 243
2015 Q3 248
2015 Q4 224
2016 Q1 177
2016 Q2 140
2016 Q3 184
Rig Count Trends In West Texas
42
Counties in Sharyland Service
Territory – Average Weekly
Rig Count
Period Avg. # of Rigs
2012 294
2013 266
2014 300
2015 Q1 195
2015 Q2 127
2015 Q3 128
2015 Q4 115
2016 Q1 85
2016 Q2 70
2016 Q3 93
Source: Baker Hughes, North American Rotary Rig Count

Hunt ProjectsAs of November 3, 2016
43
Project State Estimated Costs (1) Status
Golden Spread TXNet Plant
$90 mm
• In service
• Owned by Sharyland (2); Project expected to be offered to
InfraREIT in the future
Cross Valley TXNet Plant
$170 mm - $175 mm
• In service
• Owned by Sharyland (2); Project expected to be offered to
InfraREIT in the future
SouthlineAZ
NM
~ $800 mm
(excl. financing costs)
• Achieved Phase 3 status in WECC ratings process in 2015
• FERC granted a Petition for Declaratory Order in 2015
• BLM and Western issued Record of Decision in April 2016
• Open solicitation process closed June 30, 2016; submissions
are currently under review by SU FERC (2)
• Filed application with the Arizona Corporation Commission
for a CEC in October 2016
Verde NM$60 mm - $80 mm
(excl. financing costs)
• Easement agreements reached with three Native American
Pueblos
• BLM published the NOI to prepare an EIS in the Federal
Register in October 2016
(1) For the Southline and Verde Projects, Hunt may opt to partner with other parties in the development of projects depending on their scope, location and cost.
(2) Sharyland Utilities, L.P. and SU FERC, L.L.C. are privately-owned by Hunter L. Hunt and other members of the Ray L. Hunt family, and are managed by Hunter L. Hunt

Disciplined, Multifaceted Pursuit of Growth
44
Footprint Projects
(Funded by InfraREIT)
Hunt Development
team members are
experienced T&D
planners
Hunt Projects
Growth Strategy Growth Drivers
• Population and economic growth across Texas
• Energy-driven economic expansion
• Generator interconnections to Panhandle
Transmission assets
• Hunt T&D projects that are operational, under
construction or under development
• Future T&D projects developed and constructed by
Hunt
• Primarily focused on Texas and the Southwest
• Value enhancing M&A Transactions that build on:
• Hunt’s industry relationships and reputation
• Expertise with REIT structure
Acquire other T&D assets
from third parties

SDTS (2)
Structure Mechanics
45
SDTS owns our T&D
assets and leases them
to Sharyland
Sharyland collects rate-
regulated revenue from
other utilities and retail
electric providers
Sharyland makes regular
lease payments to SDTS
InfraREIT pays dividends
to stockholders
1
2
3
4
Shareholders
InfraREIT (1)
Hunt Family
Sharyland
Utilities
Customers
T&D Services Cash
Lease
Rent
1
2
3
4 Ownership (3)
Hunt Manager
Hunt Developer
100% Interest
(1) Represents InfraREIT, Inc., InfraREIT Partners, LP (Operating Partnership) and Transmission and Distribution Company, L.L.C. (TDC)
(2) Represents Sharyland Distribution & Transmission Services, L.L.C. (SDTS)
(3) Represents Hunt Transmission Services, L.L.C. (limited partner of the Operating Partnership, shareholder of InfraREIT and Hunt Developer)
Conducted business as a REIT since 2010
Hunt
Consolidated,
Inc.

Board Structure
Management
Related Party
Transactions
Management
Agreement
9 total members, 6 independent
CEO, CFO and General Counsel are officers of InfraREIT and Hunt
Manager
Require majority approval by the independent board members (i.e.
Hunt project acquisitions)
Responsible for the day-to-day business and legal activities of
InfraREIT
Annual base fee equal to $14.0 million for April 1, 2016 through March
31, 2017 representing 1.50% of total book equity as of year end 2015
Capped at $30 million per year
Incentive fee equal to 20% of quarterly dividends per share in excess
of the threshold distribution amount payable quarterly
2016 dividend per share: $0.25
Threshold dividend: $0.27
Governance and Management
46

Existing Lease Mechanics
47
Lease Objectives
InfraREIT
► Rent payments intended to
provide InfraREIT with
approximately 97% of the
projected regulated return on
rate base attributable to
InfraREIT’s assets
Sharyland
► Sharyland recovers operating
and maintenance (O&M) costs
and a portion of the return on
InfraREIT’s rate base
Lease Terms
► InfraREIT is obligated to fund
capex for Footprint Projects
► New assets are added to
leases through supplements
► Lease renewals apply the same
methodology but are updated
for new rate case information
► Approximately 80% – 90% of
rent is a fixed amount – paid
monthly
► Approximately 10% – 20% of
rent is variable based on a
percentage of Sharyland’s
gross revenue less adjustments
– paid quarterly


![[XLS]fba.flmusiced.org · Web view1 1 1 1 1 1 1 2 2 2 2 2 2 2 2 2 2 2 2 2 2 2 2 2 2 2 2 2 2 2 3 3 3 3 3 3 3 3 3 3 3 3 3 3 3 3 3 3 3 3 3 3 3 3 3 3 3 3 3 3 3 3 3 3 3 3 3 3 3 3 3 3 3](https://img.dokumen.tips/doc/110x75/5b1a7c437f8b9a28258d8e89/xlsfba-web-view1-1-1-1-1-1-1-2-2-2-2-2-2-2-2-2-2-2-2-2-2-2-2-2-2-2-2-2-2.jpg)