Embed Size (px)
Citation preview

www.eni.com
30 July 2015
H1 interim results and strategy updateTransformation drives performance

H1 highlights
all mid-downstream profitable
capex and opex reduction
strong production growth
2
CFFO €5.7 bln: in line with H1 2014
3
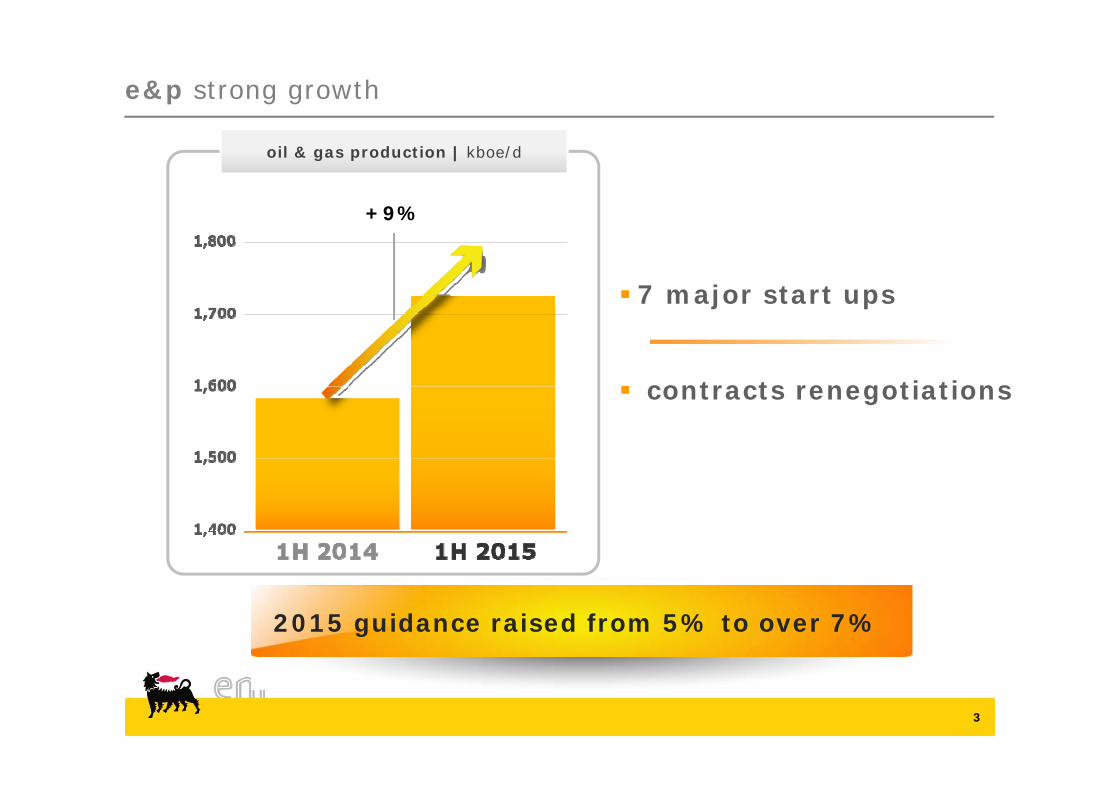
e&p strong growth
2015 guidance raised from 5% to over 7%
7 major start ups
contracts renegotiations
+9%
oil & gas production | kboe/d
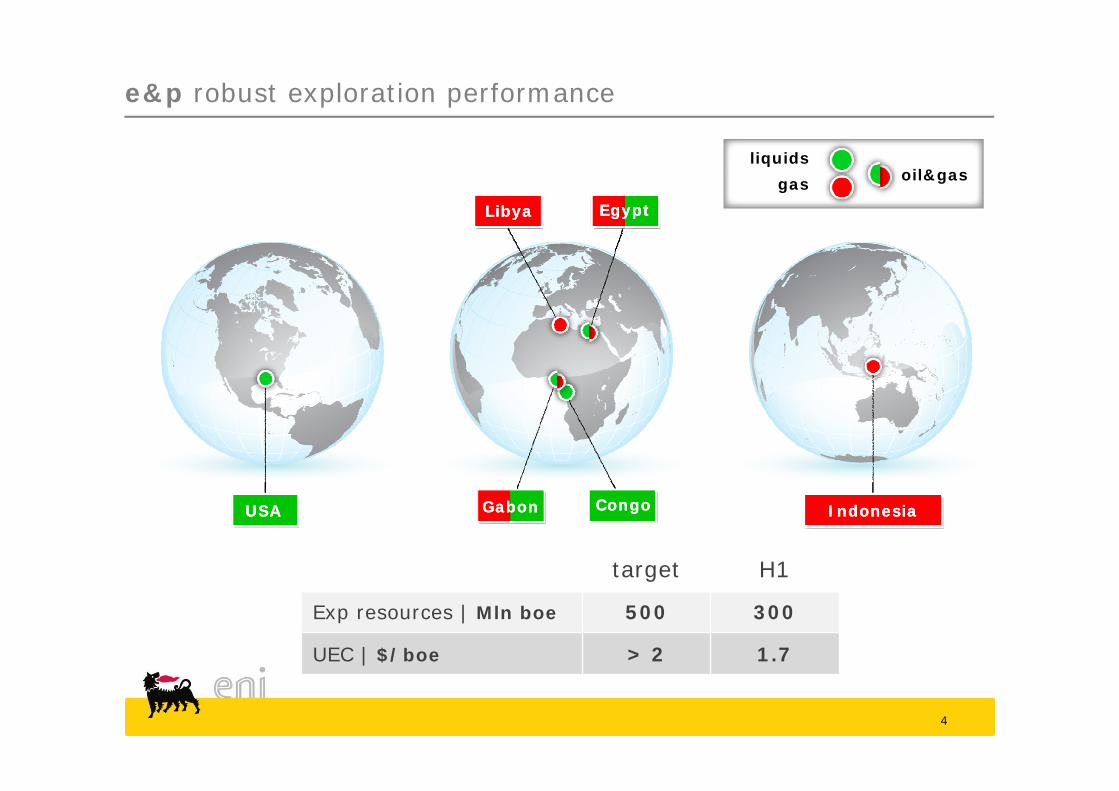
e&p robust exploration performance
4
target H1
Exp resources | Mln boe 500 300
UEC | $/boe > 2 1.7
LibyaLibya EgyptEgypt
CongoCongoGabonGabon IndonesiaIndonesiaUSAUSA
liquidsgas oil&gas
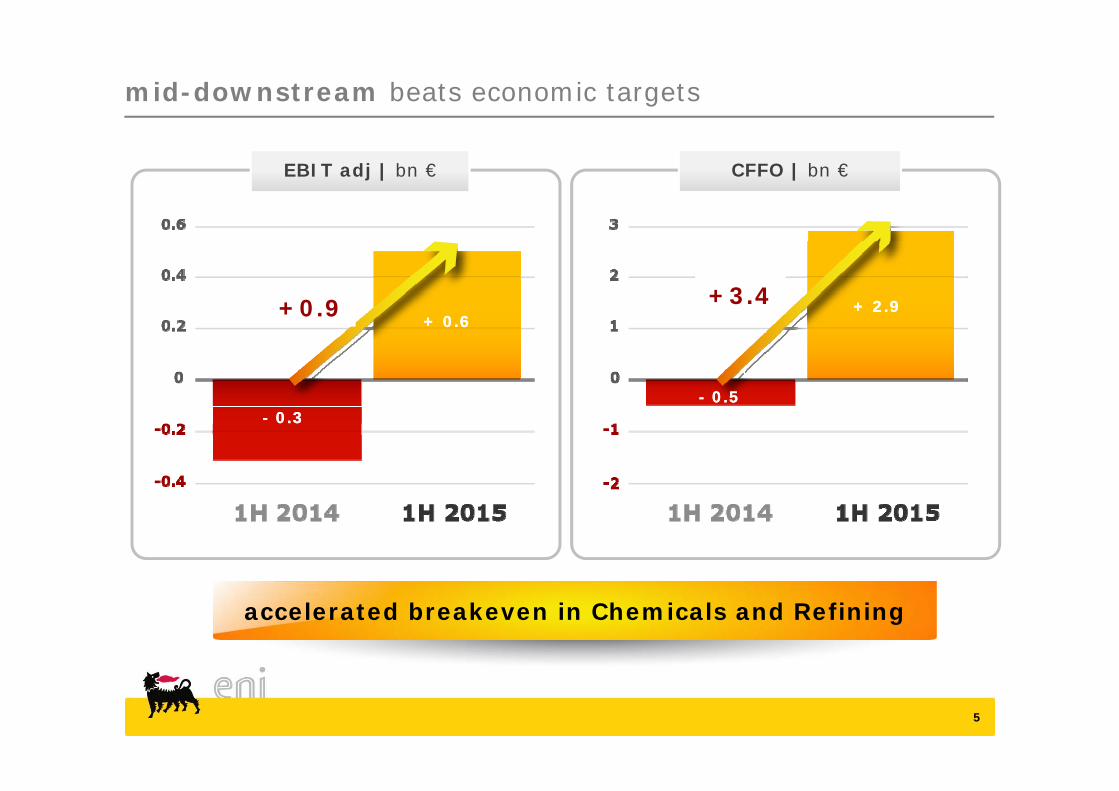
mid-downstream beats economic targets
accelerated breakeven in Chemicals and Refining
5
EBIT adj | bn €
+3.4
- 0.5- 0.5
+ 2.9+ 2.9+0.9 + 0.6+ 0.6
- 0.3- 0.3
CFFO | bn €

H1 cost efficiency: significant across all sectors
G&A - 25%
Opex - 10%
At constant exchange rate
total cash improvement +€ 1,4 bn
6
Capex - 10%

economic performance
7
plan execution delivered € 800 mln
Constant scenario: oil price, FX and refining margins
6.2
-3.8-3.8
-0.9-0.9 +0.8+0.8
2.3
scenario
performance
Saipem
EBIT adj | bn €

strong cash generation
8
capex covered by operating cashflow
cumulated CFFO | 2015 CFFO and CAPEX | 2015
H1 5.7H1 5.7 H1 6.3H1 6.3

business targets confirmed or increased
Ebit refers to adjusted results 9
new target
2015 production > 7%
ebit positive from 2015
ebit breakeven from 2015
cash neutrality in 2015/2016 confirmed at ~60 $/bl
ebit positive from 2015
ebit breakeven from 2015


![Investor Update Q2 FY16 / H1 FY16 [Company Update]](https://img.dokumen.tips/doc/110x75/577ca80a1a28abea748caad0/investor-update-q2-fy16-h1-fy16-company-update.jpg)