Embed Size (px)
Citation preview

U S I N G
H E AT M A P S T O D E F I N E
P E R F O R M A N C E M E T R I C S
S E R G E Y C H E R N Y S H E VJ U N E 2 7 , 2 0 1 6 @ N E W Y O R K W E B P E R F O R M A N C E M E E T U P

W H Y D O W E M E A S U R E S P E E D ?
• Monitor for degradations (Ops)
• Analyze code for perf issues (Devs)
• Verify improvements (Devs)
• Prioritize improvements (Business)
• Budget for WPO initiatives (Business)

S TAT S• Google: +500ms => -25% searches (2006)
• Amazon: +100ms => -1% revenue (2008)
• Netflix: +GZip => -43% Traffic cost (2008)
• Shopzilla: -5s => +12% Conversion rate (2009)
• Google: +400ms => -0.21% searches after experiment! (2009)
• Mozilla: -2.2s => +15.4% Downloads (2010)
• Edmunds: -77% load time => +20% page views (2011)
• DoubleClick: -1 redirect => +12% CTR (2011)
• Etsy: +160Kb => +12% bounce rate (2014)
• Trainline: -0.3s => +$11.5M / year revenue (2016)
WPOStats.com

R E A L U S E R M E A S U R E M E N T
• Real users (a lot of them)
• A lot of data (need to store it)
• All noise you can get, requires filtering
• Metrics are distributions
• Can correlate to business KPIs

S Y N T H E T I C T E S T I N G & A N A LY S I S
• From particular location
• Tester controls instrumentation
• One metric value
• Data can have lots of details for analysis
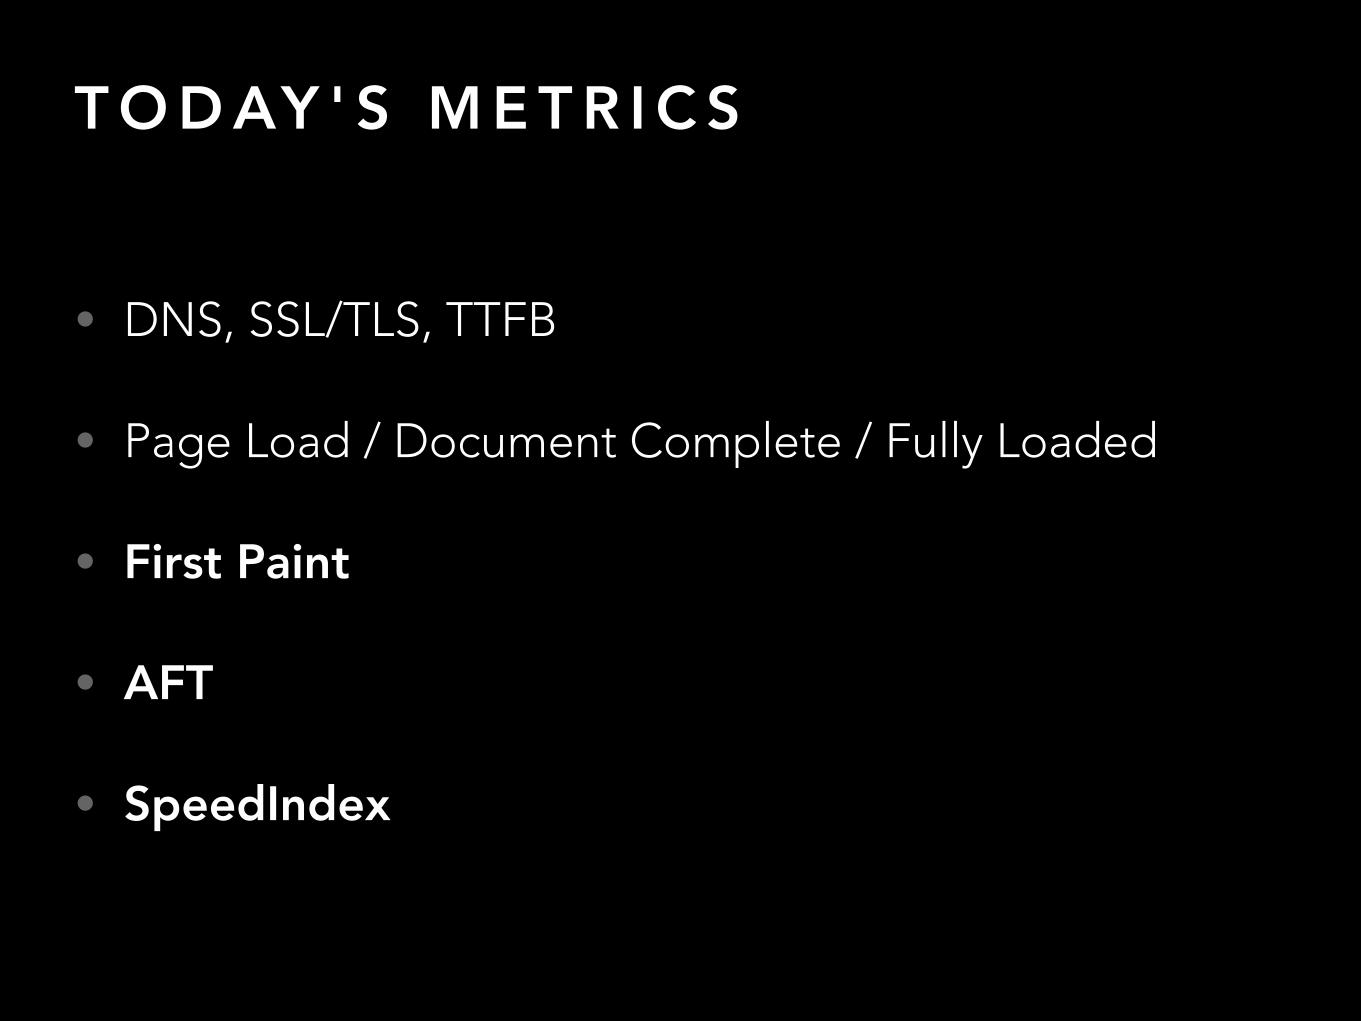
T O D AY ' S M E T R I C S
• DNS, SSL/TLS, TTFB
• Page Load / Document Complete / Fully Loaded
• First Paint
• AFT
• SpeedIndex

T I M E T O F I R S T PA I N T
• Shows when completely useless part is over
TTFP 3.5s

A F T ( A B O V E T H E F O L D T I M E )
• When everything is finally visible
AFT 15.3s

S P E E D I N D E X
• Unifies rendering progress in one number
Speed Index 8618
U S E R T I M I N G A P I
• Records custom JS timings on the page
• Measured by both RUM and Synthetic tools
• Can be hard to match with user's reality
• Requires JavaScript instrumentation
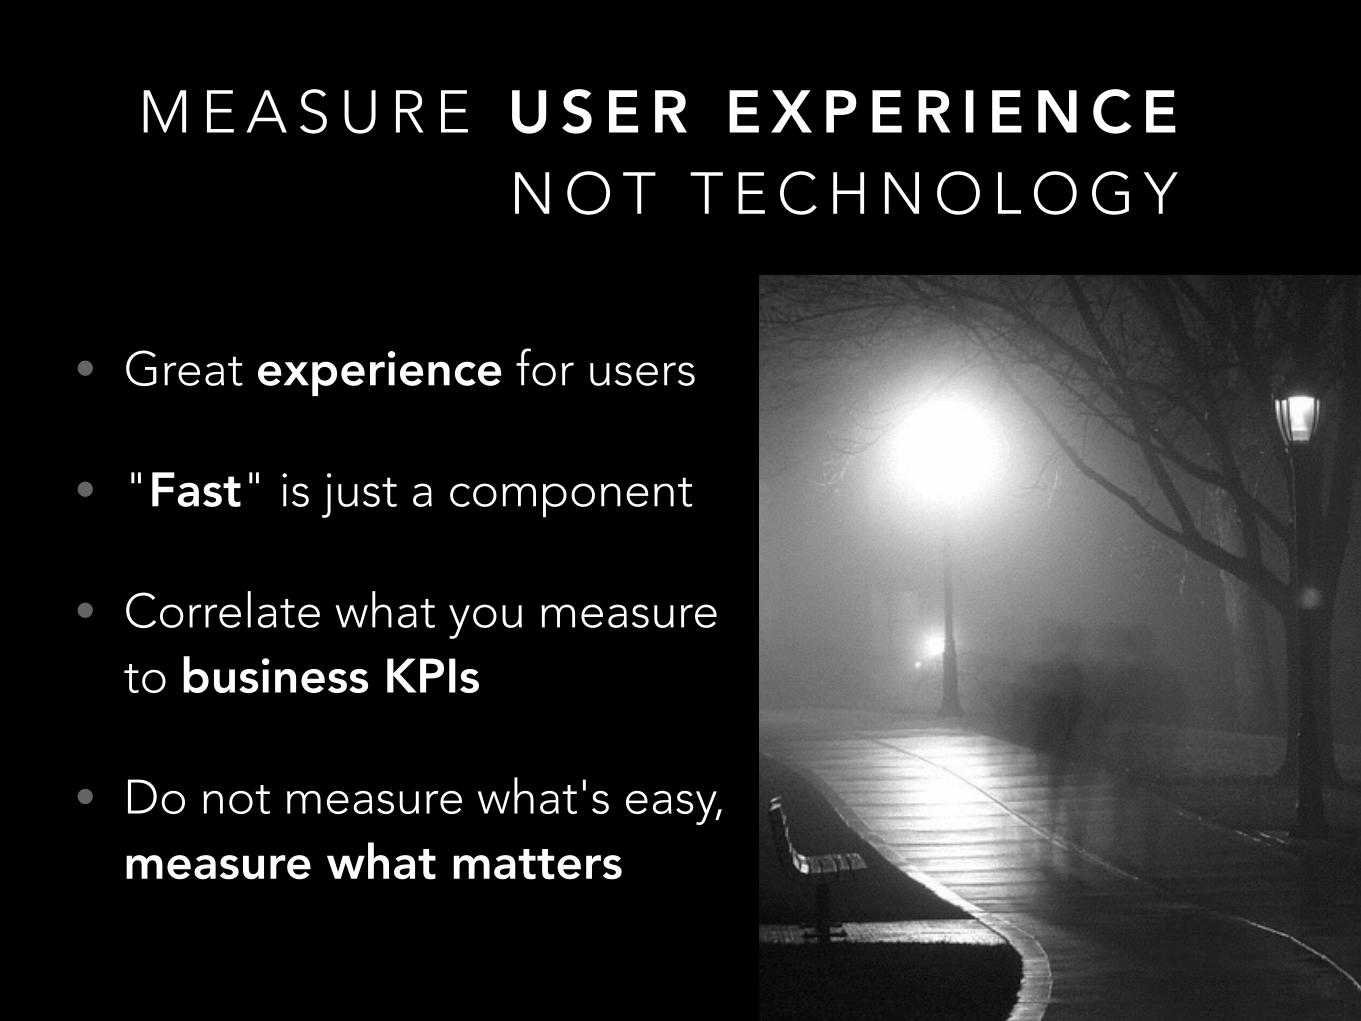
M E A S U R E U S E R E X P E R I E N C E
• Great experience for users
• "Fast" is just a component
• Correlate what you measure to business KPIs
• Do not measure what's easy, measure what matters
N O T T E C H N O L O G Y

H E AT M A P S
D I S C O V E R A N D D E F I N E
W H AT M AT T E R S U S I N G

U S E R A C T I O N H E AT M A P S
• Eye tracking
• Click tracking
• Hard to capture
• Shows current state
• Can be automated
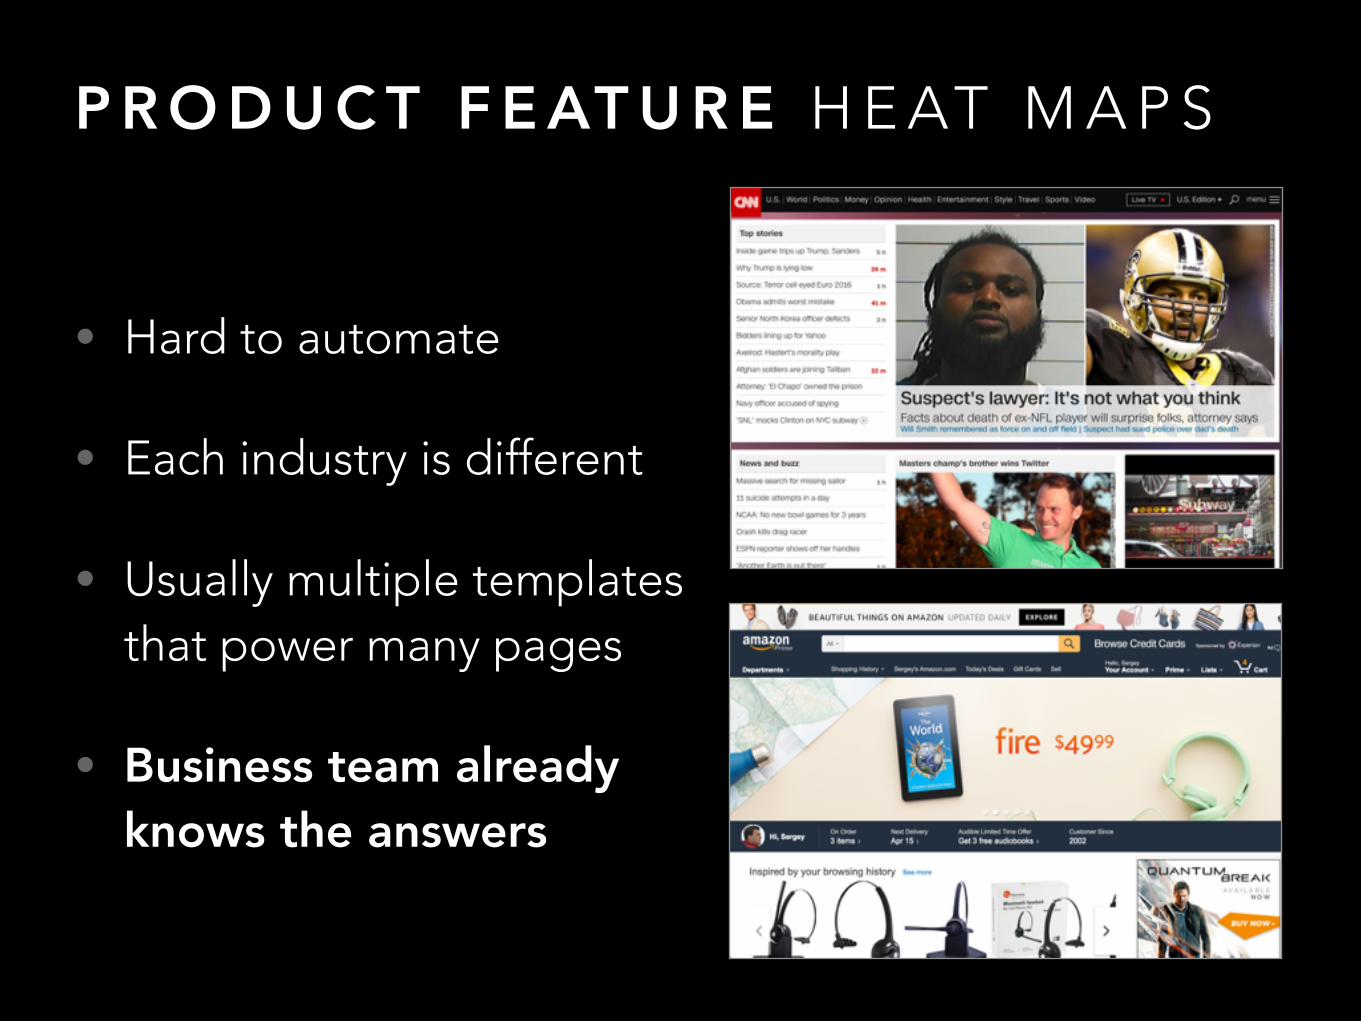
P R O D U C T F E AT U R E H E AT M A P S
• Hard to automate
• Each industry is different
• Usually multiple templates that power many pages
• Business team already knows the answers

I N T E R A C T I O N O N T H E W E B
1. Acknowledge action
2. Verify destination
3. Provide primary content
4. Allow interaction
5. Show secondary content
6. Invisible tasks

D E S I G N C O M P O N E N T S
• Core Branding & Main Navigation
• Primary content

H E AT M A P C U T- O U T S
Core Branding & Main Navigation Primary content

C O R E B R A N D I N G H E AT M A P
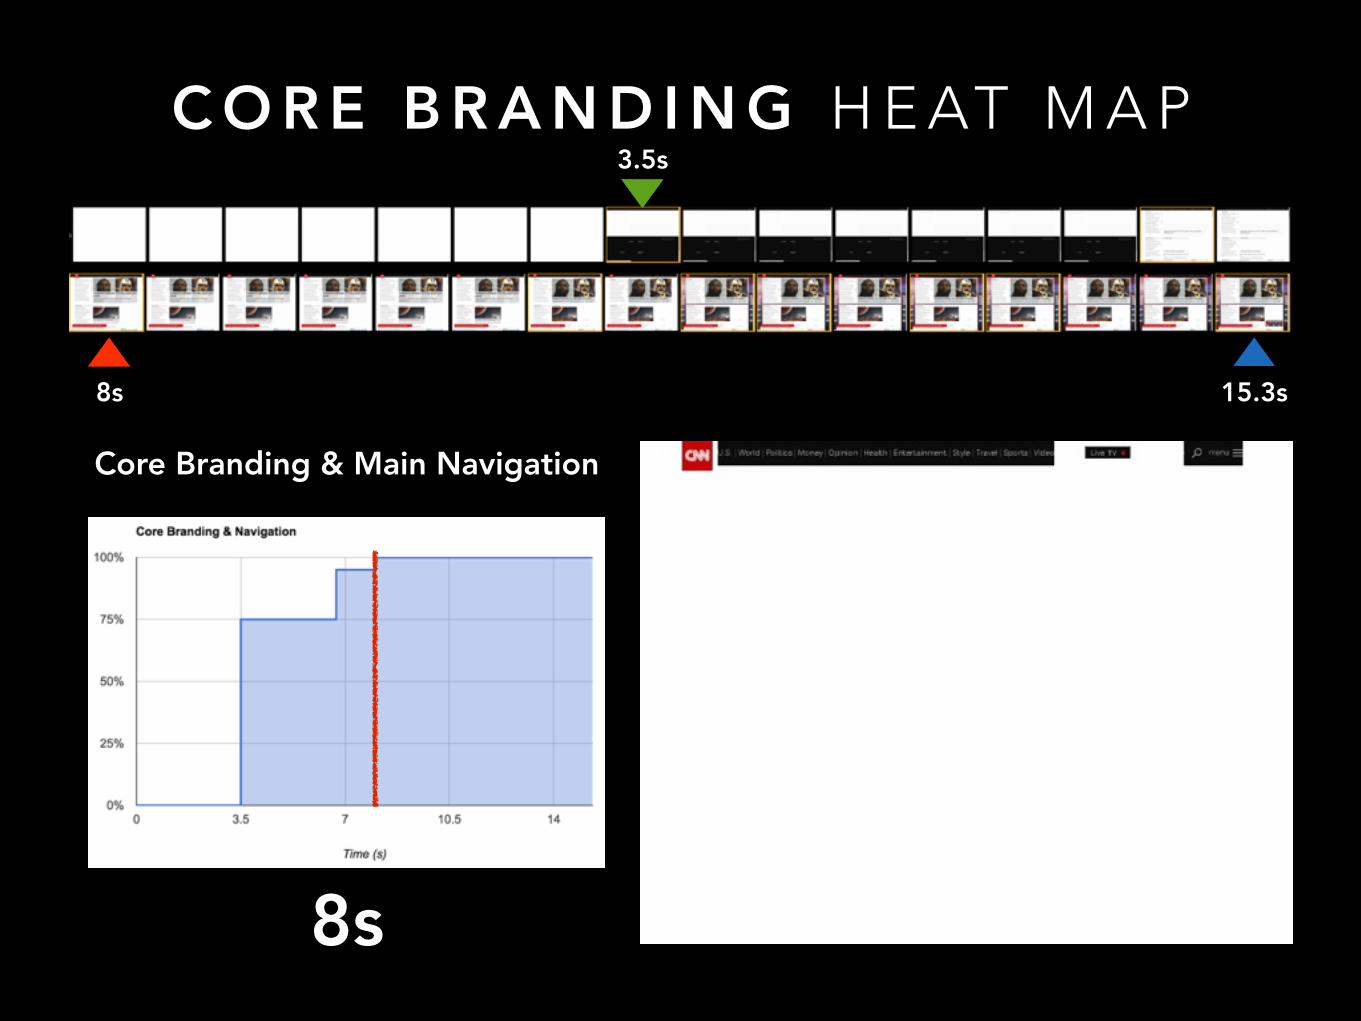
C O R E B R A N D I N G H E AT M A P
Core Branding & Main Navigation
8s
8s
3.5s
15.3s

P R I M A RY C O N T E N T H E AT M A P
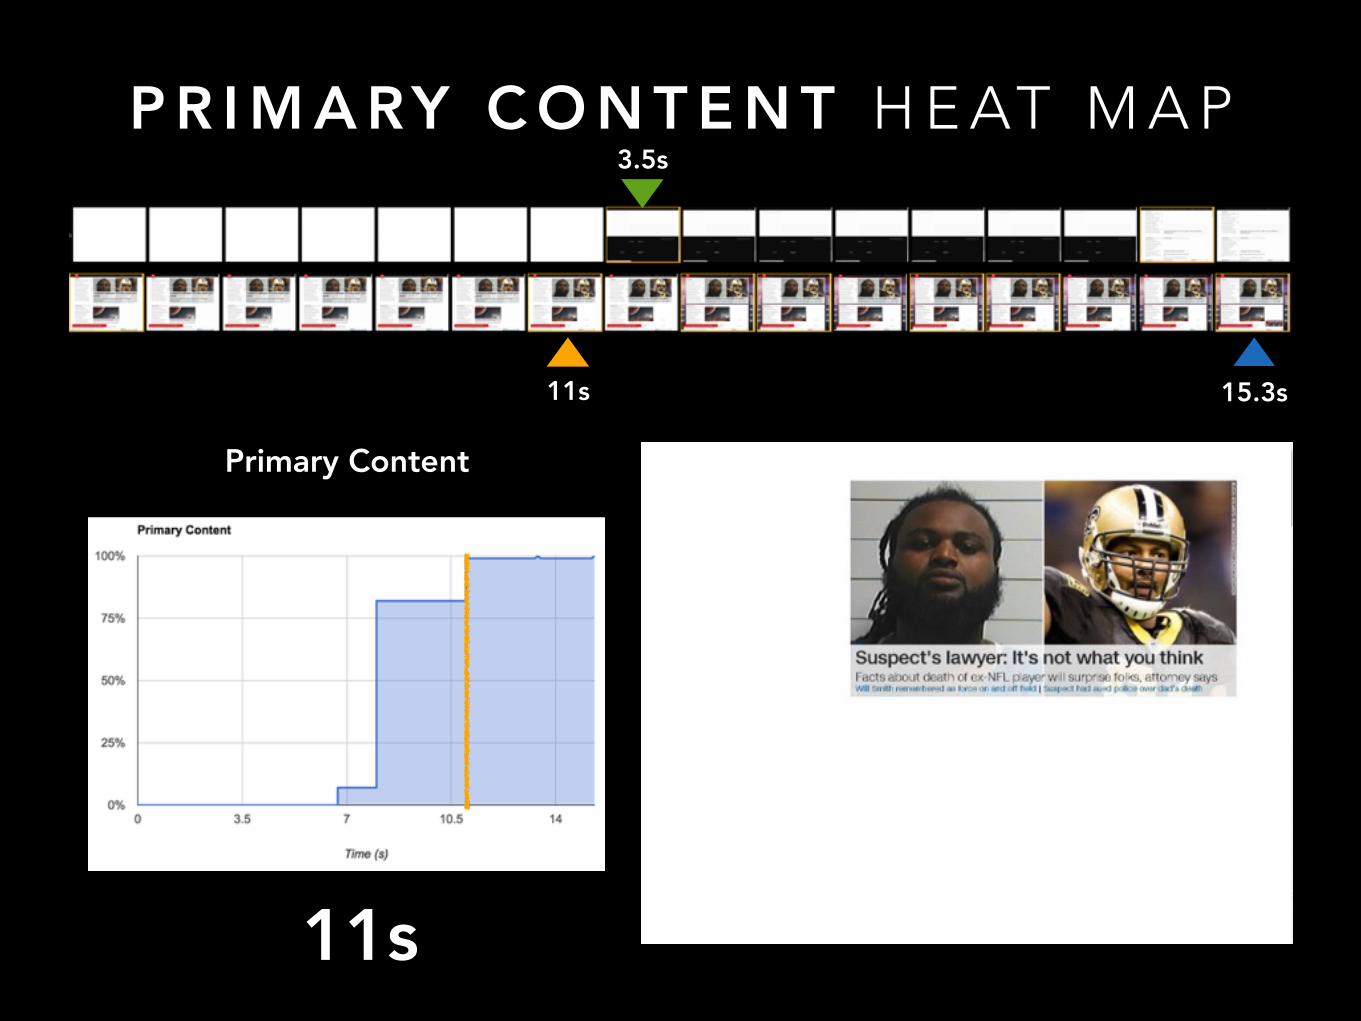
11s
P R I M A RY C O N T E N T H E AT M A P
11s
Primary Content
3.5s
15.3s

E X T E N D E D M E T R I C S
• Time To First Paint (TTFP) - 3.5s
• Core Branding & Main Navigation - 8s
• Primary content - 11s
• ...
• Above The Fold (AFT) - 15.3s
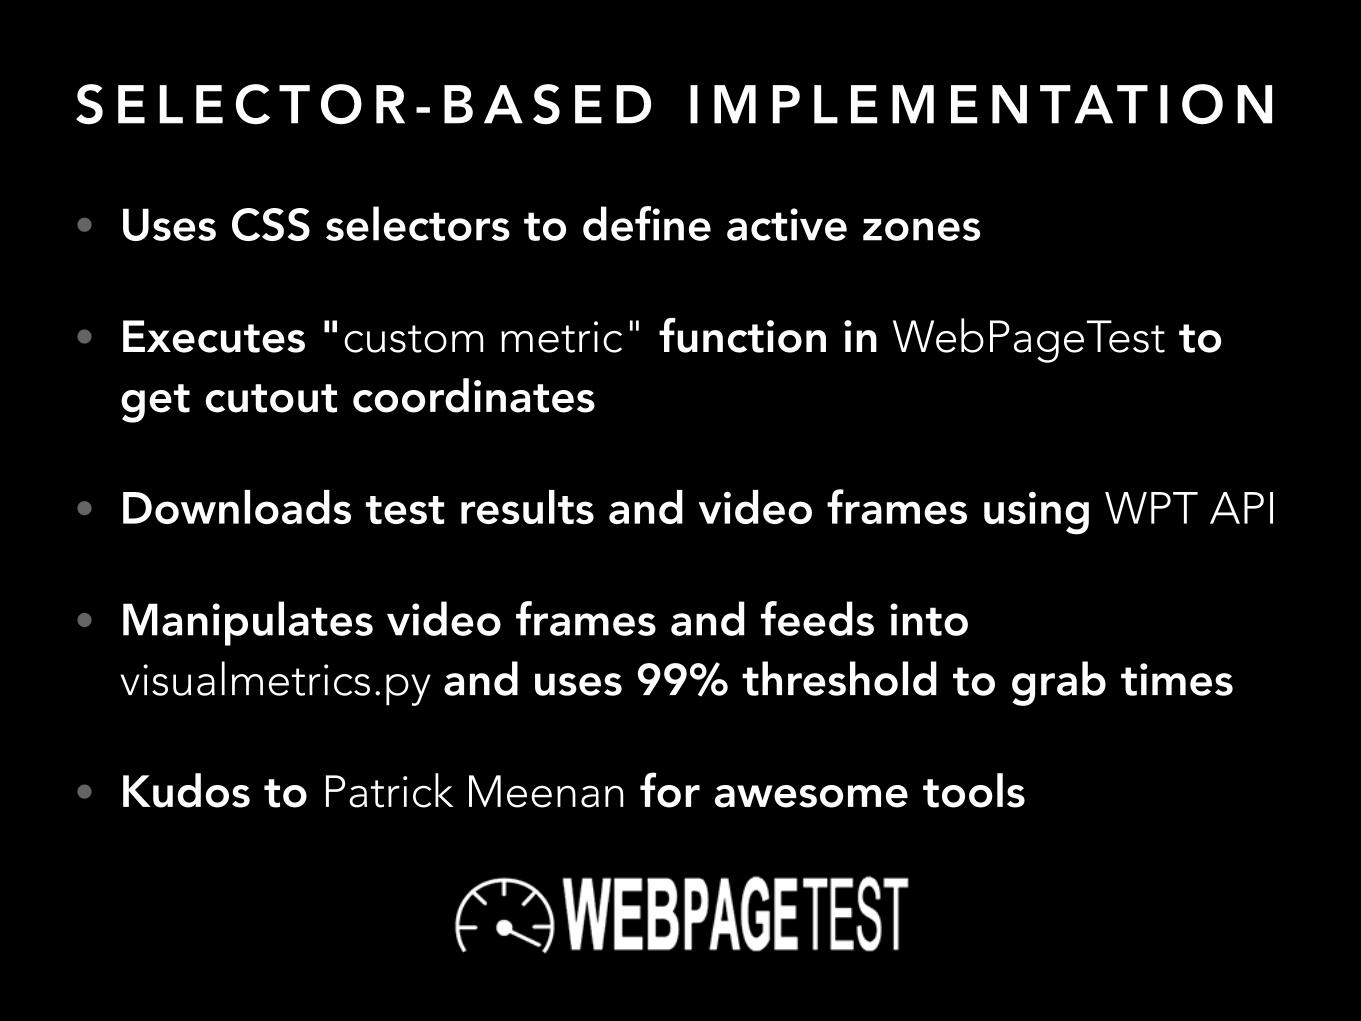
S E L E C T O R - B A S E D I M P L E M E N TAT I O N
• Uses CSS selectors to define active zones
• Executes "custom metric" function in WebPageTest to get cutout coordinates
• Downloads test results and video frames using WPT API
• Manipulates video frames and feeds into visualmetrics.py and uses 99% threshold to grab times
• Kudos to Patrick Meenan for awesome tools