Embed Size (px)
Citation preview
Semantic Data Layers in Air Quality Monitoring for Smarter Cities
Jean-Paul Calbimonte, Julien Eberle and Karl Aberer
LSIR EPFL
S4SC Workshop 2015. International Semantic Web Conference ISWC
Bethlehem, PA, October 2015
@jpcik
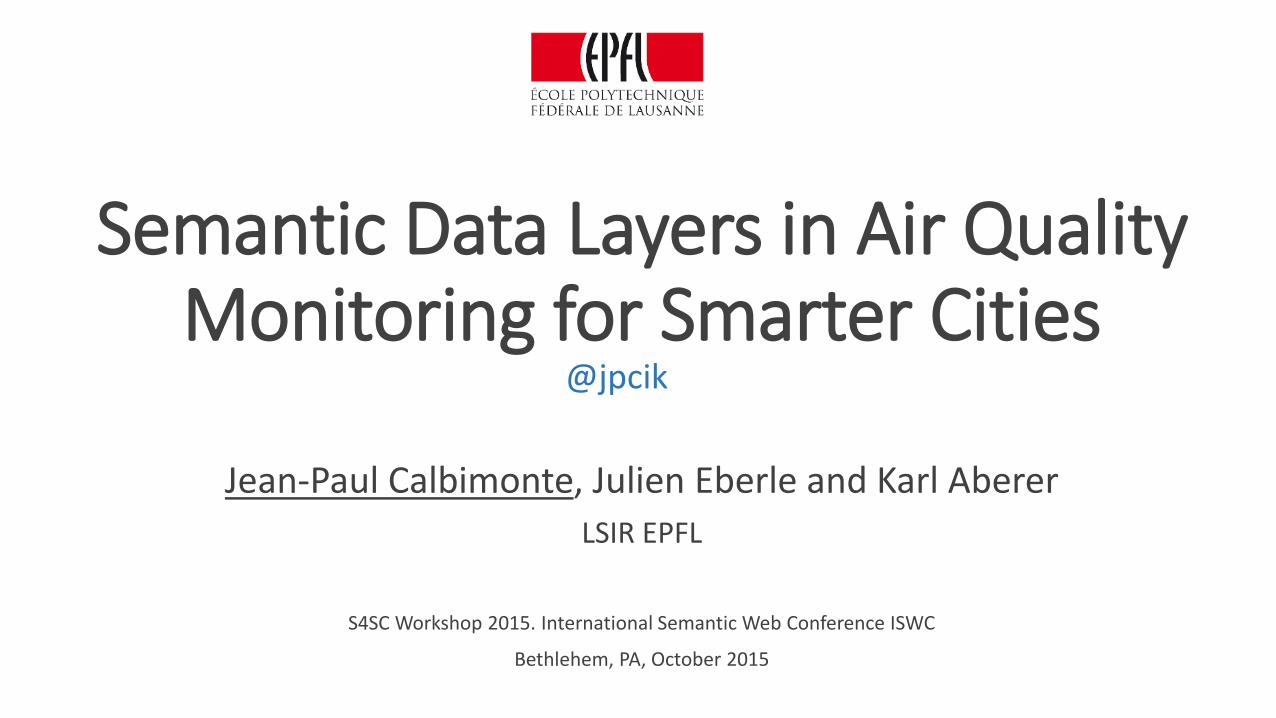
5% (2.6 million) of all deaths are caused by urban air pollution
Global Health Risks, WHO 2014
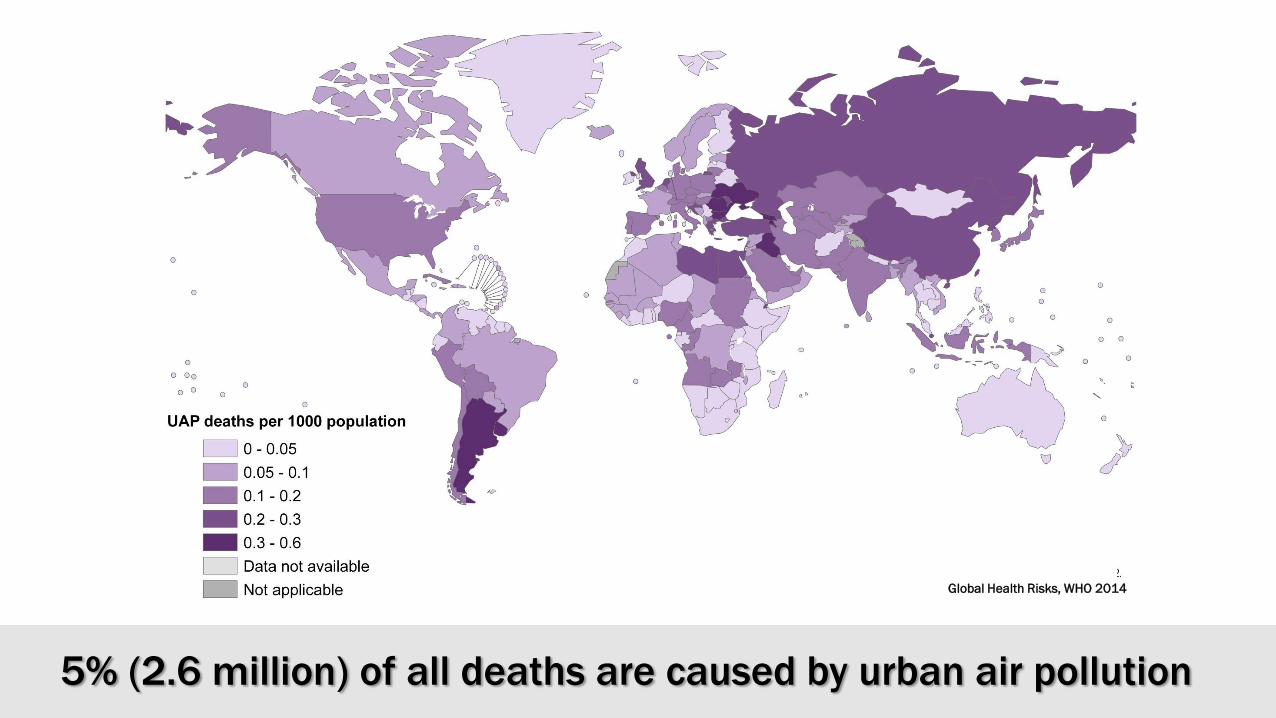
Health studies show that air pollution increases the risk of cardiovascular mortality(heart attacks) by 5% to 20% at least
Health studies have shown the link between pollution and cardiovascular mortality
Cardiopulmonary Diseases
CardiovascularDiseases
Brook et al, Circulation 2010
Ischemic HeartDiseases
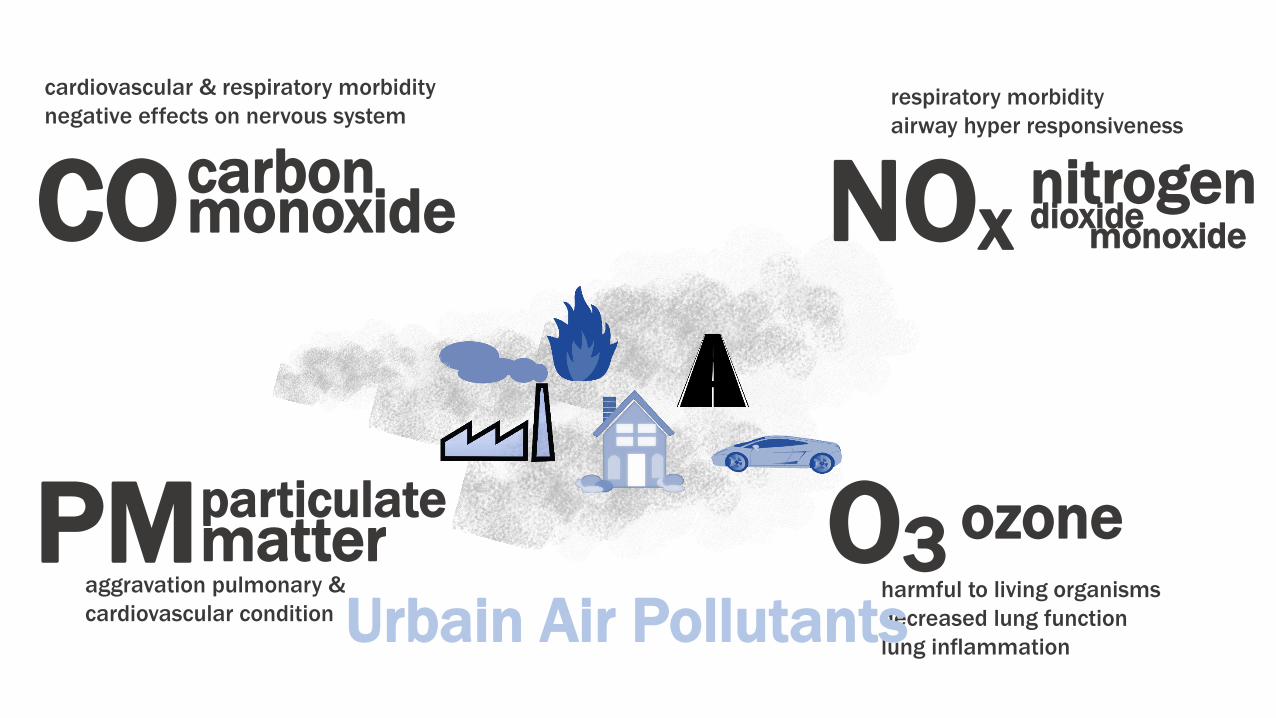
cardiovascular & respiratory morbidity
negative effects on nervous system
COcarbon monoxide
respiratory morbidity
airway hyper responsiveness
harmful to living organisms
decreased lung function
lung inflammationUrbain Air Pollutants
NOxnitrogendioxide
monoxide
O3 ozonePMparticulatematter
aggravation pulmonary &
cardiovascular condition
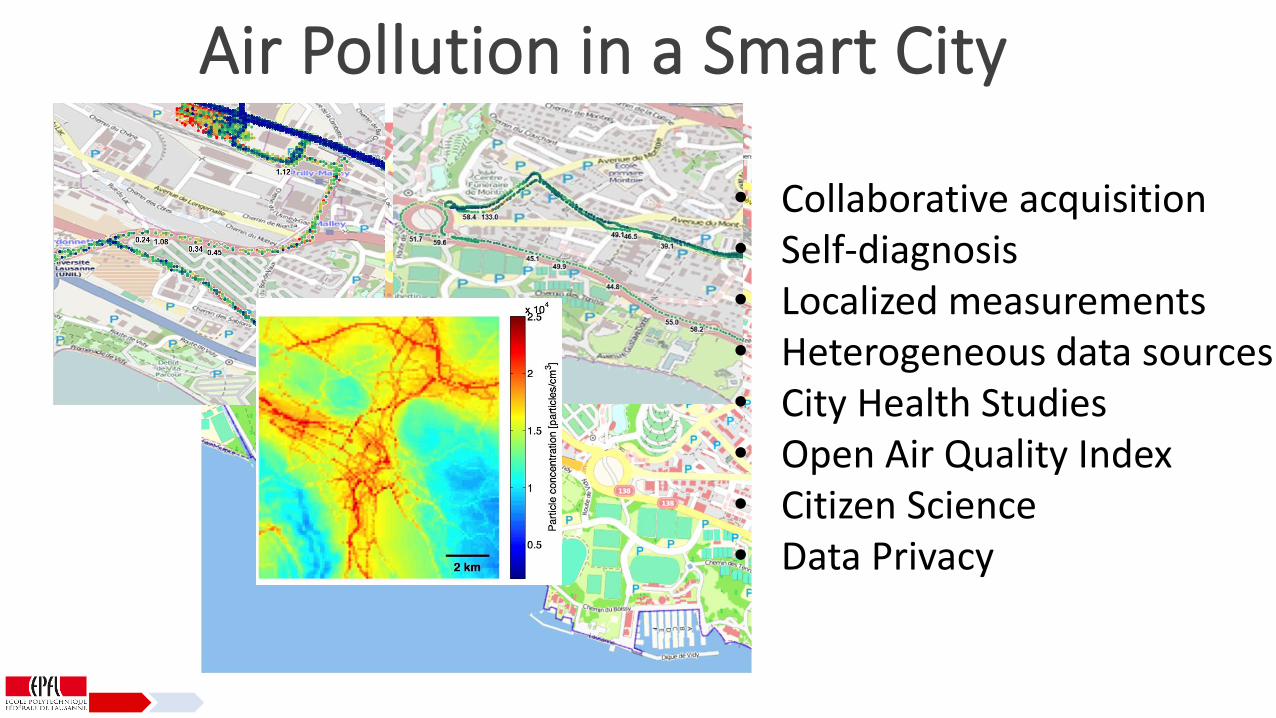
Air Pollution in a Smart City
• Collaborative acquisition• Self-diagnosis• Localized measurements• Heterogeneous data sources• City Health Studies• Open Air Quality Index• Citizen Science• Data Privacy
OpenSense IISensing the air we breath
http://opensense.epfl.ch/
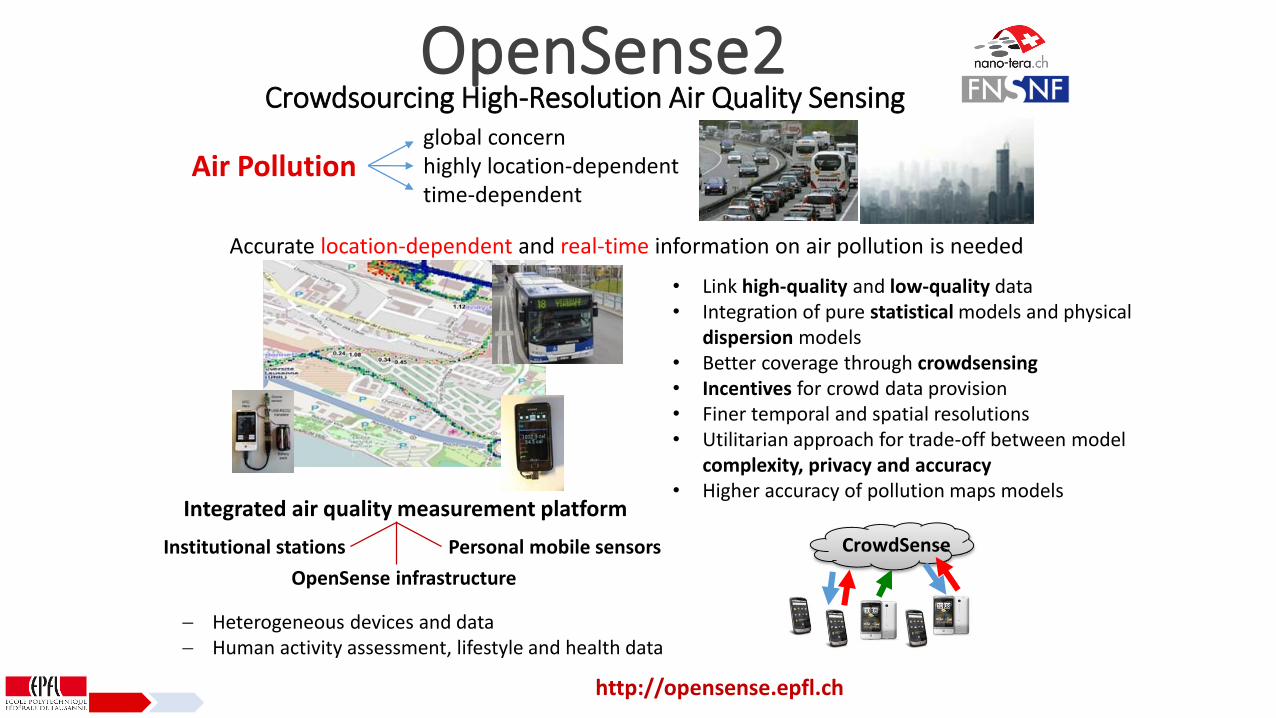
OpenSense2global concernhighly location-dependenttime-dependent
Crowdsourcing High-Resolution Air Quality Sensing
Air Pollution
Accurate location-dependent and real-time information on air pollution is needed
Integrated air quality measurement platform
Heterogeneous devices and data Human activity assessment, lifestyle and health data
• Link high-quality and low-quality data • Integration of pure statistical models and physical
dispersion models• Better coverage through crowdsensing• Incentives for crowd data provision• Finer temporal and spatial resolutions• Utilitarian approach for trade-off between model
complexity, privacy and accuracy• Higher accuracy of pollution maps models
http://opensense.epfl.ch
Institutional stations
OpenSense infrastructure
Personal mobile sensors CrowdSense
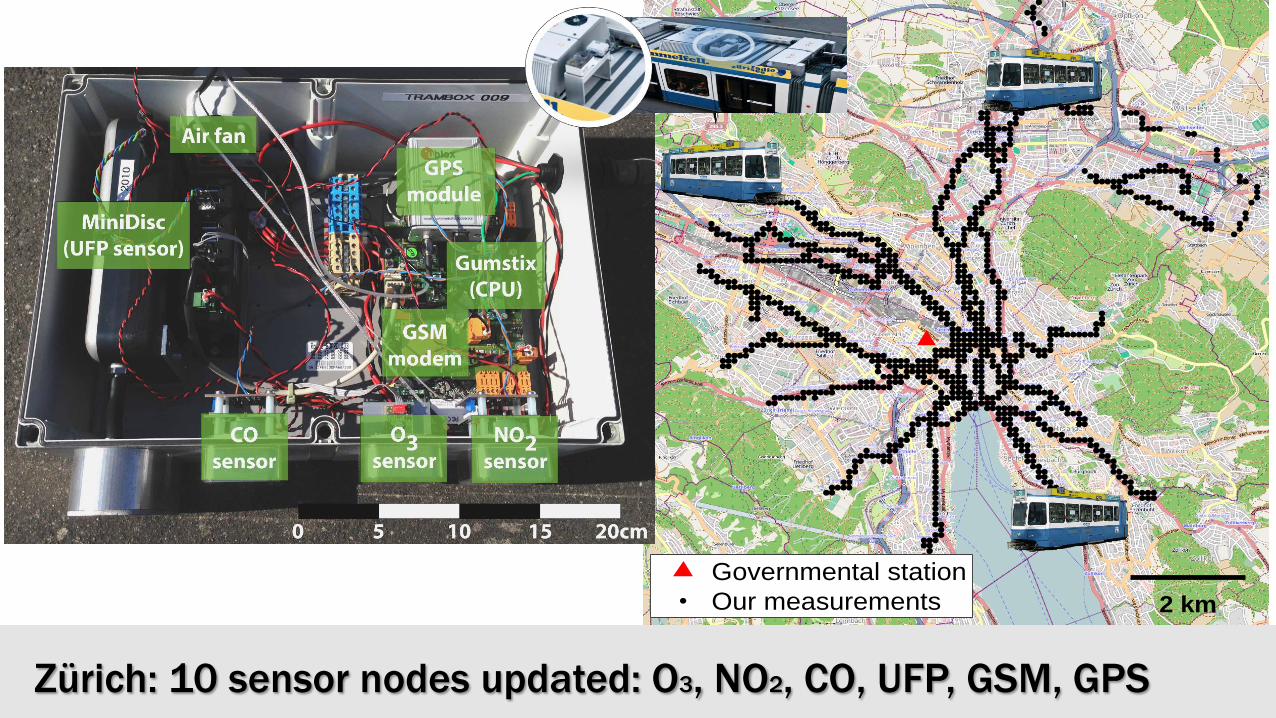
2 km
Governmental station
Our measurements
Zürich: 10 sensor nodes updated: O3, NO2, CO, UFP, GSM, GPS
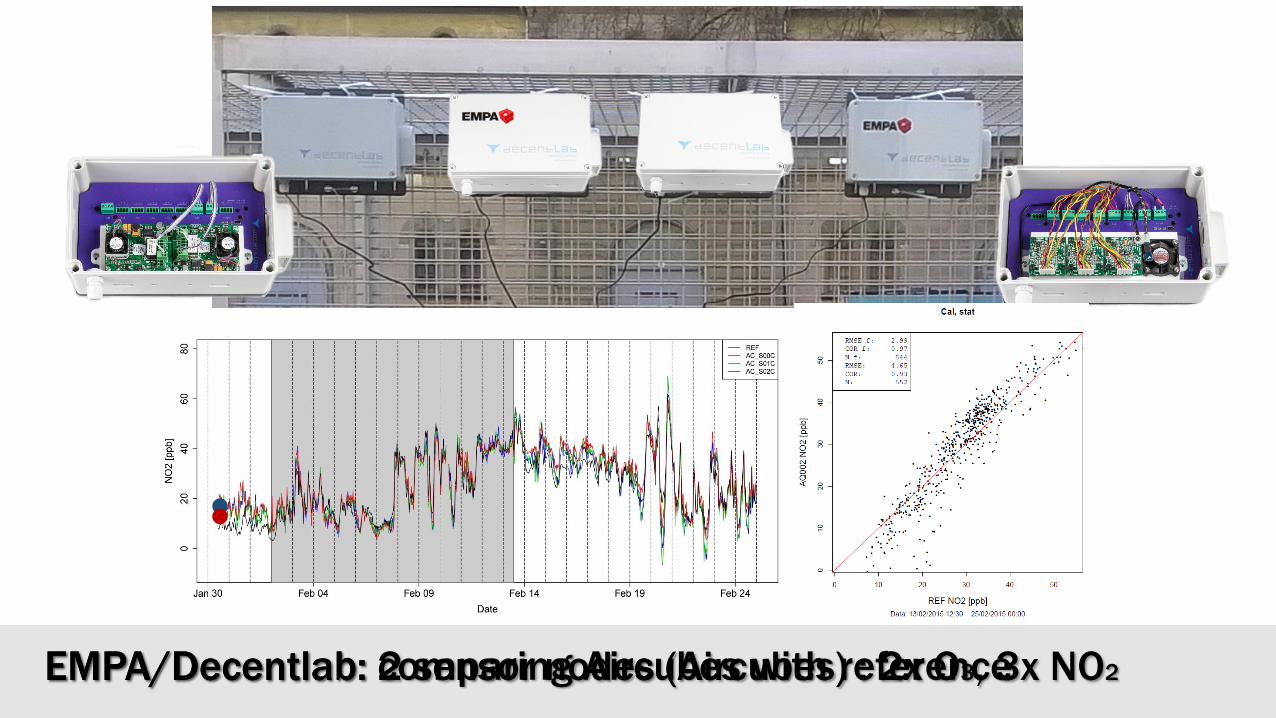
EMPA/Decentlab: 2 sensor nodes (Aircubes) : 2x O3, 3x NO2EMPA/Decentlab: comparing Aircubes with reference
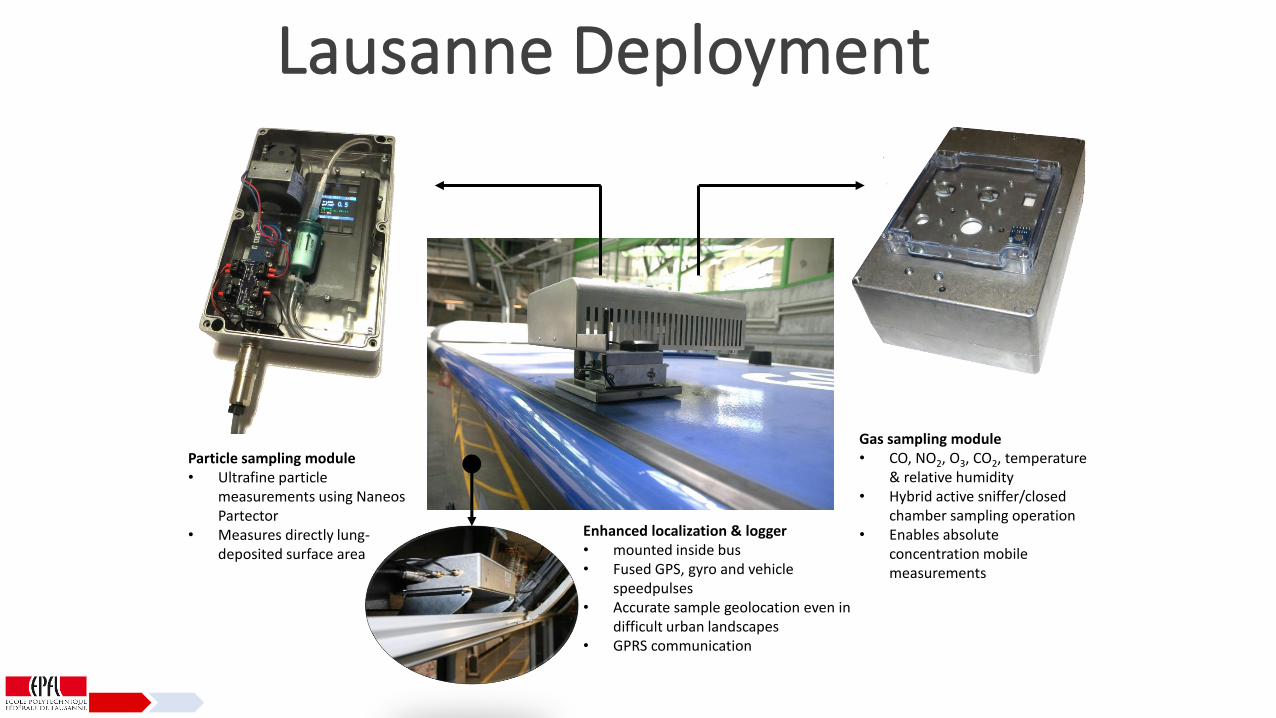
Lausanne Deployment
Particle sampling module• Ultrafine particle
measurements using NaneosPartector
• Measures directly lung-deposited surface area
Gas sampling module• CO, NO2, O3, CO2, temperature
& relative humidity • Hybrid active sniffer/closed
chamber sampling operation• Enables absolute
concentration mobile measurements
Enhanced localization & logger• mounted inside bus• Fused GPS, gyro and vehicle
speedpulses• Accurate sample geolocation even in
difficult urban landscapes• GPRS communication
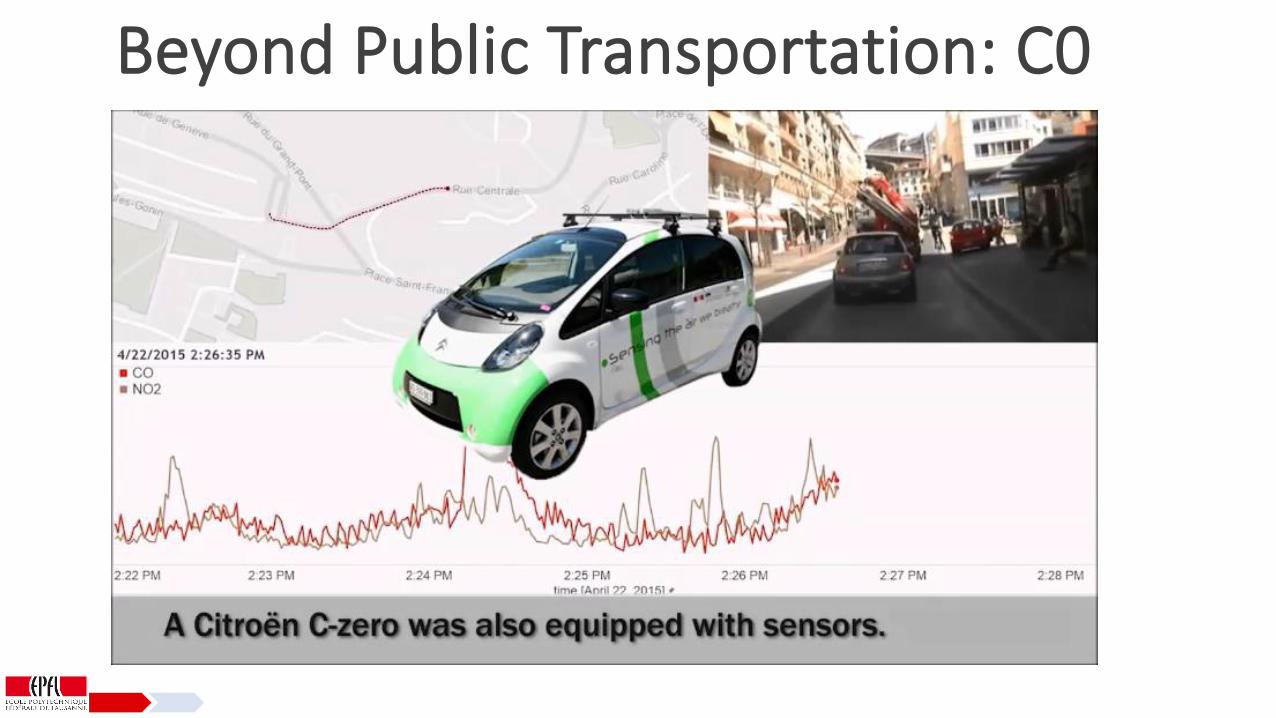
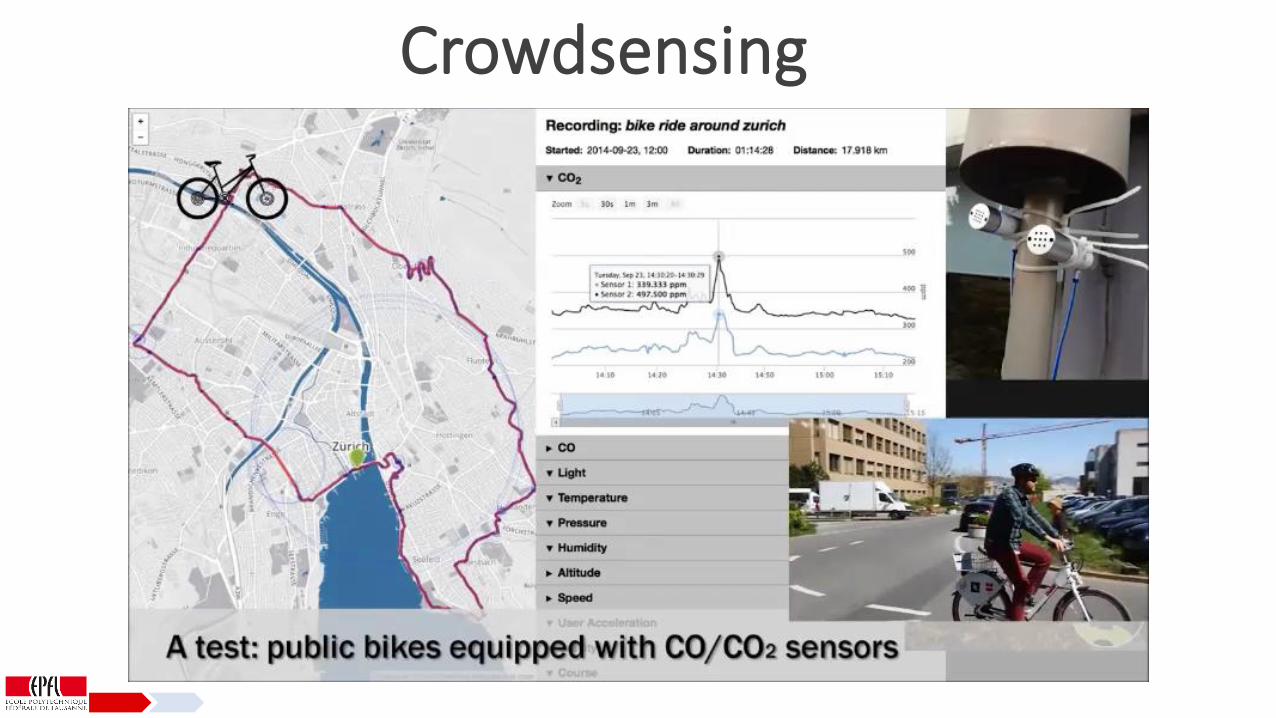
Beyond Public Transportation: C0
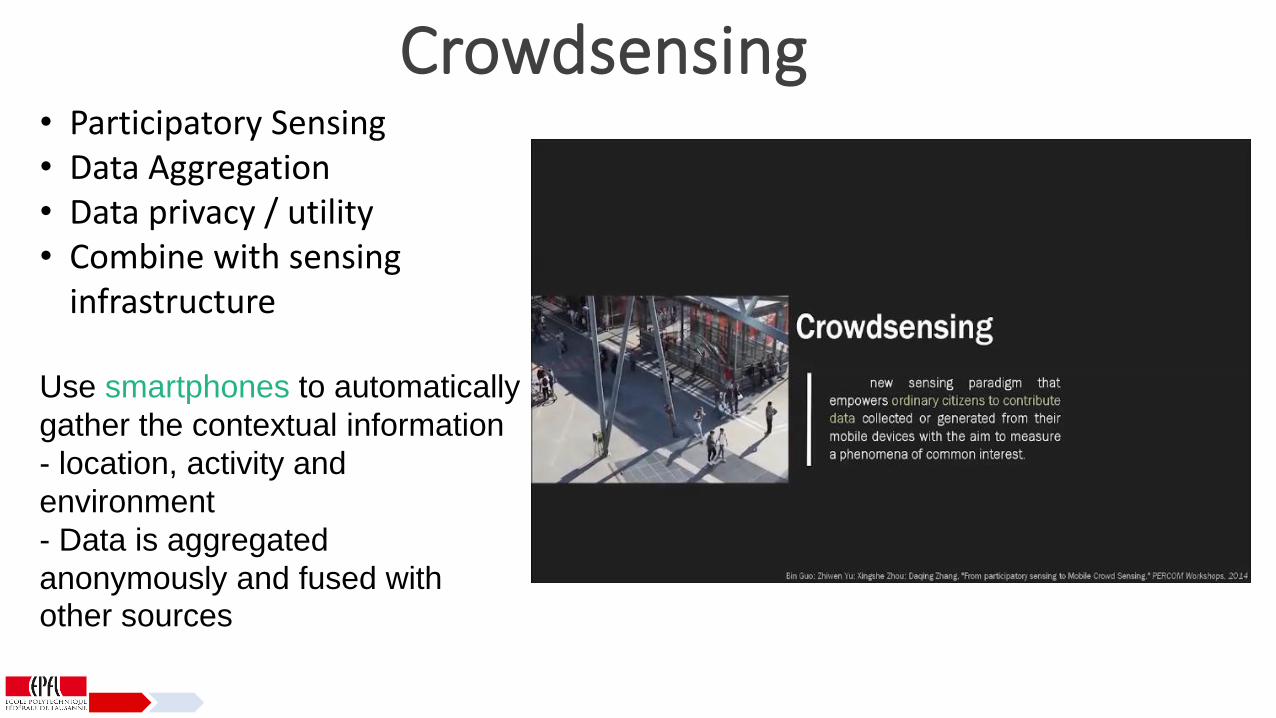
Crowdsensing• Participatory Sensing• Data Aggregation• Data privacy / utility• Combine with sensing
infrastructure
Use smartphones to automatically
gather the contextual information
- location, activity and
environment
- Data is aggregated
anonymously and fused with other sources
Crowdsensing
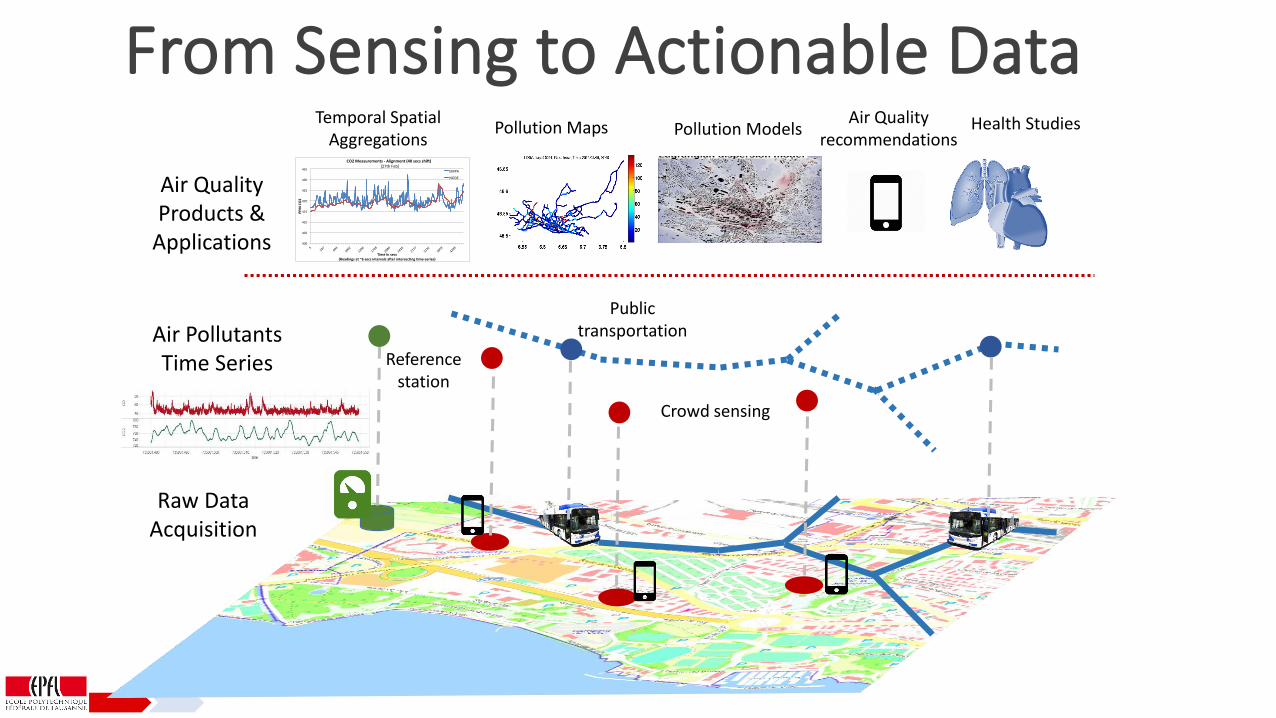
Reference station
Crowd sensing
Public transportation
Raw Data Acquisition
Air Pollutants Time Series
Temporal Spatial Aggregations
Pollution Maps Pollution ModelsAir Quality
recommendationsHealth Studies
Air Quality Products &
Applications
From Sensing to Actionable Data
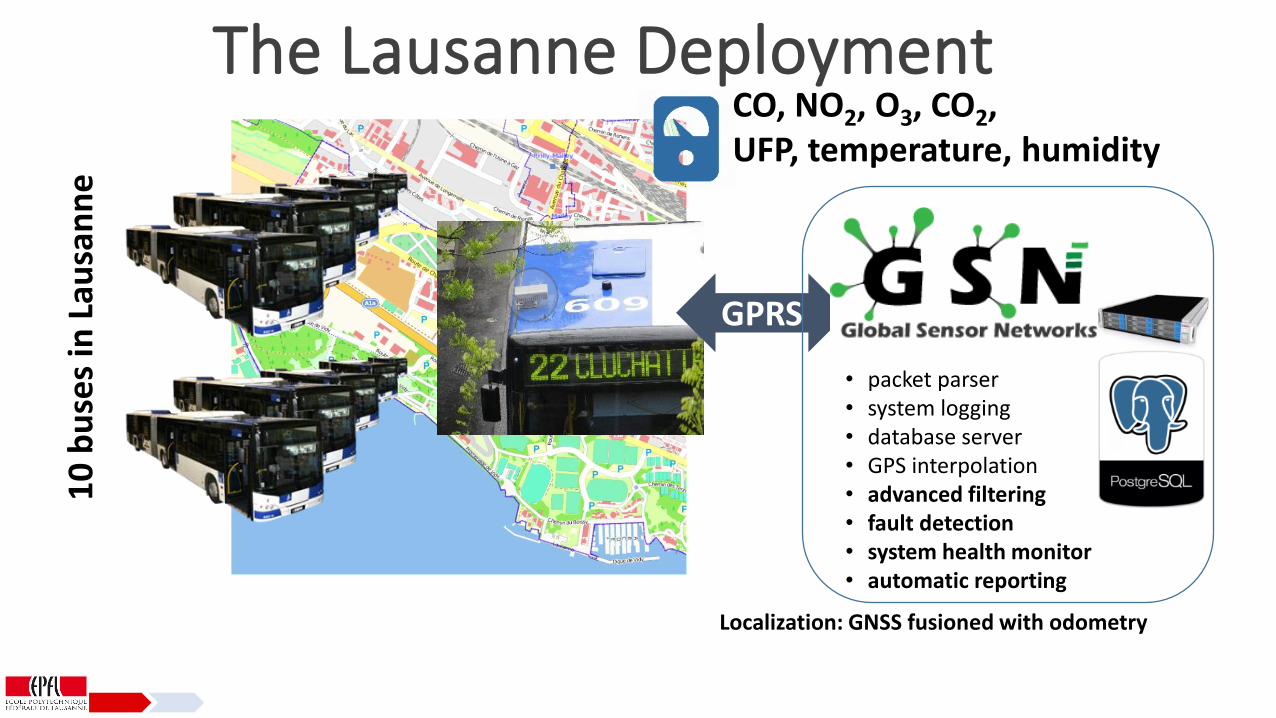
Localization: GNSS fusioned with odometry
GPRS
• packet parser• system logging• database server• GPS interpolation• advanced filtering• fault detection• system health monitor• automatic reporting
10
bu
ses
in L
ausa
nn
eCO, NO2, O3, CO2, UFP, temperature, humidity
The Lausanne Deployment
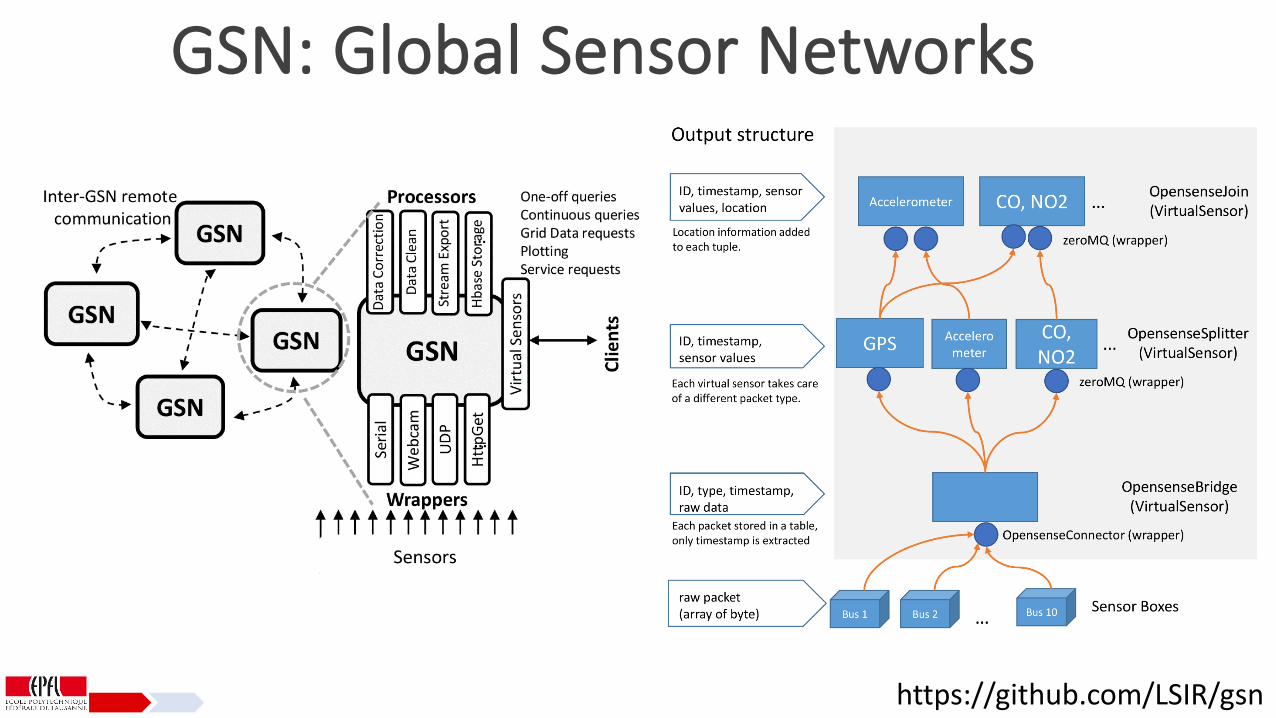
GSN: Global Sensor Networks
https://github.com/LSIR/gsn
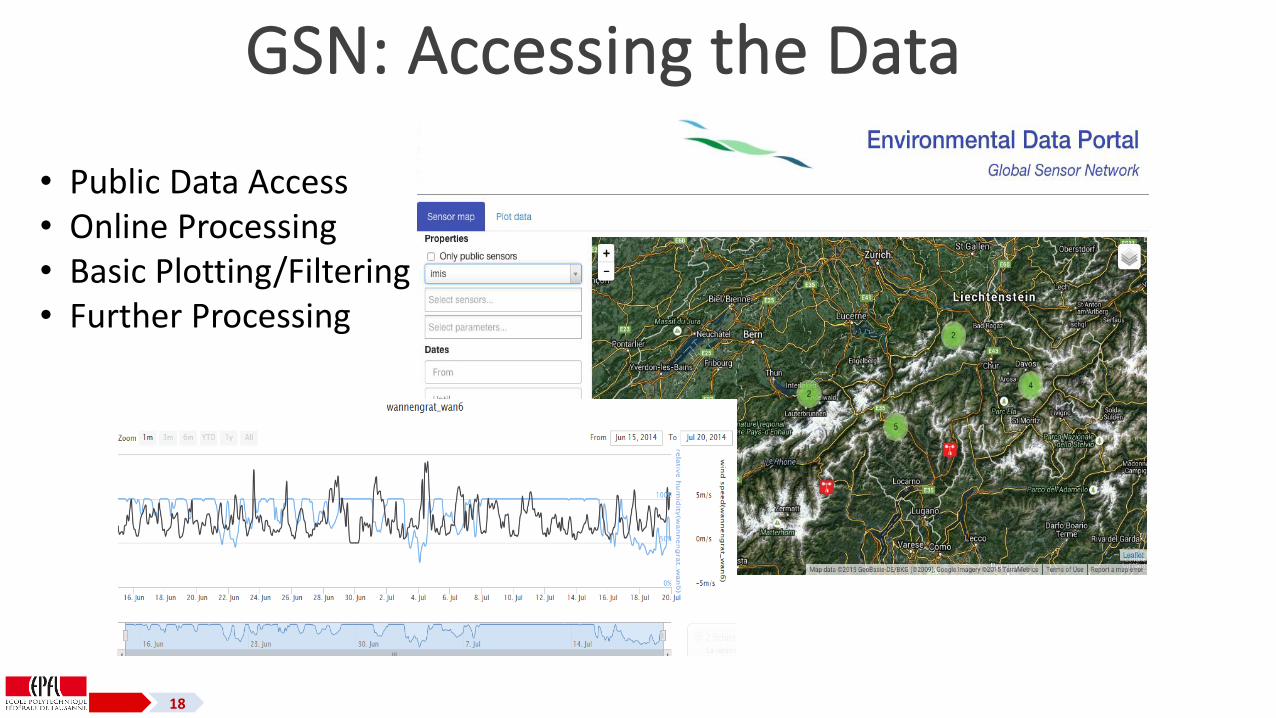
GSN: Accessing the Data
18
• Public Data Access• Online Processing• Basic Plotting/Filtering• Further Processing
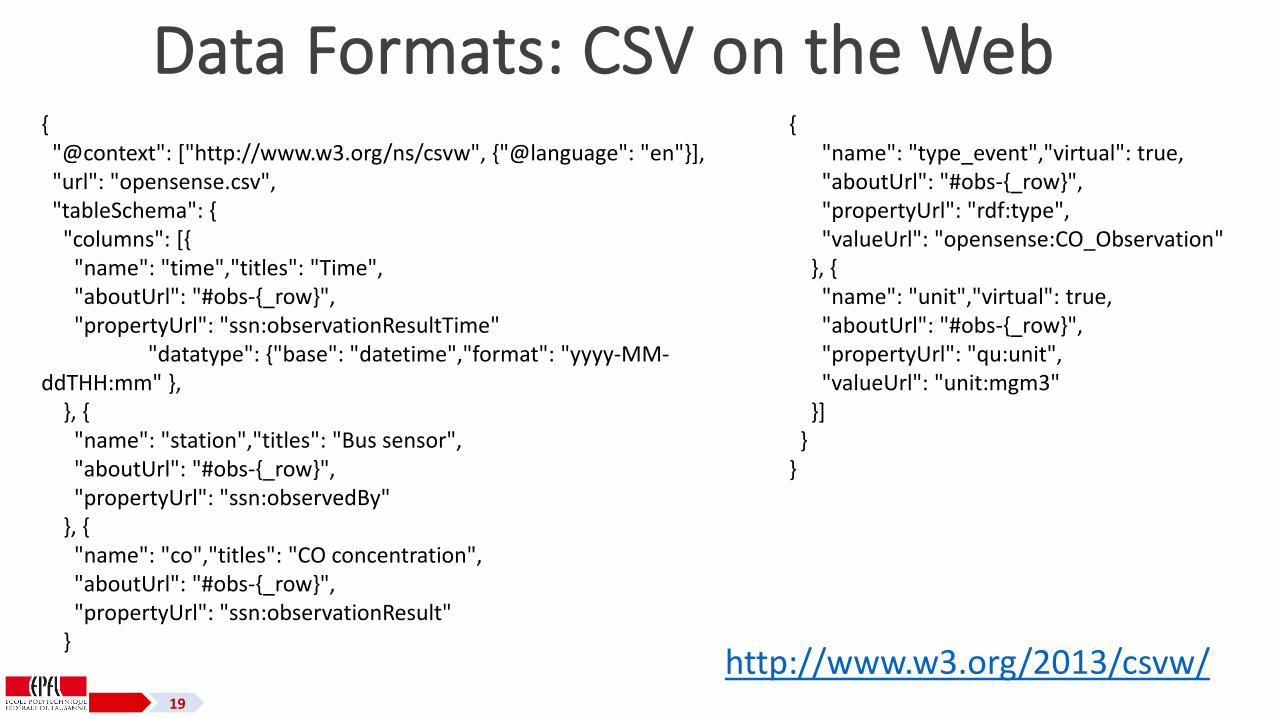
Data Formats: CSV on the Web
19
{"name": "type_event","virtual": true,"aboutUrl": "#obs-{_row}","propertyUrl": "rdf:type","valueUrl": "opensense:CO_Observation"
}, {"name": "unit","virtual": true,"aboutUrl": "#obs-{_row}","propertyUrl": "qu:unit","valueUrl": "unit:mgm3"
}]}
}
{"@context": ["http://www.w3.org/ns/csvw", {"@language": "en"}],"url": "opensense.csv","tableSchema": {
"columns": [{"name": "time","titles": "Time","aboutUrl": "#obs-{_row}","propertyUrl": "ssn:observationResultTime"
"datatype": {"base": "datetime","format": "yyyy-MM-ddTHH:mm" },
}, {"name": "station","titles": "Bus sensor","aboutUrl": "#obs-{_row}","propertyUrl": "ssn:observedBy"
}, {"name": "co","titles": "CO concentration","aboutUrl": "#obs-{_row}","propertyUrl": "ssn:observationResult"
}http://www.w3.org/2013/csvw/
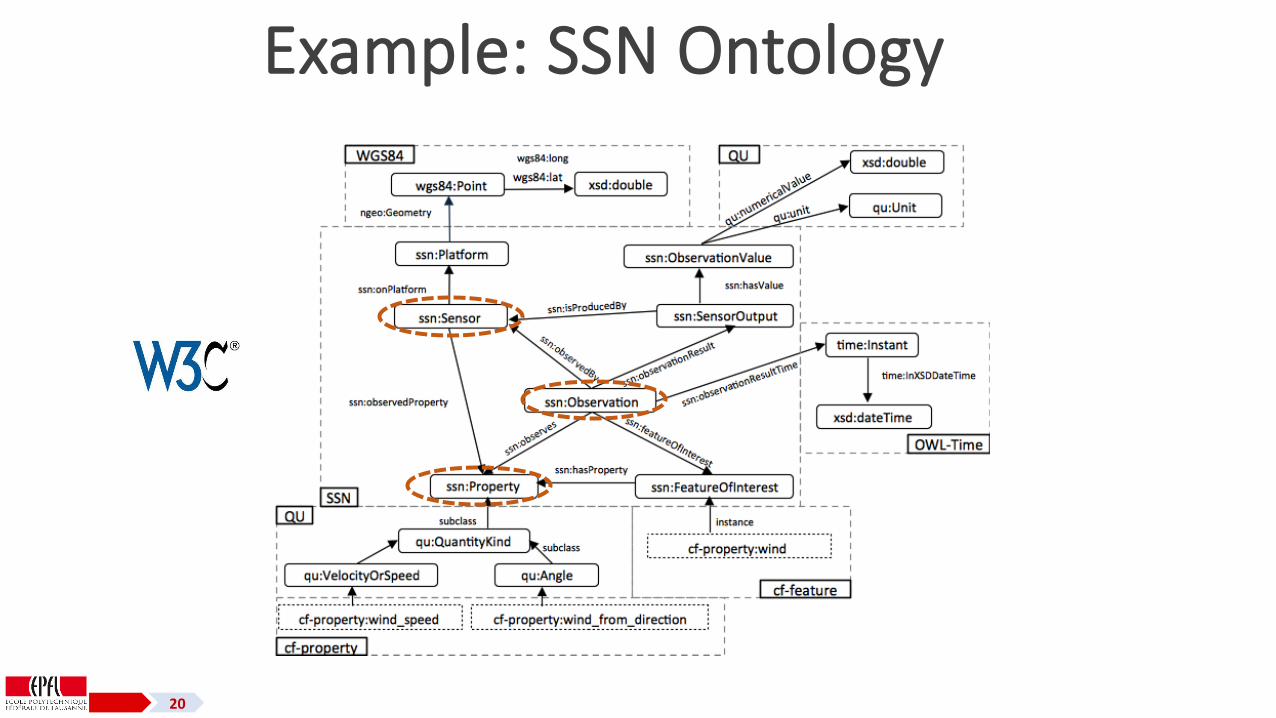
Example: SSN Ontology
20
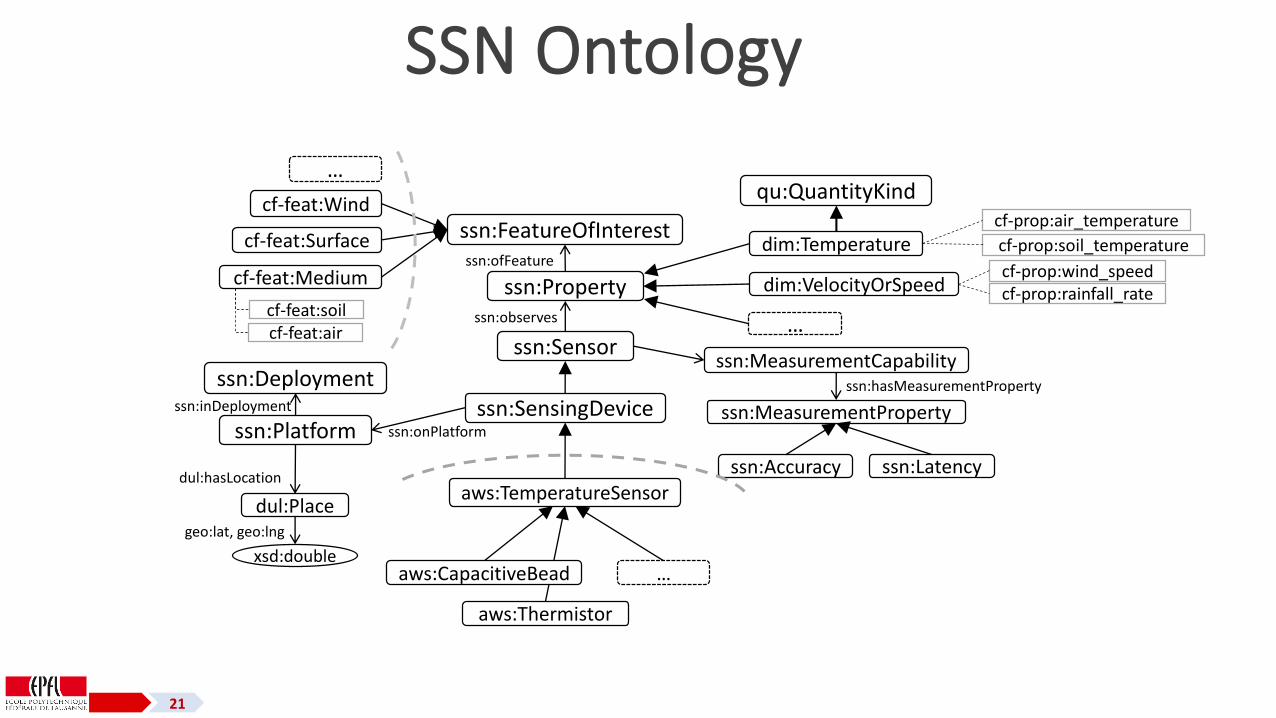
SSN Ontology
21
ssn:Sensor
ssn:Platform
ssn:FeatureOfInterest
ssn:Deployment
ssn:Property
cf-prop:air_temperature
ssn:observes
ssn:onPlatform
dul:Place
dul:hasLocation
ssn:SensingDevicessn:inDeployment
ssn:MeasurementCapability
ssn:MeasurementProperty
geo:lat, geo:lng
xsd:double
ssn:hasMeasurementProperty
ssn:Accuracy
ssn:ofFeature
aws:TemperatureSensor
aws:Thermistor
ssn:Latency
dim:Temperature
qu:QuantityKind
cf-prop:soil_temperature
cf-feat:Wind
cf-feat:Surface
cf-feat:Medium
cf-feat:aircf-feat:soil
dim:VelocityOrSpeedcf-prop:wind_speedcf-prop:rainfall_rate
aws:CapacitiveBead …
…
…
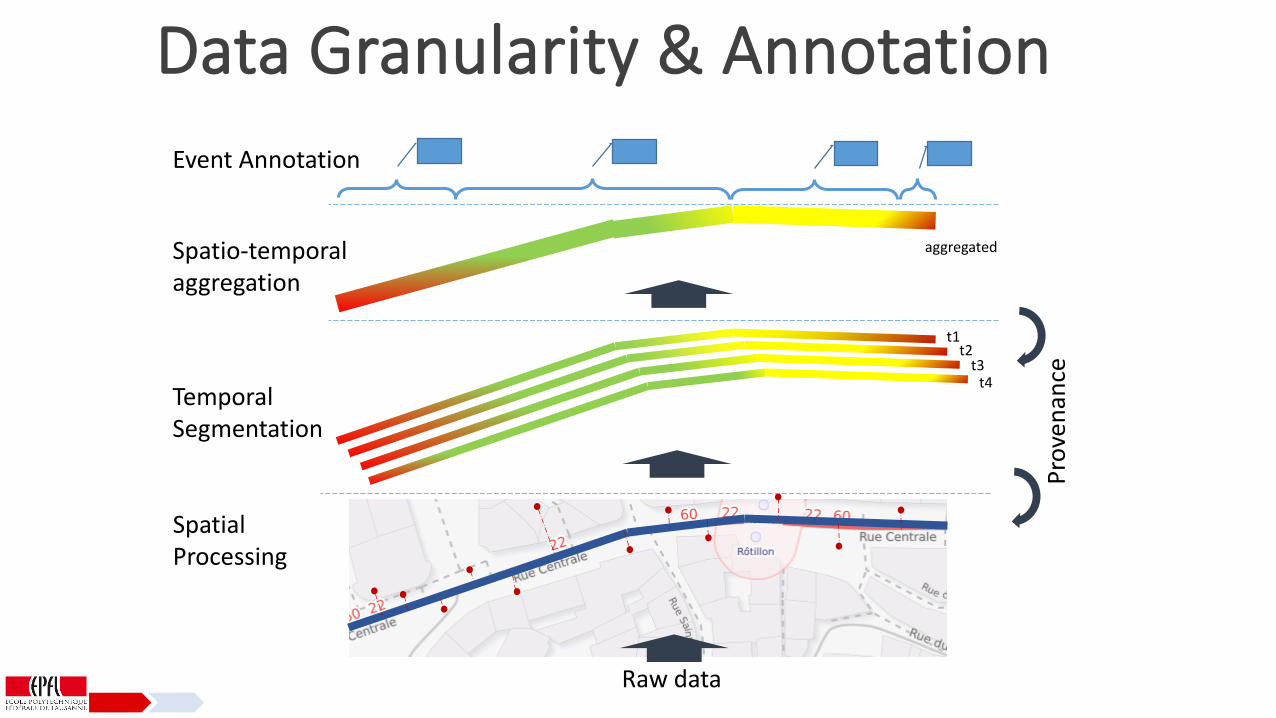
t1t2
t3t4
aggregated
Pro
ven
ance
Raw data
Spatio-temporal aggregation
Event Annotation
Temporal Segmentation
Spatial Processing
Data Granularity & Annotation
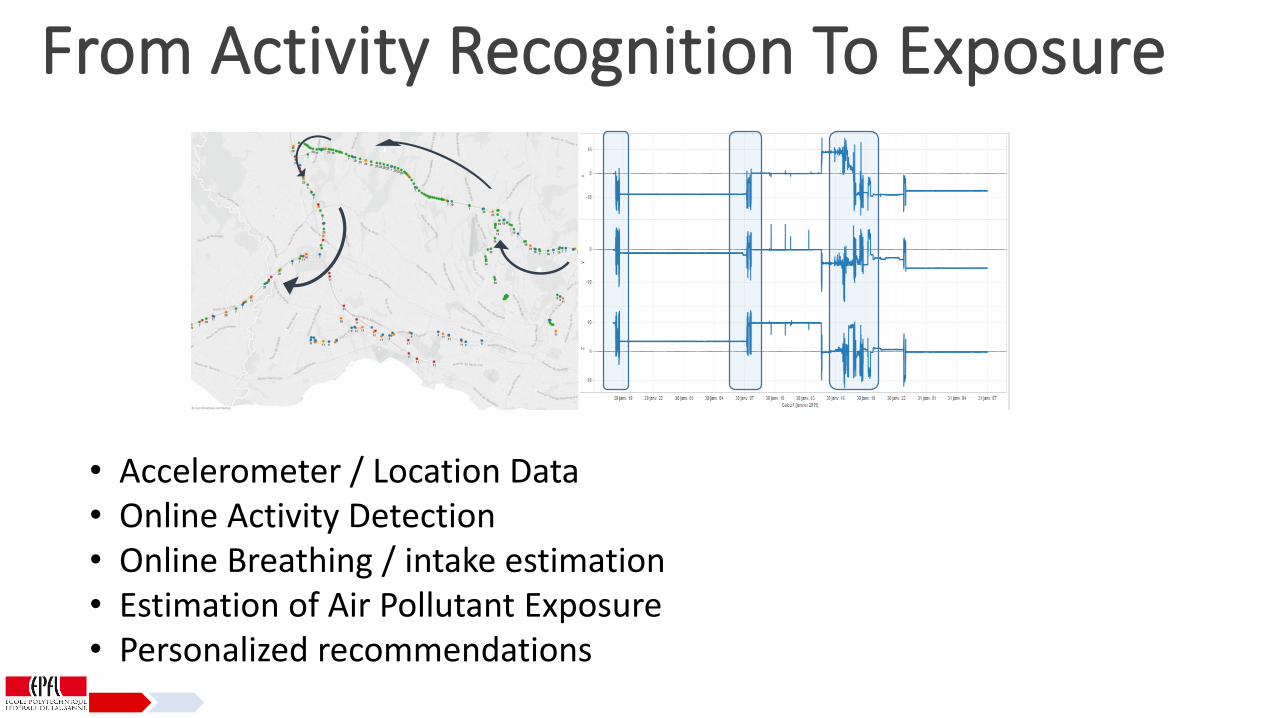
From Activity Recognition To Exposure
• Accelerometer / Location Data• Online Activity Detection• Online Breathing / intake estimation• Estimation of Air Pollutant Exposure• Personalized recommendations
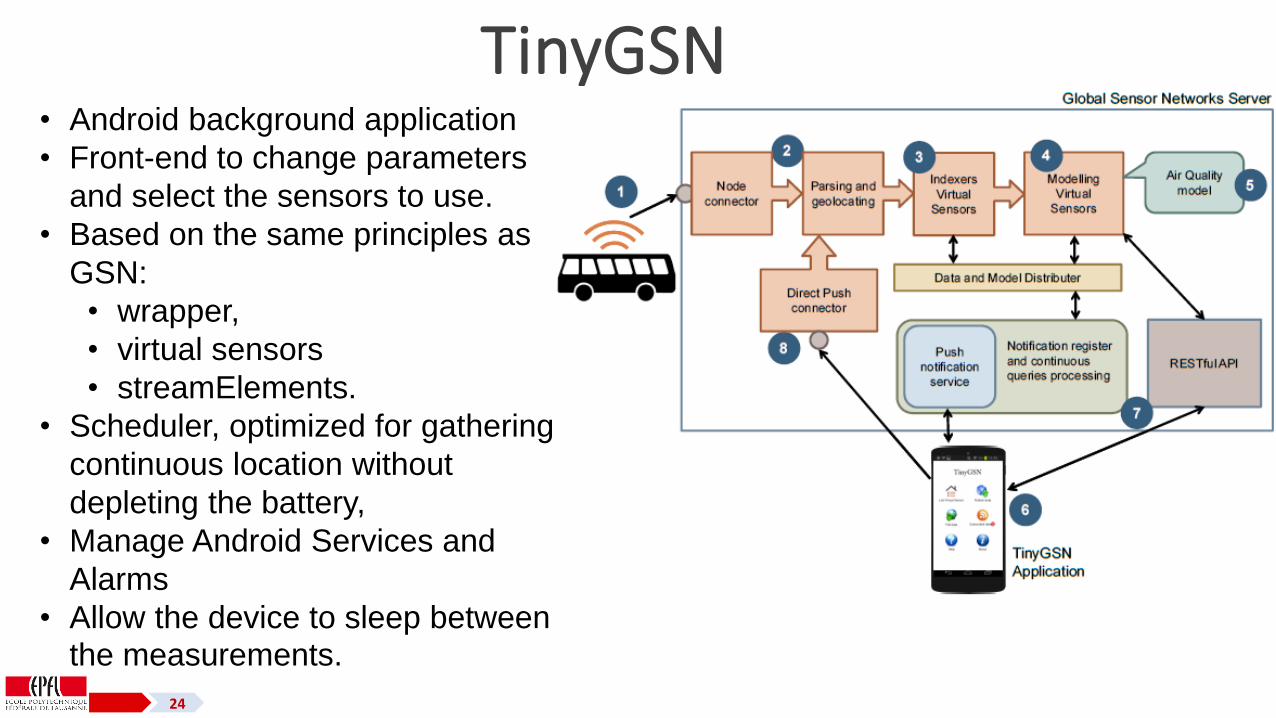
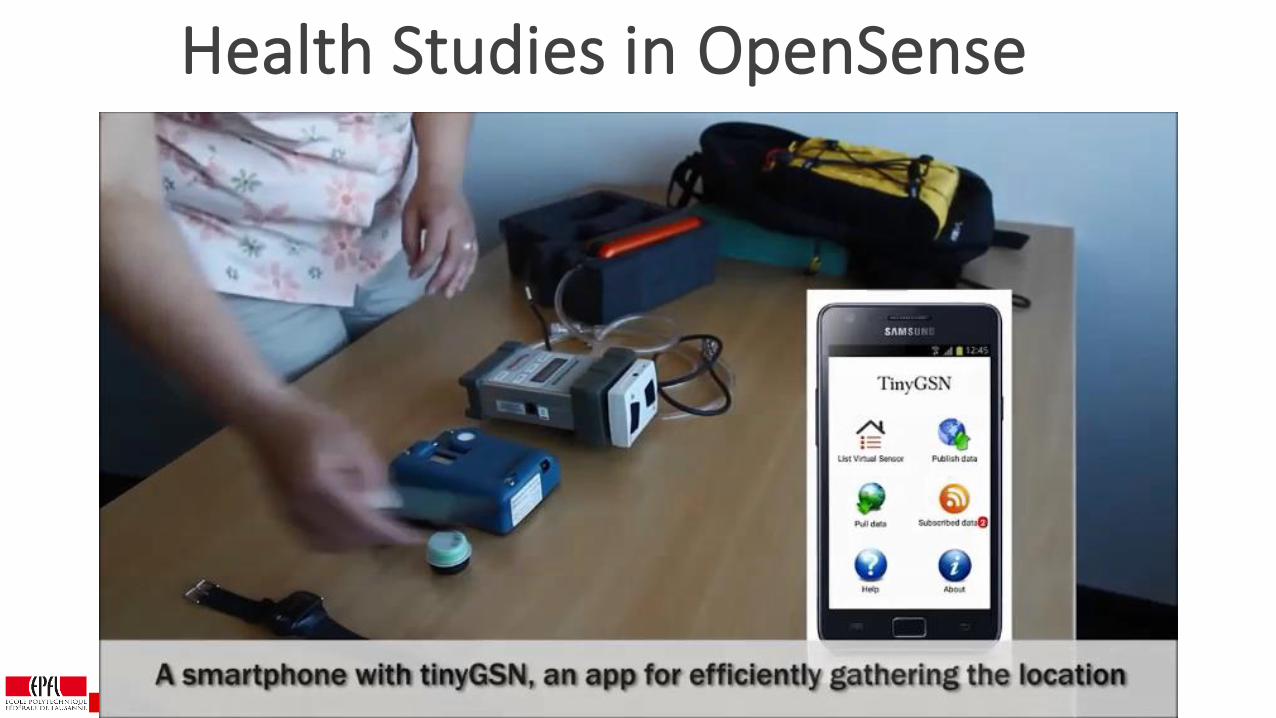
TinyGSN
24
• Android background application
• Front-end to change parameters
and select the sensors to use.
• Based on the same principles as
GSN:
• wrapper,
• virtual sensors
• streamElements.
• Scheduler, optimized for gathering
continuous location without
depleting the battery,
• Manage Android Services and
Alarms
• Allow the device to sleep between the measurements.
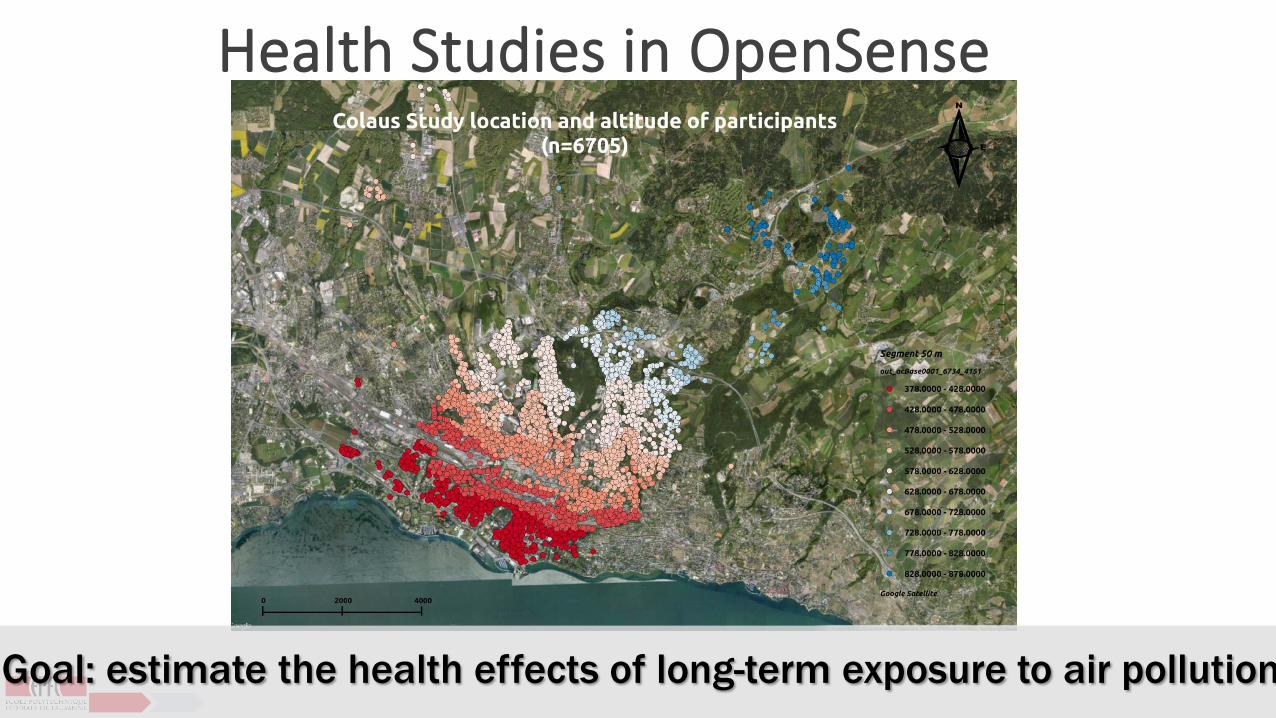
Goal: estimate the health effects of long-term exposure to air pollution
Health Studies in OpenSense
Health Studies in OpenSense
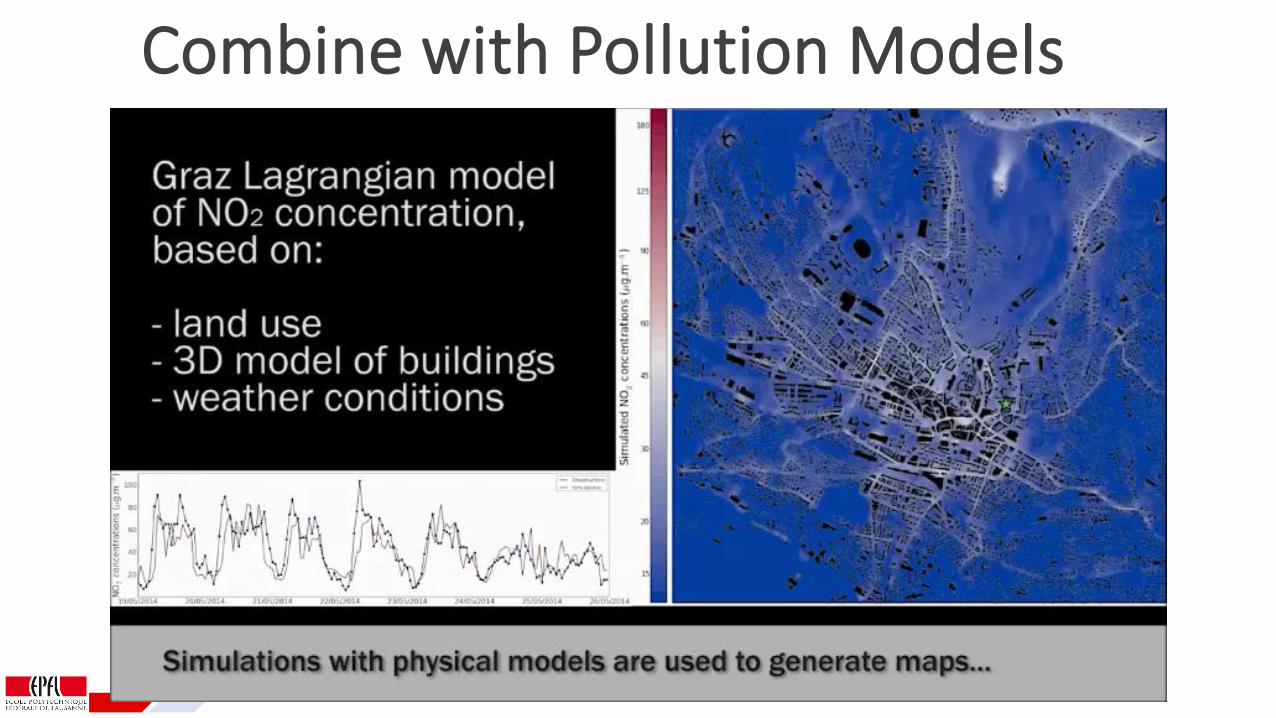
Combine with Pollution Models
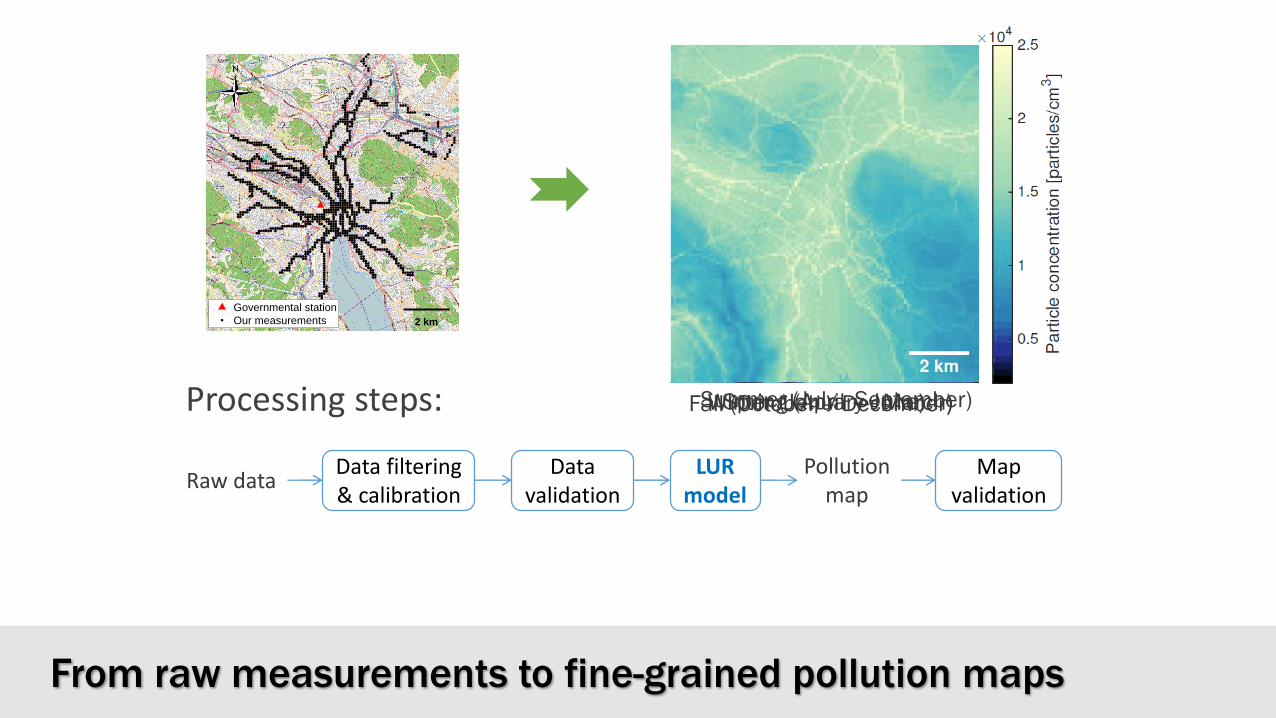
Data filtering & calibration
Data validation
LUR model
Pollutionmap
Raw data
Processing steps:
Mapvalidation
2 km
Governmental station
Our measurements
From raw measurements to fine-grained pollution maps
Winter (January - March)Spring (April – June)Summer (July - September)Fall (October – December)
OpenSense: Air Pollution in Smart cities
• Data quality and curation• Failure and Noise handling• Semantic Layers of Data for different purposes• Privacy protection• Air qualitymodels and data fusion• Incentives for participatory sensing• Personalized health recommendations

Muchas gracias!
Jean-Paul CalbimonteLSIR EPFL
@jpcik