Embed Size (px)
Citation preview
Linux Performance Benchmarking Report
@nephoscale // www.nephoscale.com
(855) NEPHOS-9 United States - (855) 637-4679International - +1 (408) 599-7008

Proudly Made in Silicon Valley
MethodologyThe objective of the test suite was to show out-of-the-box performance for cloud servers across multiple cloud hosting vendors. The following steps were performed to run the tests on NephoScale and other industry leading cloud IaaS providers.
1. A virtual server instance in the cost range provided was provisioned for each vendor in the matrix.
2. The open-source CloudBench tool was then downloaded, and without any post provisioning modifications of the VM, the tool was run and the data recorded.
3. CloudBench uses industry standard benchmark tests for Linux servers, including Phoronix Test Suite, fio, ioping, and IOzone and logs the combined output in any easy to read format.
4. All tests we performed using Ubuntu Precise 14.04 64-bit and Python 2.7, and the default parameters were provided when running CloudBench.
5. All pricing and performance data is accurate as of September 1st, 2014.
Benchmarking Methodology
2

Proudly Made in Silicon Valley
IOZone Write Performance Test
3
IOZone data in MB/s averaged across Linux virtual servers within the cost categoryVM Price Range NephoScale Digital Ocean AWS GCE Linode Rackspace Soft Layer$0.007 - $0.02 138 30 4 124 $0.022 - $0.06 166 20 9 115 37
$0.07 - $0.09 152 12 19 33 61$0.1- $0.12 172 1 13 101 54
$0.16 - $0.18 133 20 16 65$0.21 - $0.27 130 24 15 161 69$0.32 - $0.68 144 36 16 23 125 24 51$0.72 - $0.96 128 30 15 140 55$1.08 - $2.72 15 23 149 11
• The IOZone write performance test measures the throughput of writing 16KB records to a 512MB file using Direct I/O
• Measured in MB/s this statistic is a good indicator of raw bandwidth available for writing a file sequentially to the file system

Proudly Made in Silicon Valley
IOZone Read Performance Test
4
IOZone data in MB/s averaged across Linux virtual servers within the cost categoryHourly Price
Range NephoScale Digital Ocean AWS GCE Linode Rackspace Soft Layer$0.007 - $0.02 190 92 4 131 $0.022 - $0.06 181 134 14 143 59
$0.07 - $0.09 216 33 17 54 95$0.1- $0.12 213 242 48 110 77
$0.16 - $0.18 211 16 19 111$0.21 - $0.27 144 160 48 193 104$0.32 - $0.68 186 149 38 17 175 66 72$0.72 - $0.96 214 179 39 187 86$1.08 - $2.72 35 17 175 59 81
• The IOZone read performance test measures the throughput of reading 16KB records from a 512MB file using Direct I/O
• Measured in MB/s this
statistic is a good indicator of raw bandwidth available for reading a file sequentially from the file system

Proudly Made in Silicon Valley
FIO Random Write IOPs Performance Test
5
FIO data in 4k blocks averaged across Linux virtual servers within the cost categoryHourly Price
Range NephoScale Digital Ocean AWS GCE Linode Rackspace Soft Layer$0.007 - $0.02 9716 2235 275 7654 $0.022 - $0.06 11237 2289 652 7505 5294
$0.07 - $0.09 12254 1033 1355 4371 1212$0.1- $0.12 9569 211 1263 6039 1551
$0.16 - $0.18 11910 1426 4083 2335$0.21 - $0.27 8338 1692 1009 10006 2333$0.32 - $0.68 11701 2466 1260 1688 8386 5221 1205$0.72 - $0.96 11272 1811 1234 8192 1191$1.08 - $2.72 1112 1759 8855 5674 2033
• The FIO (Flexible I/O) random write performance test measures the rate of Input/Output operations per second while writing 4KB blocks randomly to a 512MB file using synchronous Direct I/O
• Measured in IOPs this statistic is
a good indicator of the average number of system calls per unit time achievable for random write operations to a file in the file system

Proudly Made in Silicon Valley
FIO Random Read IOPs Performance Test
6
FIO data in 4k blocks averaged across Linux virtual servers within the cost categoryHourly Price
Range NephoScale Digital Ocean AWS GCE Linode Rackspace Soft Layer$0.007 - $0.02 9528 6140 337 7513 $0.022 - $0.06 12570 7548 922 6102 3641
$0.07 - $0.09 13468 2364 1000 3259 507$0.1- $0.12 14397 8378 3064 5259 3254
$0.16 - $0.18 12958 1075 2711 6427$0.21 - $0.27 11261 9291 3064 11788 6763$0.32 - $0.68 11313 8940 2680 1160 5957 3851 553$0.72 - $0.96 9392 9598 2651 7058 533$1.08 - $2.72 2394 1158 8635 4382 5216
• The FIO (Flexible I/O) random read performance test measures the rate of Input/Output operations per second while reading 4KB blocks randomly from a 512MB file using Direct I/O
• Measured in IOPs this statistic is a good indicator of the average number of system calls per unit time achievable for random read operations from a file in the file system

Proudly Made in Silicon Valley
IOPing Latency Performance Test
7
IO Ping data in Micro Seconds averaged across Linux virtual servers within the cost categoryHourly Price
Range NephoScale Digital Ocean AWS GCE Linode Rackspace Soft Layer$0.007 - $0.02 155 250 309 229 $0.022 - $0.06 186 358 316 205 333
$0.07 - $0.09 220 667 318 423 163$0.1- $0.12 149 185 340 239 209
$0.16 - $0.18 249 323 348 225$0.21 - $0.27 180 213 317 138 178$0.32 - $0.68 142 311 560 319 223 367 238$0.72 - $0.96 128 242 500 215 263$1.08 - $2.72 586 319 187 297 328
• The IOPing latency performance test measures the round-trip time (similar to a network ping test) by writing and reading from a file using Direct I/O
• Measured in microseconds this statistic is a good indicator of latency or time it takes for a write followed by a read operation to a file in the file system

Proudly Made in Silicon Valley
CPU Performance Test
8
Multi Core data in Seconds averaged across Linux virtual servers within the cost categoryHourly Price
Range NephoScale Digital Ocean AWS GCE Linode Rackspace Soft Layer$0.007 - $0.02 812 1026 2549 773 $0.022 - $0.06 472 354 1065 242 661
$0.07 - $0.09 221 1111 397 447 714$0.1- $0.12 116 327 422 114 650
$0.16 - $0.18 117 337 194 359$0.21 - $0.27 81 109 221 87 185$0.32 - $0.68 97 67 114 95 65 153 108$0.72 - $0.96 74 61 117 59 68$1.08 - $2.72 33 61 53 83 93
• The CPU performance test measures the time to compile the Linux kernel on a multi-core system
• Measured in seconds this statistic is a good indicator of CPU performance on large standard data set with a variety of data structures (Linux kernel) and a large program with a wide variety of instructions (gcc)
Proudly Made in Silicon Valley
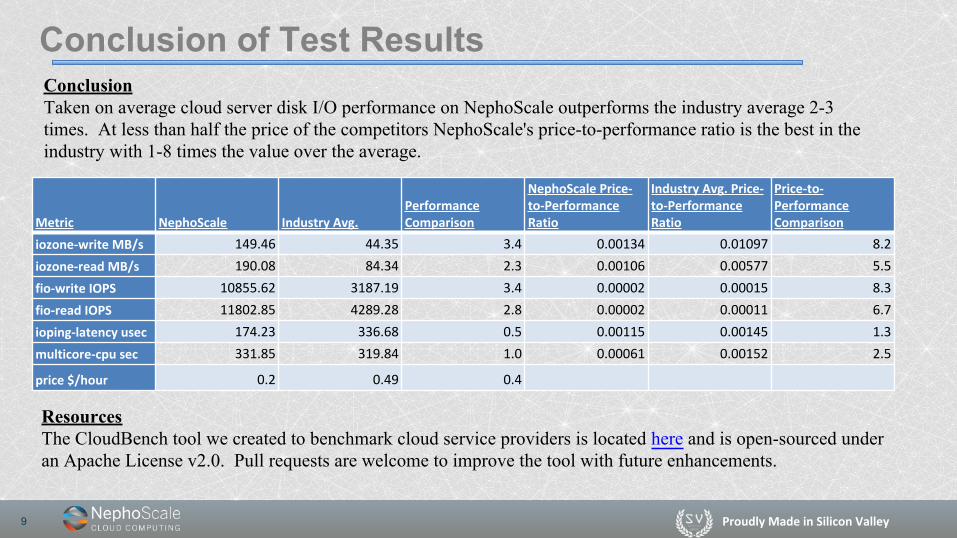
Metric NephoScale Industry Avg.Performance Comparison
NephoScale Price-to-Performance Ratio
Industry Avg. Price-to-Performance Ratio
Price-to-Performance Comparison
iozone-write MB/s 149.46 44.35 3.4 0.00134 0.01097 8.2
iozone-read MB/s 190.08 84.34 2.3 0.00106 0.00577 5.5
fio-write IOPS 10855.62 3187.19 3.4 0.00002 0.00015 8.3
fio-read IOPS 11802.85 4289.28 2.8 0.00002 0.00011 6.7
ioping-latency usec 174.23 336.68 0.5 0.00115 0.00145 1.3
multicore-cpu sec 331.85 319.84 1.0 0.00061 0.00152 2.5
price $/hour 0.2 0.49 0.4
Conclusion of Test Results
9
ConclusionTaken on average cloud server disk I/O performance on NephoScale outperforms the industry average 2-3 times. At less than half the price of the competitors NephoScale's price-to-performance ratio is the best in the industry with 1-8 times the value over the average.
ResourcesThe CloudBench tool we created to benchmark cloud service providers is located here and is open-sourced under an Apache License v2.0. Pull requests are welcome to improve the tool with future enhancements.