Embed Size (px)
Citation preview

News business in the age of platformsHow to respond strategically to digital disruption
Vincent Peyregne CEO WAN-IFRA, the World Association of News Publishers@vincentpeyregne

!"#$%&"'!"#$%&'()%$#*+(,-.(/%0$.)+$1

WAN-IFRA members can download the report here
wan-ifra.org/facebook_report

credit
Grzegorz PiechotaSenior research Fellow Green Templeton College & Reuters Institute, University of OxfordResearch Associate, Harvard Business School. Former news editor, Gazeta Wyborcza, Poland. Author of “Reality Check – making Money with Facebook”, WAN-IFRA 2017

OUR CONVERSATION
TODAY
vincentpeyregne
Publishersneed to have a strategywithplatform
Analysingpublishersbusiness model worldwide: 4 typicalapproaches
How publishersare takingdecisions

A Decade in the Driver’s Seat
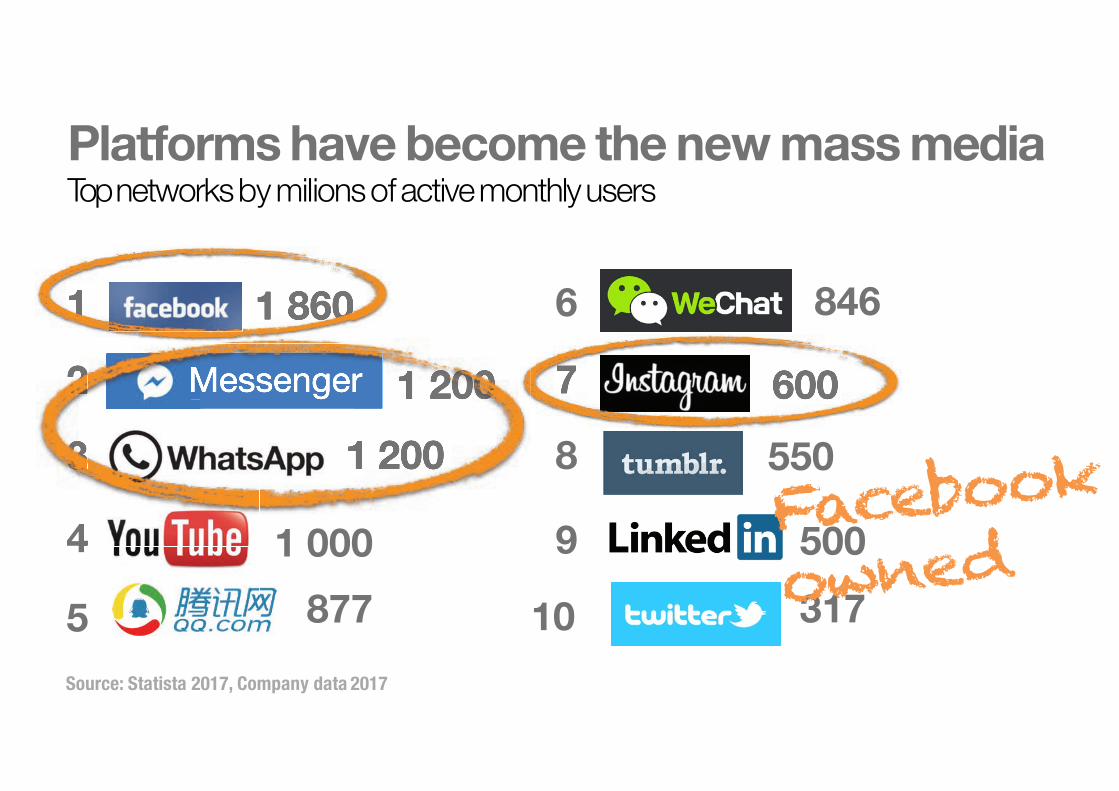
Platforms have become the new mass mediaTopnetworksbymilionsofactivemonthlyusers
Source: Statista 2017, Company data 2017
1
2
3
4
5
6
7
8
9
10
1 860
1 200
4
1 200
Messenger
1 000877
846
600
550
500317
1 1 860
2
3
1 2002
3 11 200
MessengerMessenger 7 600

Publisher’scontentdrivesdailynewsconsumption,engagementonplatforms
Sources: Crowdynews, PEW Internet 2016
62%U.S. adults
got their newslast week on social
media
62%U.S. adults
got their newslast week on social last week on social
media

FAST FORWARD… in 2017 Google is sending more traffic than Facebook to publishers
Source Parse.ly from some2,500 publishers that use its analytics service, 2017

Winners of the attention economyaggregate largest audiences & capture
most of ad revenue
71% USA combined share in 2016
89% their share in new ad spend
2+3$!#45678/9:;75<=8>597?5

Who else captures $ in digital ad ecosystem?
Source: AEMII / Future Media Lab / European Magazine Media Association 2016
$1$0.10
$0.05
$0.15$0.12
$0.15$0.14
$0.29
Advertiser Agency Trading Desk DMP/Data provider
DSP Ad exchange SSP/Ad network
Publisher
companiesShare of ad tech 61%

Average monthlyrevenue
Source: Digital Content Next 2017
What’s the distributed content revenue?Benchmark 17 top U.S. publishers in 1H 2016
Share of paymentsin average total platform revenue
$1.3m60%
platform advertising revenue share +syndication + production fees
of paymentsin average total platform

$27.6bn / 50mFacebook’s ad revenue in2016
Let’s imagine Facebook shares it all
Pagepublishers
Source: Facebook 2017
= $552

What do publishers think and do with platforms?


1st wave of disruption: unbundling
News sites
Opinionsites
Niche verticals (around topics,
personalities, communities)
User generated content(blogs, boards)
Brand websites (product, service pages)
Marketplaces

… unbundling of individual stories
Headline of an article
Visual elements:e.g. picture,
video, graphics
Complements:e.g. comments,
reactions
Text of an article
Text elements:e.g. captions, sidebars
Recommended:e.g. related, earlier, similar stories


erodingValueeroding
Value Valueeroding
Value Valuecreating eroding
Forc
onsu
mer
Noticeads
Consume content
Visit a website Search/ an app for content
Choosemedium / brand
Forp
ublis
her
Value creating
Value creating
Value capturing
Decoupling Platforms, ad-blockers letconsumers avoid value eroding activities or minimise pains
XXXX


Strategic response?

Advocate on the regulatory framework?
Launch your own platforms?Form alliances on data,
technology, single user
sign-in?

Take for granted thatplatforms are not goingaway
Without reach,data & zero costcontent, it’s hard to competedirectly.
Consumers are not going to start loving displayads
1
2

What about chargingother parties
for content itself?

Who pays for digital content at the NY Times?
Consumers
Content marketeers
Retailers
Donors
Syndication

How much money may the Times make?
digital-onlysubscriptions (2016)
branded content (est)affiliatedmarketing (est)
donors (est)
Source: NYT Company, Q4 2016; estimates Greg Piechota based on data reported in trade press
syndication, events, e-commerce (est)
<$60m <$10m >$5m
$232m $77m


Platforms become fishing ponds for customers and expand reach of branded content campaigns

Design the new content portfolio
Optimised foracquisition, retention, upgrade
Contentwith differentbusiness models attached

Evaluation
Awareness & Trial on & off-platform
ContributionReferral
Repeated useon & off-platform
Customer’s need & attention Purchase
Loyalty
Consideration of the paid offer
Use continued on & off-platform
Visitor Subscriber
Customer journeys strongly influenced by newuser behaviour

How come the airlineindustry make record profits at a time when seatmargins are dwindlingthe grand vision of airlines as omni-channelretailers - Ancillary Revenue represents a 264% increase from the 2010
Source: IdeaWorksCompany 2017

Media are becoming shoppable and retailers media companies
How come majorsupermarket chains losemoney on actual sale ofgoods?

How come music revenue grows as digital downloads and CDs fadeStreaming grows and Live music thrives
Total revenue of the music industry USD Million source LSE

Platformsare not yourfriends,
nor enemiesHire them to work for you

Develop a platform strategy
What’s your business model?What’s your end game
on platforms


If you want to chase reachGo Beyond National Boarders
Go Beyond NewsGo Viral

If you accept that you are not mass media anymoreForget about Chasing Reach
Explore your Niche CommunitiesGrow ARPU

Source: GrzegorzPiechota based on NYT financial report

Data is keyBuild your own analytics
capability NOW


Make Better DecisionsTest Value vs. Viability
Customer vs. Business Value First and Foremost
Alignment with Brand & StrategyNot all Platforms Play the same Role
Calculate collateral costsDocumented Process


Guiding Principles A PRELIMINARY CHECK LIST
Ingestible cross-platform user dataPublishers need the platforms to do more to connect user activities across platforms and the publishers’ to understand path to engagement
Direct relationship with the customerPublishers need ownership of the relationship with the customer, including contact data, pricing, bundling, customer experience, customer support
Business drivers: branding, promotion, pricing, paywallControl over branding and promotion, messaging, pricing of the publisher’s bundles, levers that drive the business.


14 web properties35,4 M Unique Visitors 80% market reachRanks #4 after Google Facebook and Microsoft


44 Mio.unique users in Germany
85% of eComerce users
Many fragmented Domestic solutionsdo not reach the critical mass
Amazon portfolio DE First isolated single sign-in German Initiatives
vs. eCommerce
automotive
food retailer
media
logistics
mobile communications
44 Mio.unique users in Germanyunique users in Germanyunique users
85% of eComerce users
Many fragmented Domestic solutionsdo not reach the critical mass
Amazon portfolio DE First isolated single sign-in German Initiatives
vs.vs.vs. eCommerce
automotive
food retailer
media
logistics
mobile communications
vs.
vs.
vs.
vs.
vs.

Dominant global players use of central user accounts to harness their market reach
Amazon account Google-id Apple id Facebook-id Alibaba-id
237702 500
11 228
231237 300
22 482
500800
2281
22811 591
4070
750
1500
2250
3000
Amazon Google Apple Facebook Alibaba
+27%
+60%+64%
+30%
+254%
Amazon account for e-commerce. Cross industries
ID for access, identification, authorization of specific services
ID for access and authentification with a large numbers of other service providers
All-in-One account used to log in many Apple Inc. online services
Alibaba ID for e-commerce proviseur (BtoB, BtoC, CtoC), sales services, e-payment, search-engine, Cloud services
active global users (millions)

THE POWER OF MANYRethink your Alliances
….NEWS ….TV
….BLOGS
….TV ….NICHE
….NEWS
2+3$!#52*$+@@&#


MORE WAN-IFRA REPORTS wan-ifra.org/reports
MORE MARKET INSIGHTS blogs.wan-ifra.org
QUESTIONS ?Vincent PeyrègneCEO, [email protected]
vincentpeyregnevincent.peyregne@wan