Embed Size (px)
Citation preview

Mobile Stats

Aug-12
Oct-12
Dec-12
Feb-13
Apr-13
Jun-13
Aug-13
Oct-13
Dec-13
Feb-14
Apr-14
Jun-14
Aug-14
Oct-14
Dec-14
0
200000
400000
600000
800000
1000000
1200000
1400000
1600000
1800000MobileTabletDesktop
Total Visitors By Device
Mobile visitors across the Vin65 platform (1050 winery websites)..

Aug-12
Oct-12
Dec-12
Feb-13
Apr-13
Jun-13
Aug-13
Oct-13
Dec-13
Feb-14
Apr-14
Jun-14
Aug-14
Oct-14
Dec-14
0.0%
10.0%
20.0%
30.0%
40.0%
50.0%
60.0%
70.0%
80.0%
90.0%MobileTabletDesktop
Device Traffic By Percentage
Mobile traffic is better analyzed with percentages rather than in aggregate.

Aug-12
Oct-12
Dec-12
Feb-13
Apr-13
Jun-13
Aug-13
Oct-13
Dec-13
Feb-14
Apr-14
Jun-14
Aug-14
Oct-14
Dec-14
0.0%
10.0%
20.0%
30.0%
40.0%
50.0%
60.0%
70.0%
80.0%
90.0%
100.0%
MobileTabletDesktop
Sales By Device
Sales on mobile still lag compared to sales on a desktop.

Aug-12
Oct-12
Dec-12
Feb-13
Apr-13
Jun-13
Aug-13
Oct-13
Dec-13
Feb-14
Apr-14
Jun-14
Aug-14
Oct-14
Dec-14
0.0%
5.0%
10.0%
15.0%
20.0%
25.0%
30.0%
35.0%
40.0%
MobileMobile
Mobile Sales vs Mobile Traffic
Mobile sales should match mobile traffic, but they lag behind.
Traffic
Sales

First Time Purchase2nd Time Purchase3rd Time Purchase
2014 Mobile Sales
Repeat buys are more rare on a mobile device.
Mobile Sales on Non-Mobile Site Mobile Sales on Mobile Optimized Site0.00%
2.00%
4.00%
6.00%
8.00%
10.00%
12.00%
14.00%
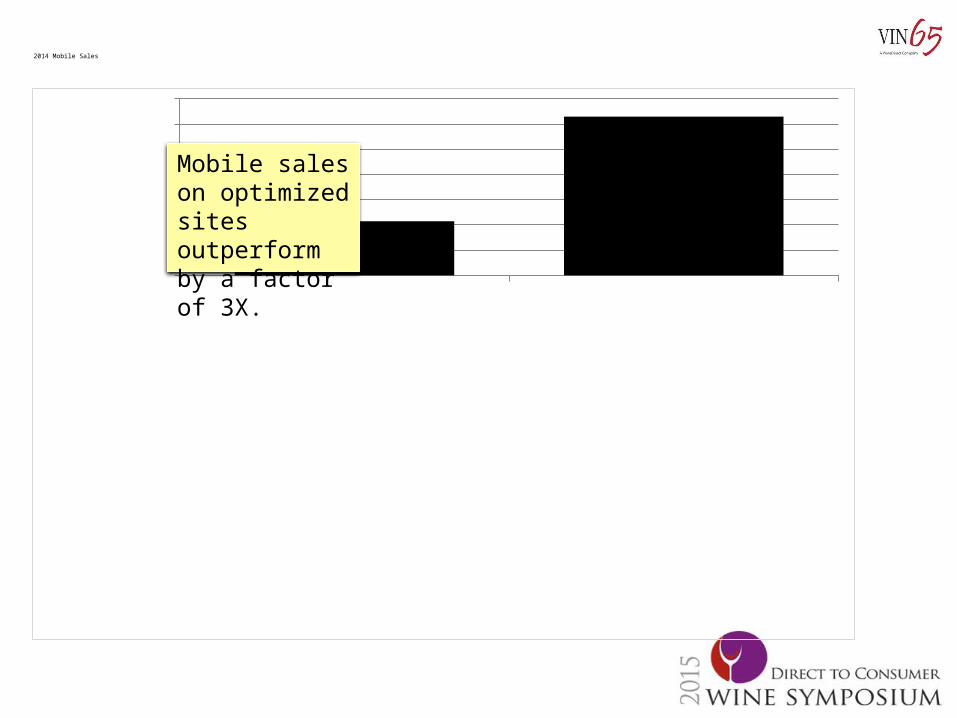
2014 Mobile Sales
Mobile sales on optimized sites outperform by a factor of 3X.

Checkout Contact About Cart Club Events Visit0
200000
400000
600000
800000
1000000
1200000
1400000
2014 Content Viewed On Mobile
Checkout Contact About Cart Club Events Visit Wines0
1000000
2000000
3000000
4000000
5000000
6000000
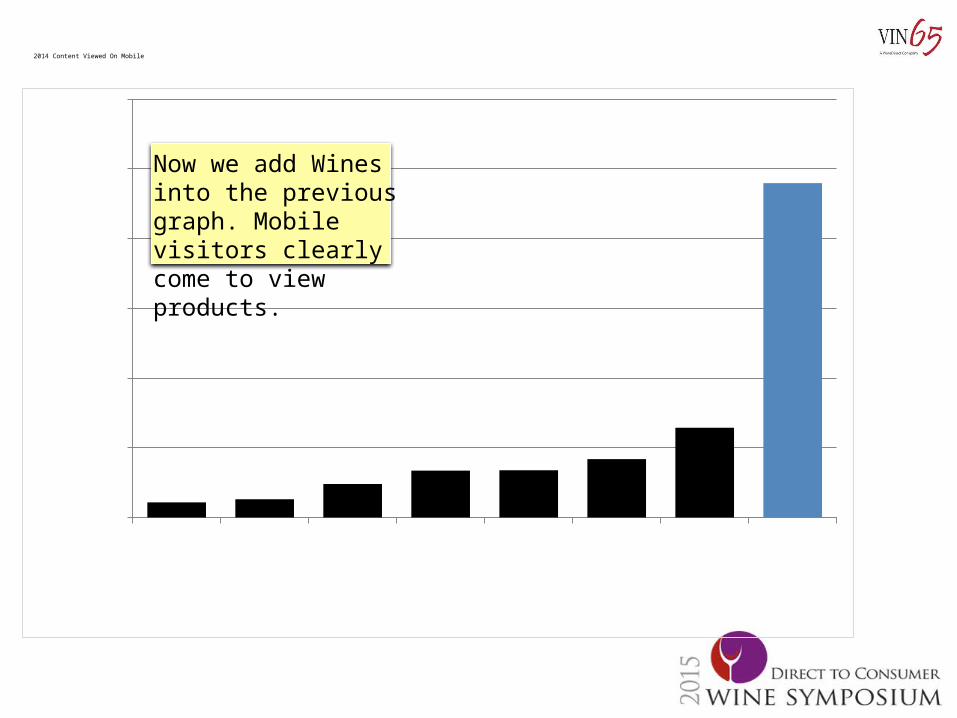
2014 Content Viewed On Mobile
Now we add Wines into the previous graph. Mobile visitors clearly come to view products.

2014 Mobile Engagement
Web Tablet MobileTime Spent on Page 2:40 2:33 1:34Pages Per Visit 3.78 3.59 2.70 Bounce Rates 44.01 44.09 52.12
New Visits 72.39 67.51 70.96 Returning Visits 27.61 32.49 29.04