Embed Size (px)
Citation preview
The mobile mazeNavigating consumer usage of mobile data
Introduction
2 The mobile maze
EY has conducted a major global online customer research study covering 6,000 consumers in 12 countries worldwide. The research, carried out in May and June 2012, was designed to highlight short-and medium-term issues facing mobile operators involved in the mobile services/applications value chain.
As part of our primary research, we asked consumers to detail their usage of specific mobile value-added services, exploring take-up drivers and inhibitors, along with their attitudes toward their mobile service providers in key aspects such as communications quality and payment preferences.
In both developed and emerging markets across the world, consumers’ rapid adoption of internet-enabled smartphones and tablets has been one of the most significant social, business and technology trends of recent years. As this growth continues, and as device experiences evolve and use cases expand, the market for mobile services
and applications is becoming increasingly complex for operators and their customers.
The result is a fast-changing market and technological environment that we have termed “the mobile maze.” The challenge for operators is to navigate their way through it by meeting the evolving needs, demands and expectations of consumers.
In this research report, we have supplemented the findings from our consumer survey with insights from EY’s sector practitioners. I would like to thank all our contributors for their time and cooperation in the preparation of the report.
Jonathan DharmapalanGlobal Telecommunications Leader

3The mobile maze
EY insights and solutions EY’s consumer-based insights — as showcased in this report —are supplemented by subject matter expertise across the full spectrum of market dynamics and scenarios within the telecommunications sector.
We offer a comprehensive range of solutions relating to areas including customer experience management, customer segmentation, pricing analysis, customer service systems and BSS/OSS systems design. All of these solutions apply to operators that are widening their range of services and targeting sustainable growth in mobile data revenues.
The issues we have highlighted in this report are not unique to telecom operators — and the diagnostic techniques and solutions highlighted above apply across industries.
Executive summary
Survey sample and methodology
Segmenting customer attributes brings opportunities
Identifying the key drivers of usage
Isolating the inhibitors to take-up
Headline survey results
1
4
32
6
20148
5
Better explanati
on of
sim
pler
tarif
fs
Focu
s in
youn
g con
sumers
Prep
aid
3G no
t ig
nored
More prepaid options
Clear changing better c
ustom
er e
duca
tion
Stronger privacy security protection
Usage-based charges Sim
pler tariffs
Increase awareness an
d rele
vanc
e
Customer service and comm
ercial innovations
Bett
er ho
us
ehold
ana
lys
is
(Low
est s
pe
nders)
Service choices
Smartphones drive usage
Segm
ent p
rodu
cts
Migration from 2G, 3G and 4G
capacity
Lack of network
Poor comm
unication service
Navigating the mobile maze
32
How EY can help
34
26
Contents
5
4 The mobile maze
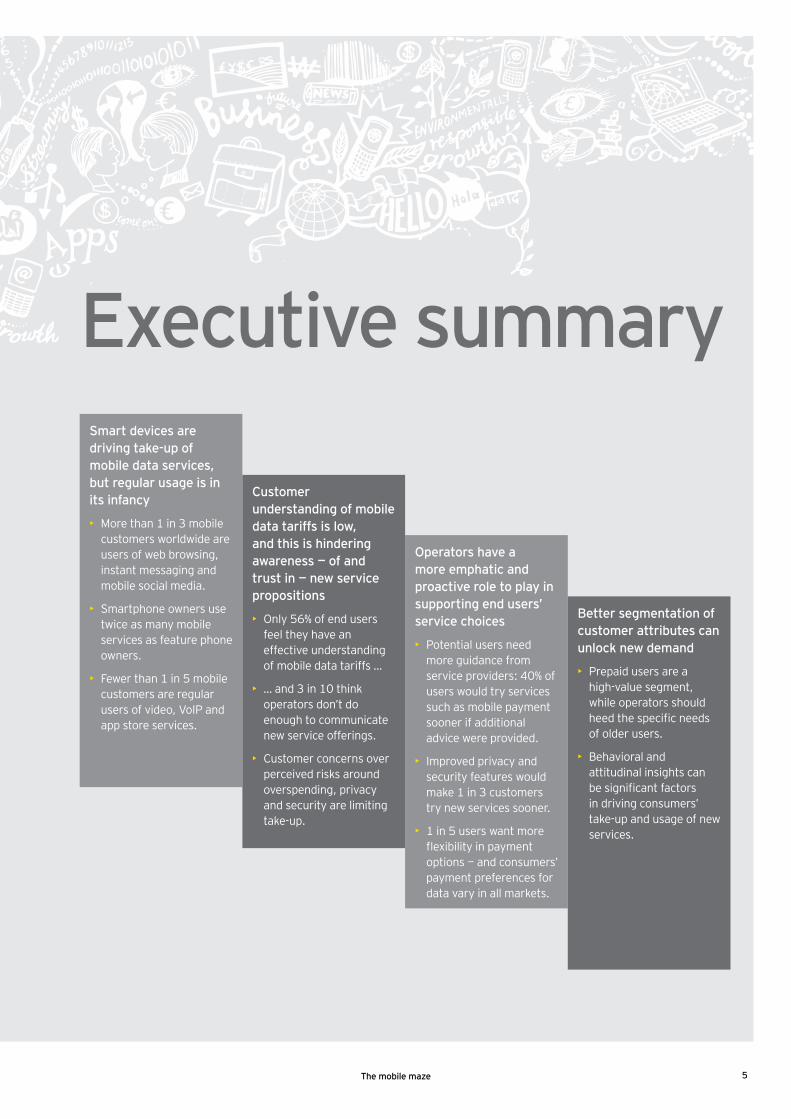
Executive summarySmart devices are driving take-up of mobile data services, but regular usage is in its infancy
• More than 1 in 3 mobile customers worldwide are users of web browsing, instant messaging and mobile social media.
• Smartphone owners use twice as many mobile services as feature phone owners.
• Fewer than 1 in 5 mobile customers are regular users of video, VoIP and app store services.
Customer understanding of mobile data tariffs is low, and this is hindering awareness — of and trust in — new service propositions
• Only 56% of end users feel they have an effective understanding of mobile data tariffs …
• … and 3 in 10 think operators don’t do enough to communicate new service offerings.
• Customer concerns over perceived risks around overspending, privacy and security are limiting take-up.
Operators have a more emphatic and proactive role to play in supporting end users’ service choices
• Potential users need more guidance from service providers: 40% of users would try services such as mobile payment sooner if additional advice were provided.
• Improved privacy and security features would make 1 in 3 customers try new services sooner.
• 1 in 5 users want more flexibility in payment options — and consumers’ payment preferences for data vary in all markets.
Better segmentation of customer attributes can unlock new demand
• Prepaid users are a high-value segment, while operators should heed the specific needs of older users.
• Behavioral and attitudinal insights can be significant factors in driving consumers’ take-up and usage of new services.
5The mobile maze
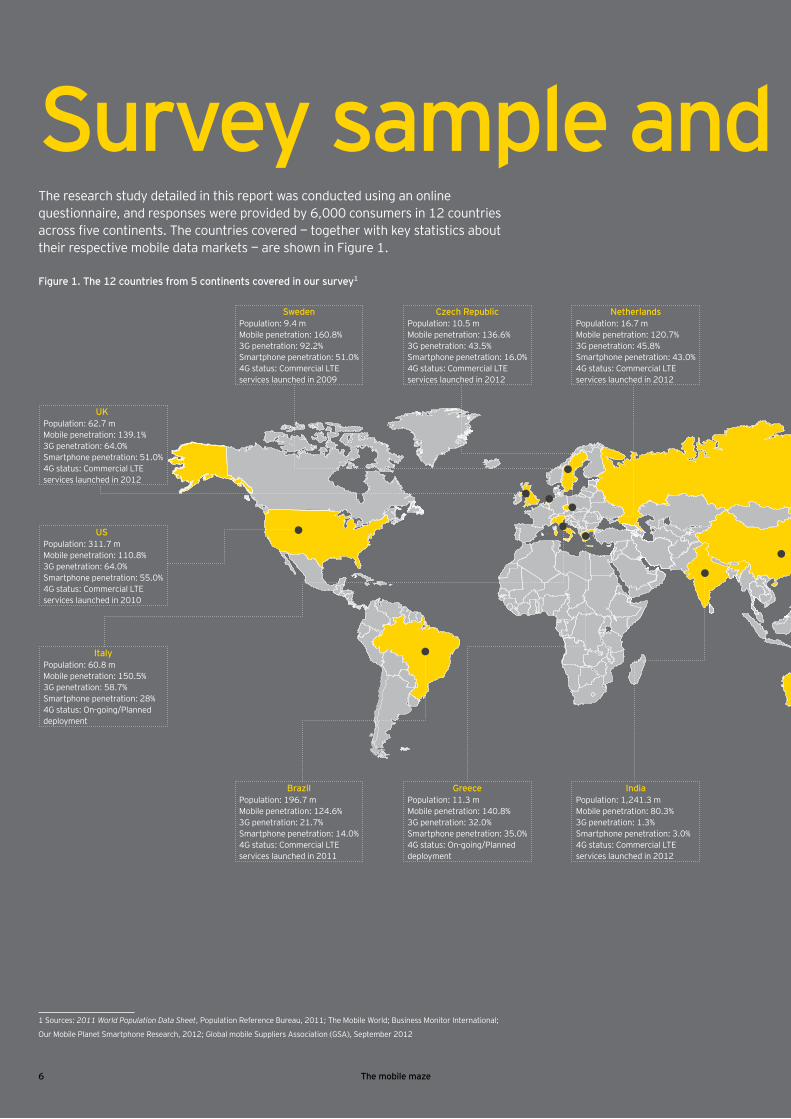
Survey sample and methodologyThe research study detailed in this report was conducted using an online questionnaire, and responses were provided by 6,000 consumers in 12 countries across five continents. The countries covered — together with key statistics about their respective mobile data markets — are shown in Figure 1.
Population: 62.7 mMobile penetration: 139.1%3G penetration: 64.0%Smartphone penetration: 51.0%4G status: Commercial LTE services launched in 2012
UK
Population: 311.7 mMobile penetration: 110.8%3G penetration: 64.0%Smartphone penetration: 55.0%4G status: Commercial LTE services launched in 2010
US
Population: 60.8 mMobile penetration: 150.5%3G penetration: 58.7%Smartphone penetration: 28%4G status: On-going/Planned deployment
Population: 196.7 mMobile penetration: 124.6%3G penetration: 21.7%Smartphone penetration: 14.0%4G status: Commercial LTE services launched in 2011
Population: 9.4 mMobile penetration: 160.8%3G penetration: 92.2%Smartphone penetration: 51.0%4G status: Commercial LTE services launched in 2009
Population: 11.3 mMobile penetration: 140.8%3G penetration: 32.0%Smartphone penetration: 35.0%4G status: On-going/Planned deployment
Population: 10.5 mMobile penetration: 136.6%3G penetration: 43.5%Smartphone penetration: 16.0%4G status: Commercial LTE services launched in 2012
Population: 1,241.3 mMobile penetration: 80.3%3G penetration: 1.3%Smartphone penetration: 3.0%4G status: Commercial LTE services launched in 2012
Population: 16.7 mMobile penetration: 120.7%3G penetration: 45.8%Smartphone penetration: 43.0%4G status: Commercial LTE services launched in 2012
Italy
Brazil
Sweden
Greece
Czech Republic
India
Netherlands
Figure 1. The 12 countries from 5 continents covered in our survey1
1 Sources: 2011 World Population Data Sheet, Population Reference Bureau, 2011; The Mobile World; Business Monitor International;
Our Mobile Planet Smartphone Research, 2012; Global mobile Suppliers Association (GSA), September 2012
6 The mobile maze
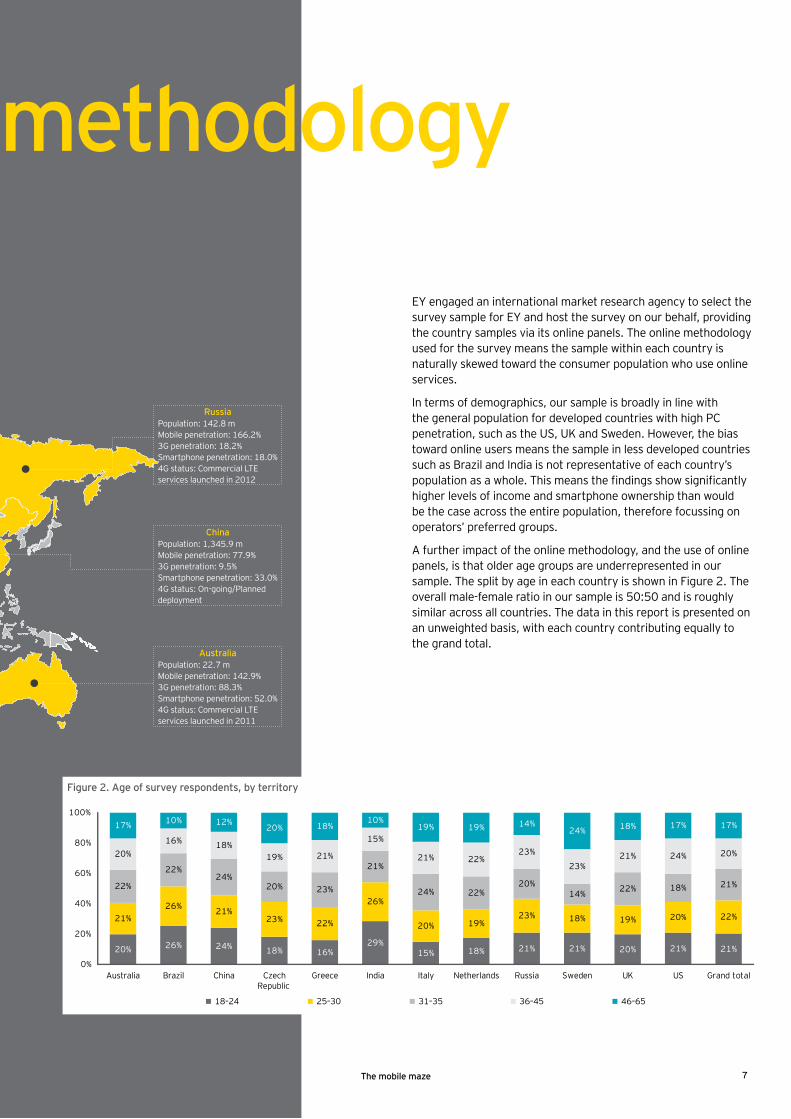
EY engaged an international market research agency to select the survey sample for EY and host the survey on our behalf, providing the country samples via its online panels. The online methodology used for the survey means the sample within each country is naturally skewed toward the consumer population who use online services.
In terms of demographics, our sample is broadly in line with the general population for developed countries with high PC penetration, such as the US, UK and Sweden. However, the bias toward online users means the sample in less developed countries such as Brazil and India is not representative of each country’s population as a whole. This means the findings show significantly higher levels of income and smartphone ownership than would be the case across the entire population, therefore focussing on operators’ preferred groups.
A further impact of the online methodology, and the use of online panels, is that older age groups are underrepresented in our sample. The split by age in each country is shown in Figure 2. The overall male-female ratio in our sample is 50:50 and is roughly similar across all countries. The data in this report is presented on an unweighted basis, with each country contributing equally to the grand total.
Survey sample and methodology
Population: 142.8 mMobile penetration: 166.2%3G penetration: 18.2%Smartphone penetration: 18.0%4G status: Commercial LTE services launched in 2012
Russia
Population: 1,345.9 mMobile penetration: 77.9%3G penetration: 9.5%Smartphone penetration: 33.0%4G status: On-going/Planned deployment
China
Population: 22.7 mMobile penetration: 142.9%3G penetration: 88.3%Smartphone penetration: 52.0%4G status: Commercial LTE services launched in 2011
Australia
20% 26% 24% 18% 16%29%
15% 18% 21% 21% 20% 21% 21%
21%26% 21%
23% 22%
26%
20% 19%23% 18% 19% 20% 22%
22%
22%24%
20% 23%
21%
24% 22%20%
14% 22% 18% 21%
20%16% 18%
19% 21%
15%
21% 22%23%
23%21% 24% 20%
17% 10% 12%20% 18%
10%19% 19% 14%
24% 18% 17% 17%
0%
20%
40%
60%
80%
100%
Australia Brazil China CzechRepublic
Greece India Italy Netherlands Russia Sweden UK US Grand total
18–24 25–30 31–35 36–45 46–65
Figure 2. Age of survey respondents, by territory
7The mobile maze
Overall, our consumer study shows that smartphones do unlock new services, but that regular usage remains low. Within this overall scenario, our study has produced six key results.
Our consumer study shows that smartphones do unlock new services, but that regular usage remains low.
Headline survey results
1.
8 The mobile maze
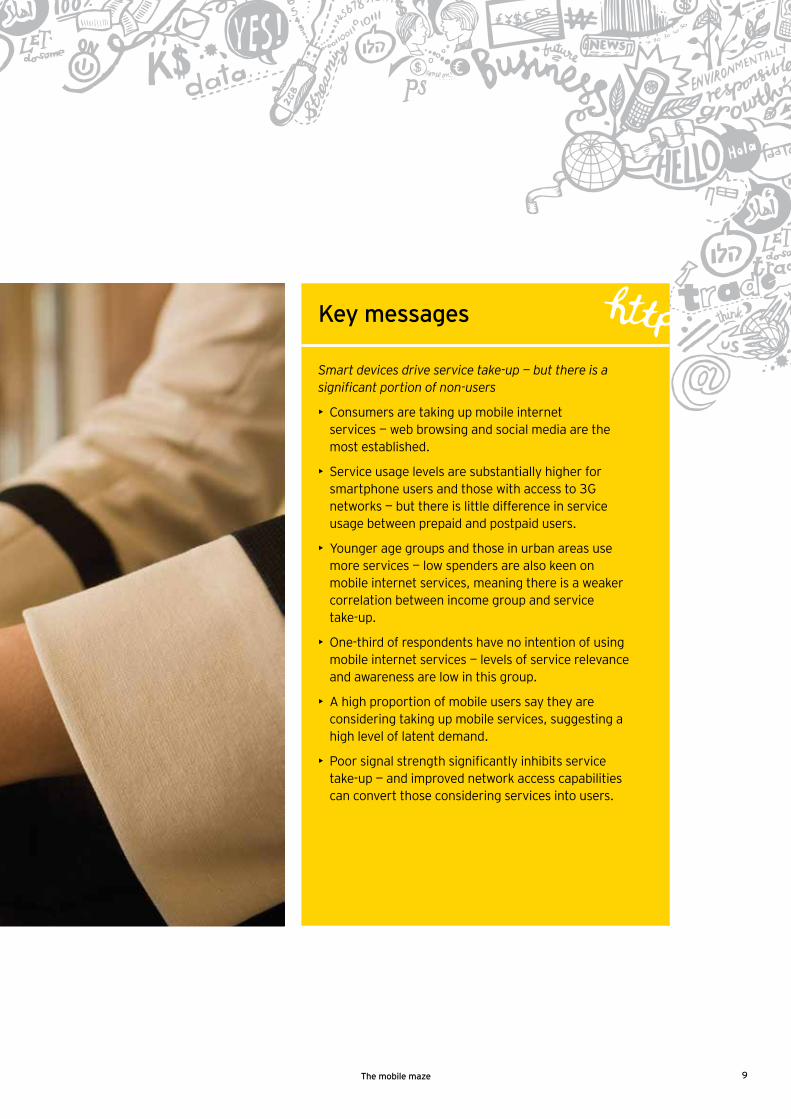
Smart devices drive service take-up — but there is a significant portion of non-users
• Consumers are taking up mobile internet services — web browsing and social media are the most established.
• Service usage levels are substantially higher for smartphone users and those with access to 3G networks — but there is little difference in service usage between prepaid and postpaid users.
• Younger age groups and those in urban areas use more services — low spenders are also keen on mobile internet services, meaning there is a weaker correlation between income group and service take-up.
• One-third of respondents have no intention of using mobile internet services — levels of service relevance and awareness are low in this group.
• A high proportion of mobile users say they are considering taking up mobile services, suggesting a high level of latent demand.
• Poor signal strength significantly inhibits service take-up — and improved network access capabilities can convert those considering services into users.
Key messages
9The mobile maze
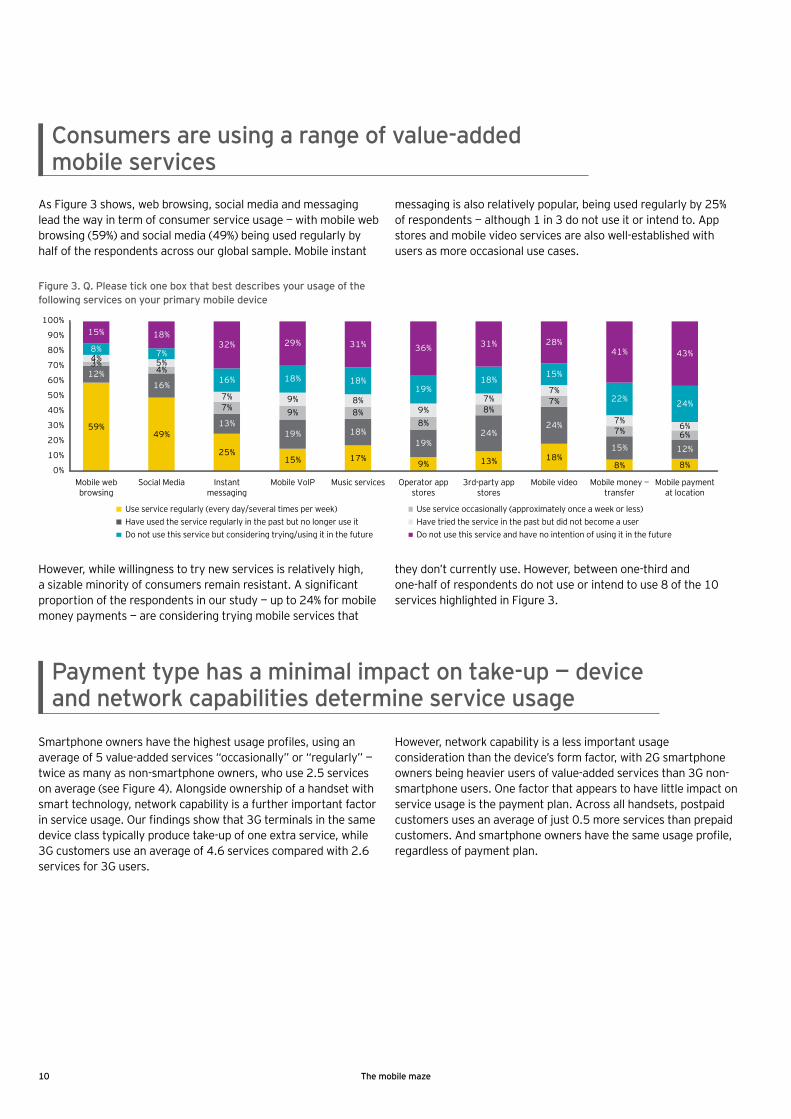
As Figure 3 shows, web browsing, social media and messaging lead the way in term of consumer service usage — with mobile web browsing (59%) and social media (49%) being used regularly by half of the respondents across our global sample. Mobile instant
messaging is also relatively popular, being used regularly by 25% of respondents — although 1 in 3 do not use it or intend to. App stores and mobile video services are also well-established with users as more occasional use cases.
Consumers are using a range of value-added mobile services
However, while willingness to try new services is relatively high, a sizable minority of consumers remain resistant. A significant proportion of the respondents in our study — up to 24% for mobile money payments — are considering trying mobile services that
they don’t currently use. However, between one-third and one-half of respondents do not use or intend to use 8 of the 10 services highlighted in Figure 3.
Smartphone owners have the highest usage profiles, using an average of 5 value-added services “occasionally” or “regularly” — twice as many as non-smartphone owners, who use 2.5 services on average (see Figure 4). Alongside ownership of a handset with smart technology, network capability is a further important factor in service usage. Our findings show that 3G terminals in the same device class typically produce take-up of one extra service, while 3G customers use an average of 4.6 services compared with 2.6 services for 3G users.
However, network capability is a less important usage consideration than the device’s form factor, with 2G smartphone owners being heavier users of value-added services than 3G non-smartphone users. One factor that appears to have little impact on service usage is the payment plan. Across all handsets, postpaid customers uses an average of just 0.5 more services than prepaid customers. And smartphone owners have the same usage profile, regardless of payment plan.
Payment type has a minimal impact on take-up — device and network capabilities determine service usage
59%49%
25%15% 17%
9% 13% 18%8% 8%
12%16%
13%19% 18%
19%24%
24%
15% 12%
3%4%
7% 9% 8%8%
8%7%
7% 6%
4% 5%
7% 9% 8%9%
7%7%
7% 6%
8% 7%
16% 18% 18%19%
18%15%
22% 24%
15% 18%32% 29% 31% 36% 31% 28%
41% 43%
0%
10%
20%
30%
40%
50%
60%
70%
80%
90%
100%
Mobile webbrowsing
Social Media Instantmessaging
Mobile VoIP Music services Operator appstores
3rd-party appstores
Mobile video Mobile money —transfer
Mobile paymentat location
Use service regularly (every day/several times per week) Use service occasionally (approximately once a week or less)Have used the service regularly in the past but no longer use it Have tried the service in the past but did not become a userDo not use this service but considering trying/using it in the future Do not use this service and have no intention of using it in the future
Figure 3. Q. Please tick one box that best describes your usage of the following services on your primary mobile device
10 The mobile maze
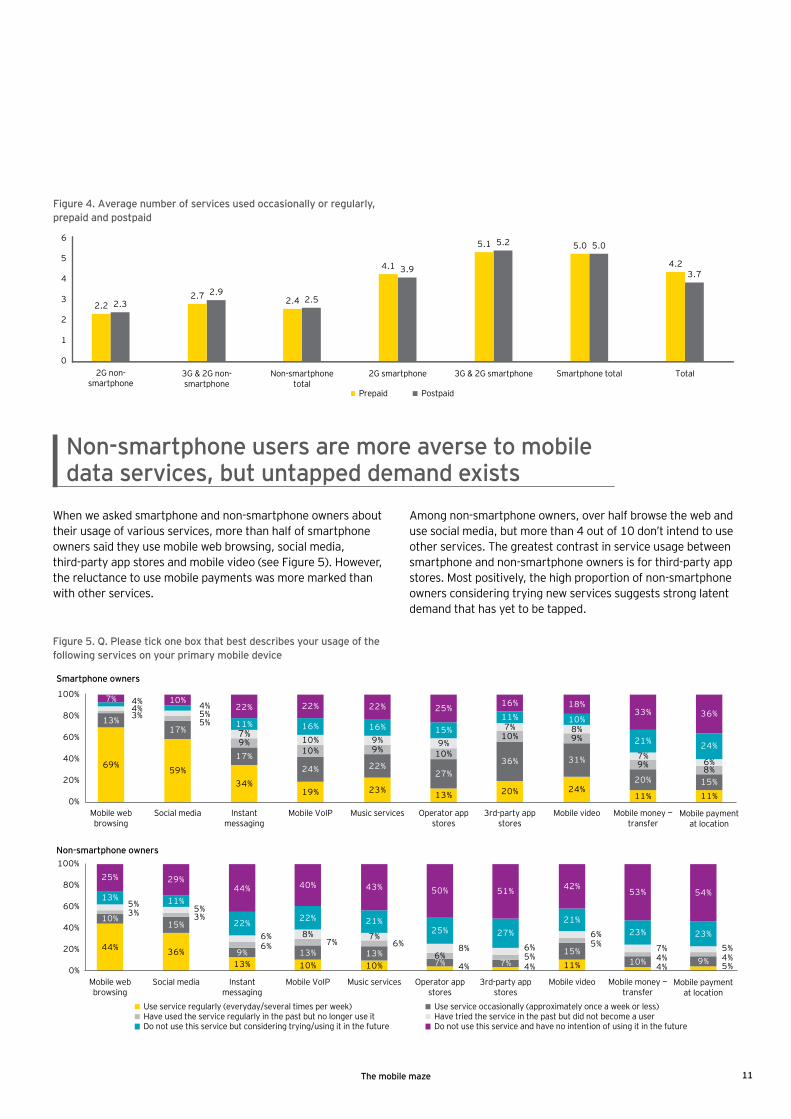
When we asked smartphone and non-smartphone owners about their usage of various services, more than half of smartphone owners said they use mobile web browsing, social media, third-party app stores and mobile video (see Figure 5). However, the reluctance to use mobile payments was more marked than with other services.
Among non-smartphone owners, over half browse the web and use social media, but more than 4 out of 10 don’t intend to use other services. The greatest contrast in service usage between smartphone and non-smartphone owners is for third-party app stores. Most positively, the high proportion of non-smartphone owners considering trying new services suggests strong latent demand that has yet to be tapped.
Non-smartphone users are more averse to mobile data services, but untapped demand exists
69%59%
34%19% 23% 13% 20% 24%
11% 11%
13%17%
17%24% 22%
27%36% 31%
20% 15%
3%5%
9%10% 9% 10%
10% 9%
9% 8%
4% 5%
7%10% 9% 9%
7% 8%
7%6%
4% 4%
11% 16% 16% 15%11% 10%
21% 24%
7% 10%22% 22% 22% 25% 16% 18%
33% 36%
0%
20%
40%
60%
80%
100%
Mobile webbrowsing
Social media Instantmessaging
Mobile VoIP Music services Operator appstores
3rd-party appstores
Mobile video Mobile money —transfer
Mobile paymentat location
Mobile webbrowsing
Social media Instantmessaging
Mobile VoIP Music services Operator appstores
3rd-party appstores
Mobile video Mobile money —transfer
Mobile paymentat location
44% 36%13% 10% 10% 4% 4% 11% 4% 5%
10%15%
9% 13% 13%7% 7%
15%10% 9%
3% 3%
6% 7% 6%6% 5%
5%4% 4%
5% 5%
6% 8% 7%8% 6%
6%7% 5%
13% 11%
22% 22% 21%25% 27%
21%23% 23%
25% 29%44% 40% 43% 50% 51% 42%
53% 54%
0%
20%
40%
60%
80%
100%
Use service regularly (everyday/several times per week) Use service occasionally (approximately once a week or less)Have used the service regularly in the past but no longer use it Have tried the service in the past but did not become a userDo not use this service but considering trying/using it in the future Do not use this service and have no intention of using it in the future
Smartphone owners
Non-smartphone owners
Figure 5. Q. Please tick one box that best describes your usage of the following services on your primary mobile device
Figure 4. Average number of services used occasionally or regularly, prepaid and postpaid
3.7
5.05.2
3.9
2.52.9
2.3
4.2
5.05.1
4.1
2.42.72.2
0
1
2
3
4
5
6
TotalSmartphone total3G & 2G smartphone2G smartphoneNon-smartphonetotal
3G & 2G non-smartphone
2G non-smartphone
Prepaid Postpaid
11The mobile maze
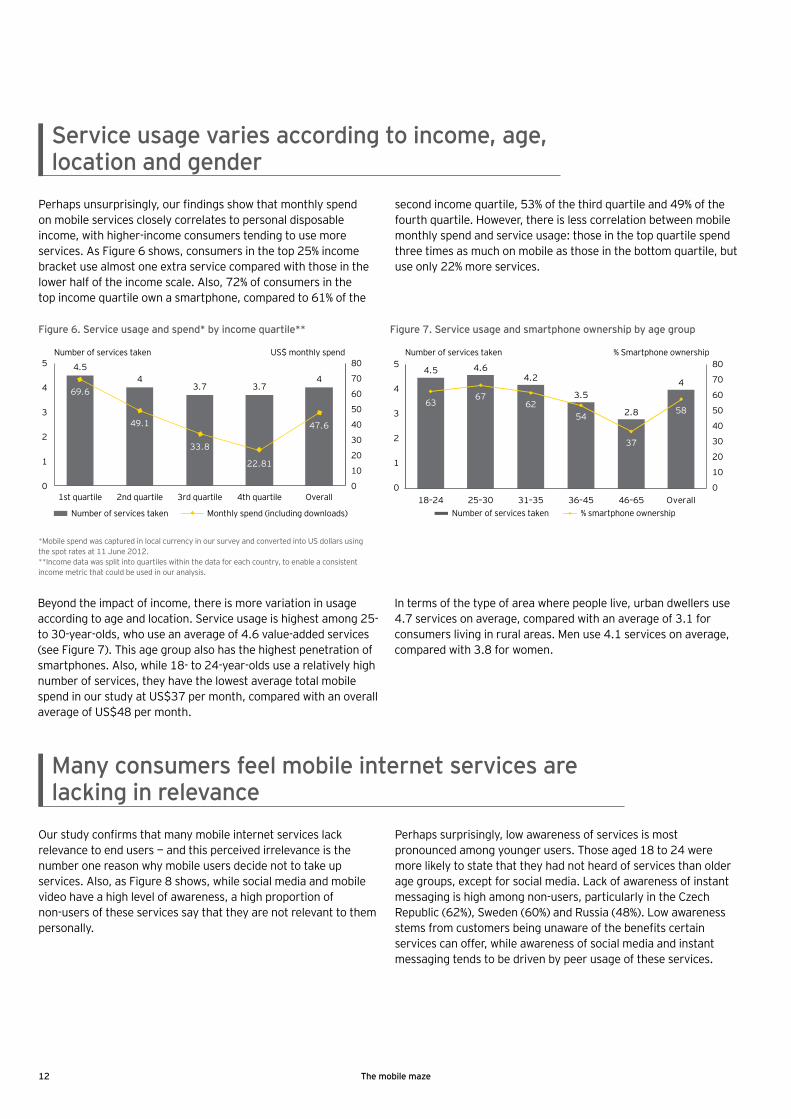
Perhaps unsurprisingly, our findings show that monthly spend on mobile services closely correlates to personal disposable income, with higher-income consumers tending to use more services. As Figure 6 shows, consumers in the top 25% income bracket use almost one extra service compared with those in the lower half of the income scale. Also, 72% of consumers in the top income quartile own a smartphone, compared to 61% of the
second income quartile, 53% of the third quartile and 49% of the fourth quartile. However, there is less correlation between mobile monthly spend and service usage: those in the top quartile spend three times as much on mobile as those in the bottom quartile, but use only 22% more services.
Beyond the impact of income, there is more variation in usage according to age and location. Service usage is highest among 25- to 30-year-olds, who use an average of 4.6 value-added services (see Figure 7). This age group also has the highest penetration of smartphones. Also, while 18- to 24-year-olds use a relatively high number of services, they have the lowest average total mobile spend in our study at US$37 per month, compared with an overall average of US$48 per month.
In terms of the type of area where people live, urban dwellers use 4.7 services on average, compared with an average of 3.1 for consumers living in rural areas. Men use 4.1 services on average, compared with 3.8 for women.
Service usage varies according to income, age, location and gender
4.5 4.64.2
3.5
2.8
4
6367
6254
37
58
0
10
20
30
40
50
60
70
80
0
1
2
3
4
5
18–24 25–30 31–35 36–45 46–65 OverallNumber of services taken % smartphone ownership
Number of services taken % Smartphone ownership
4.54
3.7 3.74
69.6
49.1
33.8
22.81
47.6
0
10
20
30
40
50
60
70
80
0
1
2
3
4
5
1st quartile 2nd quartile 3rd quartile 4th quartile Overall
Number of services taken Monthly spend (including downloads)
Number of services taken US$ monthly spend
Figure 6. Service usage and spend* by income quartile** Figure 7. Service usage and smartphone ownership by age group
Our study confirms that many mobile internet services lack relevance to end users — and this perceived irrelevance is the number one reason why mobile users decide not to take up services. Also, as Figure 8 shows, while social media and mobile video have a high level of awareness, a high proportion of non-users of these services say that they are not relevant to them personally.
Perhaps surprisingly, low awareness of services is most pronounced among younger users. Those aged 18 to 24 were more likely to state that they had not heard of services than older age groups, except for social media. Lack of awareness of instant messaging is high among non-users, particularly in the Czech Republic (62%), Sweden (60%) and Russia (48%). Low awareness stems from customers being unaware of the benefits certain services can offer, while awareness of social media and instant messaging tends to be driven by peer usage of these services.
Many consumers feel mobile internet services are lacking in relevance
*Mobile spend was captured in local currency in our survey and converted into US dollars using the spot rates at 11 June 2012.**Income data was split into quartiles within the data for each country, to enable a consistent income metric that could be used in our analysis.
12 The mobile maze
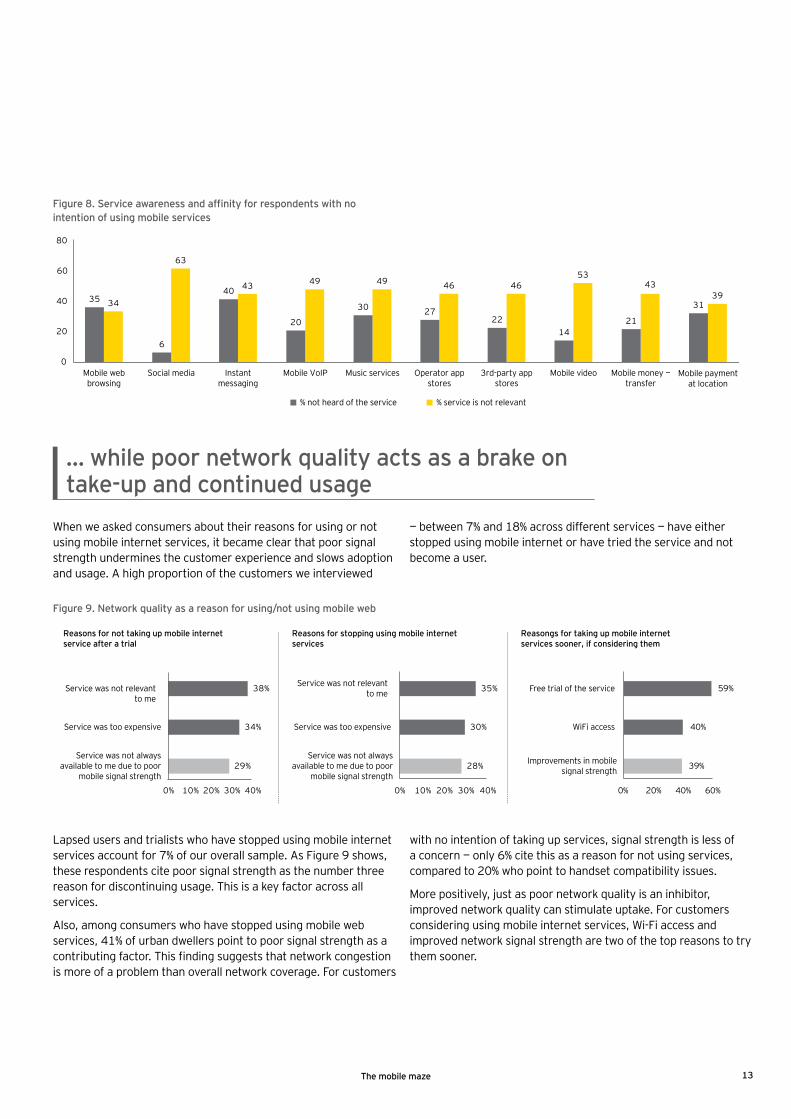
When we asked consumers about their reasons for using or not using mobile internet services, it became clear that poor signal strength undermines the customer experience and slows adoption and usage. A high proportion of the customers we interviewed
— between 7% and 18% across different services — have either stopped using mobile internet or have tried the service and not become a user.
Lapsed users and trialists who have stopped using mobile internet services account for 7% of our overall sample. As Figure 9 shows, these respondents cite poor signal strength as the number three reason for discontinuing usage. This is a key factor across all services.
Also, among consumers who have stopped using mobile web services, 41% of urban dwellers point to poor signal strength as a contributing factor. This finding suggests that network congestion is more of a problem than overall network coverage. For customers
with no intention of taking up services, signal strength is less of a concern — only 6% cite this as a reason for not using services, compared to 20% who point to handset compatibility issues.
More positively, just as poor network quality is an inhibitor, improved network quality can stimulate uptake. For customers considering using mobile internet services, Wi-Fi access and improved network signal strength are two of the top reasons to try them sooner.
Reasons for not taking up mobile internetservice after a trial
29%
34%
38%
0% 10% 20% 30% 40%
28%
30%
35%
0% 10% 20% 30% 40%
Reasons for stopping using mobile internetservices
Reasongs for taking up mobile internetservices sooner, if considering them
39%
40%
59%
0% 20% 40% 60%
Service was not relevantto me
Service was not relevantto me Free trial of the service
WiFi access
Improvements in mobilesignal strength
Service was too expensiveService was too expensive
Service was not alwaysavailable to me due to poor
mobile signal strength
Service was not alwaysavailable to me due to poor
mobile signal strength
Figure 9. Network quality as a reason for using/not using mobile web
Figure 8. Service awareness and affinity for respondents with no intention of using mobile services
3943
534646494943
63
34 31
2114
222730
20
40
6
35
0
20
40
60
80
% service is not relevant% not heard of the service
Mobile webbrowsing
Social media Instantmessaging
Mobile VoIP Music services Operator appstores
3rd-party appstores
Mobile video Mobile money —transfer
Mobile paymentat location
… while poor network quality acts as a brake on take-up and continued usage
13The mobile maze

Overall, our consumer study shows that smartphones do unlock new services, but that regular usage remains low. Within this overall scenario, our study has produced six key results.
Looking more closely into the factors inhibiting consumer adoption, our research and industry insights suggest that the main issues are low customer understanding of mobile service offerings, and the fact that end-users are struggling to discover these services’ true value.
Isolating the inhibitors to take-up
2.
14 The mobile maze
Lack of understanding is undermining trust and fueling confusion around pricing
• 1 in 3 mobile users do not feel they understand mobile data tariffs effectively, while only 1 in 5 feel they can very effectively make value judgments about new service offerings.
• Overall data plan pricing affects how inclined users are to adopt individual services — there is a high level of correlation between tariff understanding and the ability to evaluate specific services.
• Confusion in the market is widespread: in addition to those who lack effective understanding, a significant minority “do not know” whether they understand mobile data tariffs or whether they are well informed by operators about new services.
• Fears of overspending and an inability to understand pricing are stopping trialists from continuing to use mobile internet services and are also leading existing users to stop using services.
• Privacy and security concerns are a significant inhibitor to take-up, highlighting a lack of effective communication from service providers about data privacy.
Key messages
15The mobile maze
Customers struggle to understand mobile data tariffs ...
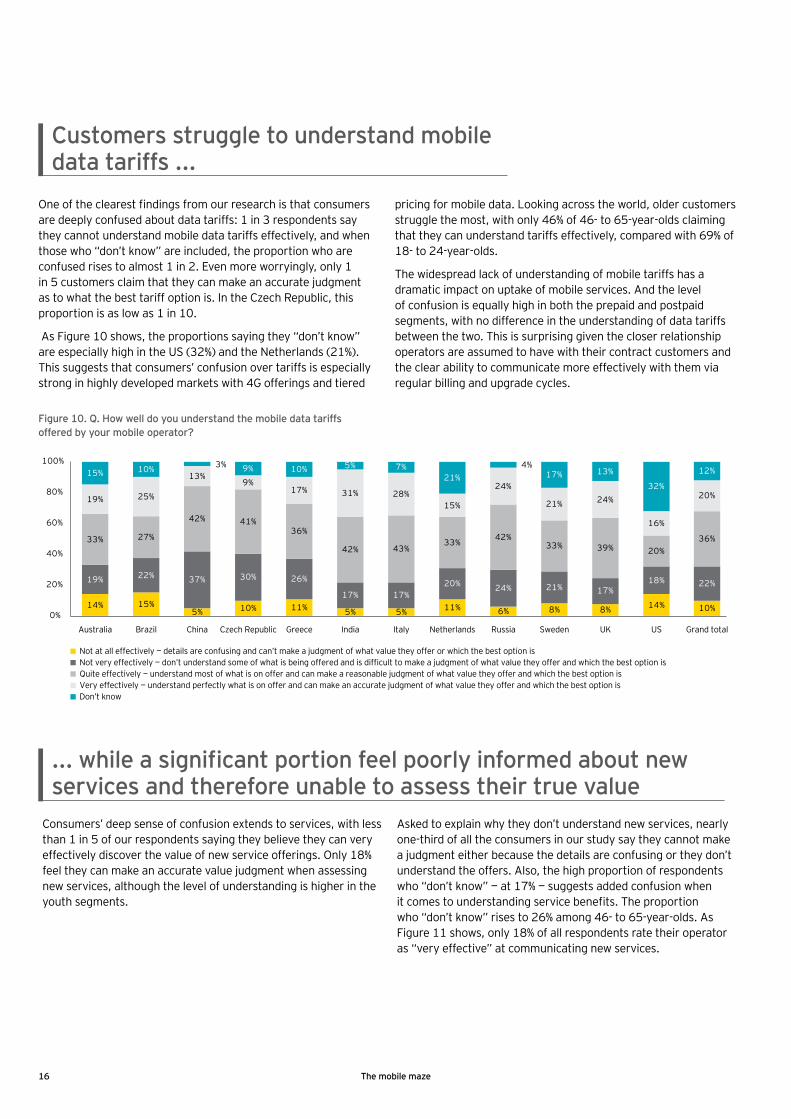
One of the clearest findings from our research is that consumers are deeply confused about data tariffs: 1 in 3 respondents say they cannot understand mobile data tariffs effectively, and when those who “don’t know” are included, the proportion who are confused rises to almost 1 in 2. Even more worryingly, only 1 in 5 customers claim that they can make an accurate judgment as to what the best tariff option is. In the Czech Republic, this proportion is as low as 1 in 10.
As Figure 10 shows, the proportions saying they “don’t know” are especially high in the US (32%) and the Netherlands (21%). This suggests that consumers’ confusion over tariffs is especially strong in highly developed markets with 4G offerings and tiered
pricing for mobile data. Looking across the world, older customers struggle the most, with only 46% of 46- to 65-year-olds claiming that they can understand tariffs effectively, compared with 69% of 18- to 24-year-olds.
The widespread lack of understanding of mobile tariffs has a dramatic impact on uptake of mobile services. And the level of confusion is equally high in both the prepaid and postpaid segments, with no difference in the understanding of data tariffs between the two. This is surprising given the closer relationship operators are assumed to have with their contract customers and the clear ability to communicate more effectively with them via regular billing and upgrade cycles.
... while a significant portion feel poorly informed about new services and therefore unable to assess their true value
Consumers’ deep sense of confusion extends to services, with less than 1 in 5 of our respondents saying they believe they can very effectively discover the value of new service offerings. Only 18% feel they can make an accurate value judgment when assessing new services, although the level of understanding is higher in the youth segments.
Asked to explain why they don’t understand new services, nearly one-third of all the consumers in our study say they cannot make a judgment either because the details are confusing or they don’t understand the offers. Also, the high proportion of respondents who “don’t know” — at 17% — suggests added confusion when it comes to understanding service benefits. The proportion who “don’t know” rises to 26% among 46- to 65-year-olds. As Figure 11 shows, only 18% of all respondents rate their operator as “very effective” at communicating new services.
14% 15%5% 10% 11% 5% 5% 11% 6% 8% 8% 14% 10%
19% 22% 37% 30% 26%
17% 17%20% 24% 21% 17%
18% 22%
33% 27%
42% 41%36%
42% 43%33% 42%
33% 39% 20%36%
19% 25%
13%9%
17% 31% 28%15%
24%
21% 24%
16%
20%
15% 10% 3% 9% 10% 5% 7%21%
4%17% 13%
32%
12%
0%
20%
40%
60%
80%
100%
Australia Brazil China Czech Republic Greece India Italy Netherlands Russia Sweden UK US Grand total
Not at all effectively — details are confusing and can’t make a judgment of what value they offer or which the best option isNot very effectively — don’t understand some of what is being offered and is difficult to make a judgment of what value they offer and which the best option isQuite effectively — understand most of what is on offer and can make a reasonable judgment of what value they offer and which the best option isVery effectively — understand perfectly what is on offer and can make an accurate judgment of what value they offer and which the best option isDon’t know
Figure 10. Q. How well do you understand the mobile data tariffs offered by your mobile operator?
16 The mobile maze
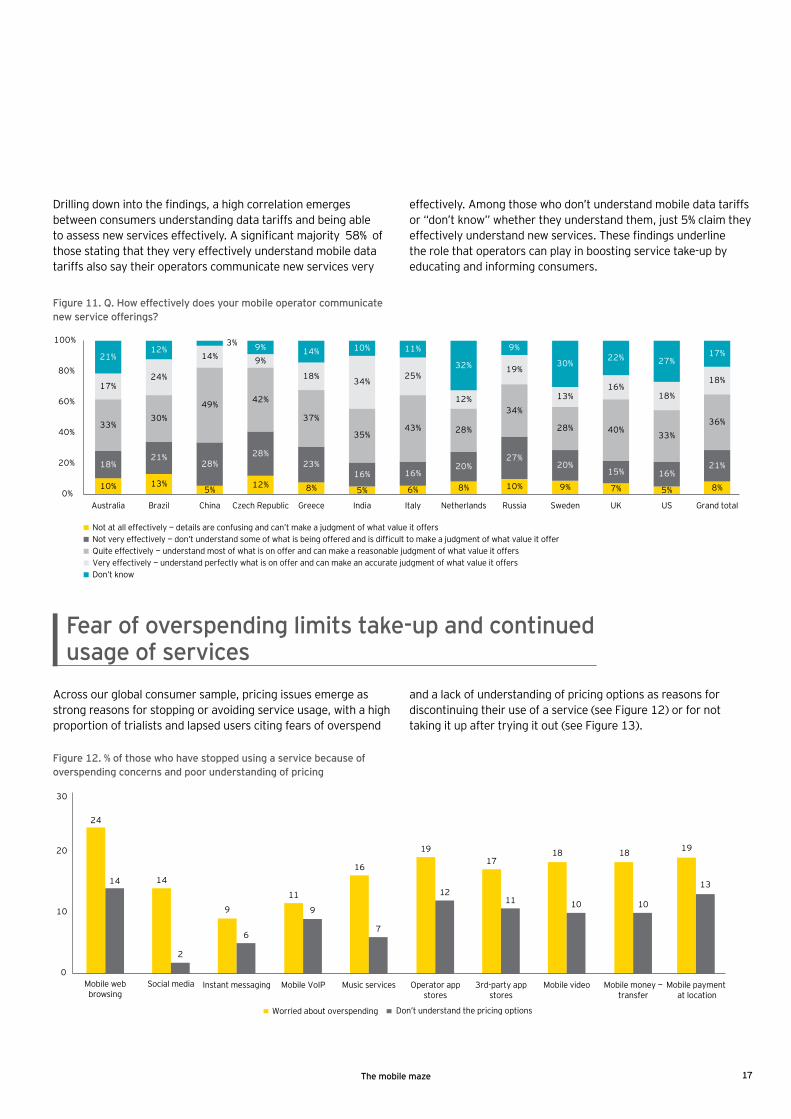
Drilling down into the findings, a high correlation emerges between consumers understanding data tariffs and being able to assess new services effectively. A significant majority 58% of those stating that they very effectively understand mobile data tariffs also say their operators communicate new services very
effectively. Among those who don’t understand mobile data tariffs or “don’t know” whether they understand them, just 5% claim they effectively understand new services. These findings underline the role that operators can play in boosting service take-up by educating and informing consumers.
10% 13%5% 12% 8% 5% 6% 8% 10% 9% 7% 5% 8%
18%21%
28%28%
23%16% 16%
20%27%
20%15% 16%
21%
33%30%
49% 42%
37%
35%43% 28%
34%
28% 40%33%
36%
17%24%
14% 9%
18% 34%25%
12%
19%
13%16%
18%
18%
21%12%
3% 9% 14% 10% 11%
32%
9%
30%22% 27%
17%
0%
20%
40%
60%
80%
100%
Australia Brazil China Czech Republic Greece India Italy Netherlands Russia Sweden UK US Grand total
Not at all effectively — details are confusing and can’t make a judgment of what value it offersNot very effectively — don’t understand some of what is being offered and is difficult to make a judgment of what value it offerQuite effectively — understand most of what is on offer and can make a reasonable judgment of what value it offersVery effectively — understand perfectly what is on offer and can make an accurate judgment of what value it offersDon’t know
Figure 11. Q. How effectively does your mobile operator communicate new service offerings?
Across our global consumer sample, pricing issues emerge as strong reasons for stopping or avoiding service usage, with a high proportion of trialists and lapsed users citing fears of overspend
and a lack of understanding of pricing options as reasons for discontinuing their use of a service (see Figure 12) or for not taking it up after trying it out (see Figure 13).
Figure 12. % of those who have stopped using a service because of overspending concerns and poor understanding of pricing
14
9
11
16
1917
18 19
13
2
6
9
7
1211 10
18
10
24
14
0
10
20
30
Mobile payment at location
Mobile money —transfer
Mobile videoOperator appstores
3rd-party appstores
Music servicesMobile VoIPInstant messagingMobile web browsing
Social media
Worried about overspending Don’t understand the pricing options
Fear of overspending limits take-up and continued usage of services
17The mobile maze
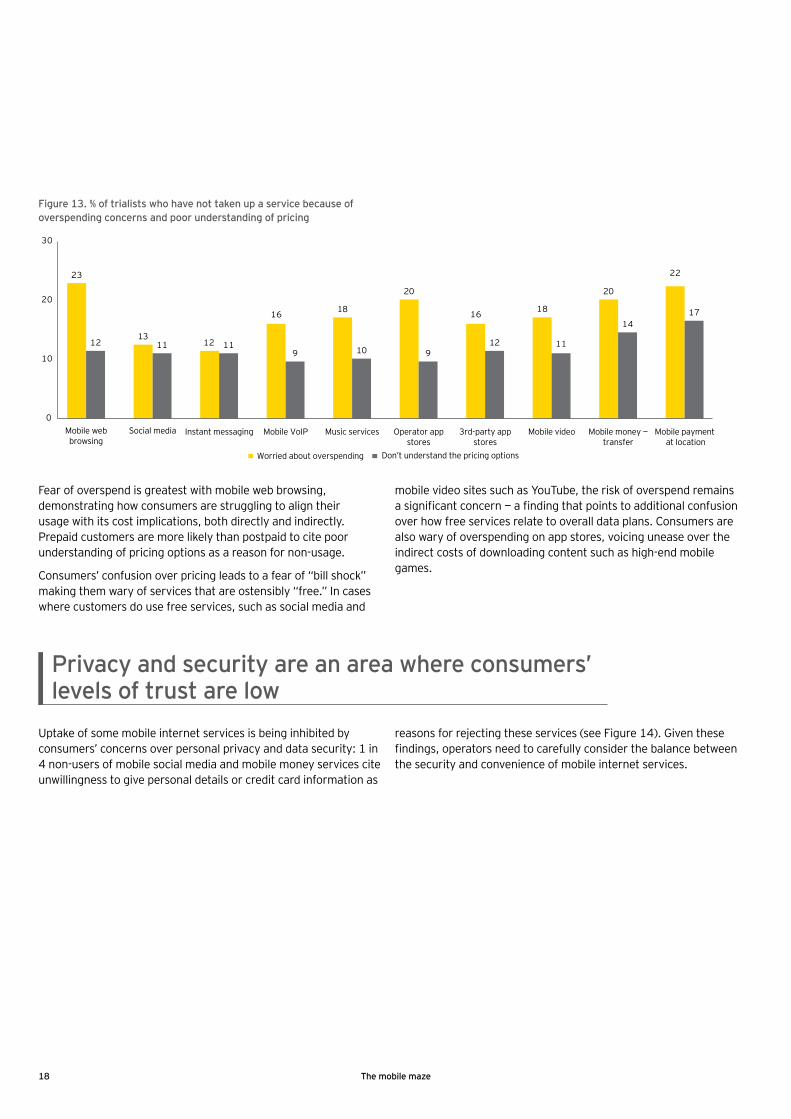
Fear of overspend is greatest with mobile web browsing, demonstrating how consumers are struggling to align their usage with its cost implications, both directly and indirectly. Prepaid customers are more likely than postpaid to cite poor understanding of pricing options as a reason for non-usage.
Consumers’ confusion over pricing leads to a fear of “bill shock” making them wary of services that are ostensibly “free.” In cases where customers do use free services, such as social media and
mobile video sites such as YouTube, the risk of overspend remains a significant concern — a finding that points to additional confusion over how free services relate to overall data plans. Consumers are also wary of overspending on app stores, voicing unease over the indirect costs of downloading content such as high-end mobile games.
Uptake of some mobile internet services is being inhibited by consumers’ concerns over personal privacy and data security: 1 in 4 non-users of mobile social media and mobile money services cite unwillingness to give personal details or credit card information as
reasons for rejecting these services (see Figure 14). Given these findings, operators need to carefully consider the balance between the security and convenience of mobile internet services.
Privacy and security are an area where consumers’ levels of trust are low
Figure 13. % of trialists who have not taken up a service because of overspending concerns and poor understanding of pricing
23
13
16 18
20
16 18
20
22
12 1211 119 10 9
12 11
1417
0
10
20
30
Worried about overspending Don’t understand the pricing options
Mobile payment at location
Mobile money —transfer
Mobile videoOperator appstores
3rd-party appstores
Music servicesMobile VoIPInstant messagingMobile web browsing
Social media
18 The mobile maze
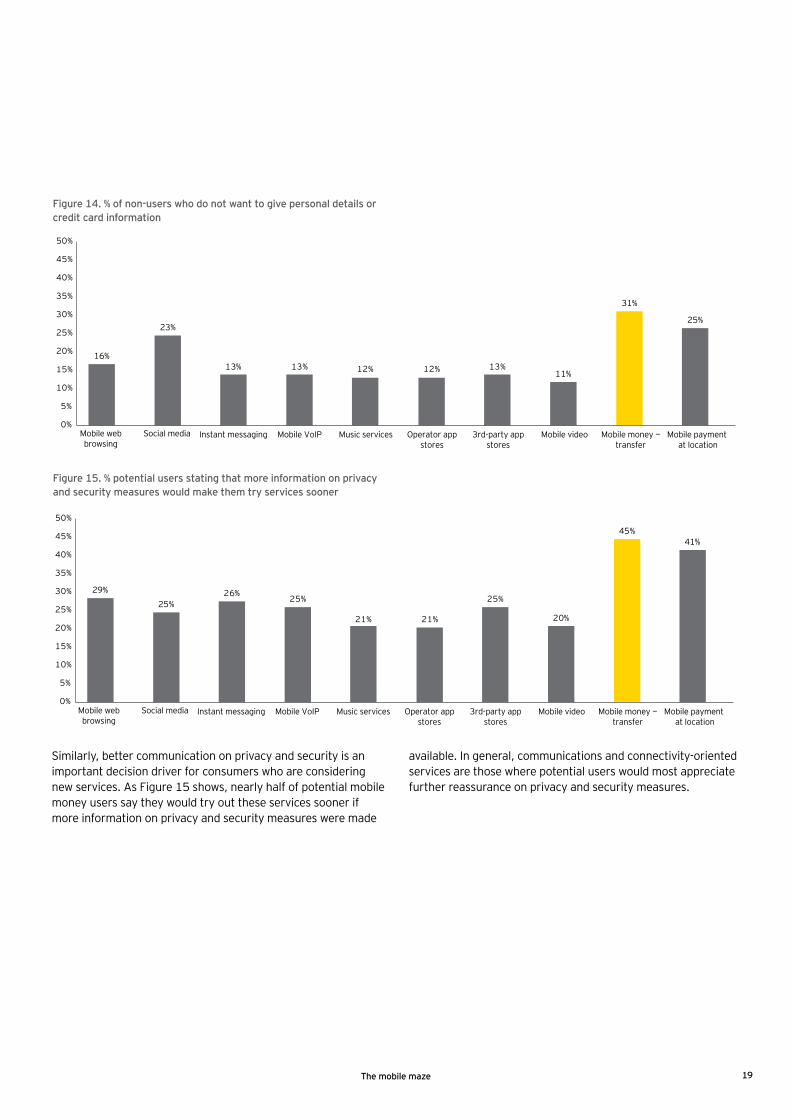
Figure 14. % of non-users who do not want to give personal details or credit card information
16%
23%
13% 13% 12% 12% 13%11%
31%
25%
0%
5%
10%
15%
20%
25%
30%
35%
40%
45%
50%
Mobile payment at location
Mobile money —transfer
Mobile videoOperator appstores
3rd-party appstores
Music servicesMobile VoIPInstant messagingMobile web browsing
Social media
Figure 15. % potential users stating that more information on privacy and security measures would make them try services sooner
Similarly, better communication on privacy and security is an important decision driver for consumers who are considering new services. As Figure 15 shows, nearly half of potential mobile money users say they would try out these services sooner if more information on privacy and security measures were made
available. In general, communications and connectivity-oriented services are those where potential users would most appreciate further reassurance on privacy and security measures.
29%
25%26%
25%
21% 21%
25%
20%
45%41%
0%
5%
10%
15%
20%
25%
30%
35%
40%
45%
50%
Mobile payment at location
Mobile money —transfer
Mobile videoOperator appstores
3rd-party appstores
Music servicesMobile VoIPInstant messagingMobile web browsing
Social media
19The mobile maze
Overall, our consumer study shows that smartphones do unlock new services, but that regular usage remains low. Within this overall scenario, our study has produced six key results.
Our findings on the factors that encourage consumers to adopt and use new mobile services show that operators need to support and increase end users’ — ability to make informed choices or a lack of understanding will continue to undermine take-up and spending.
Identifying the key drivers of usage
3.
20 The mobile maze
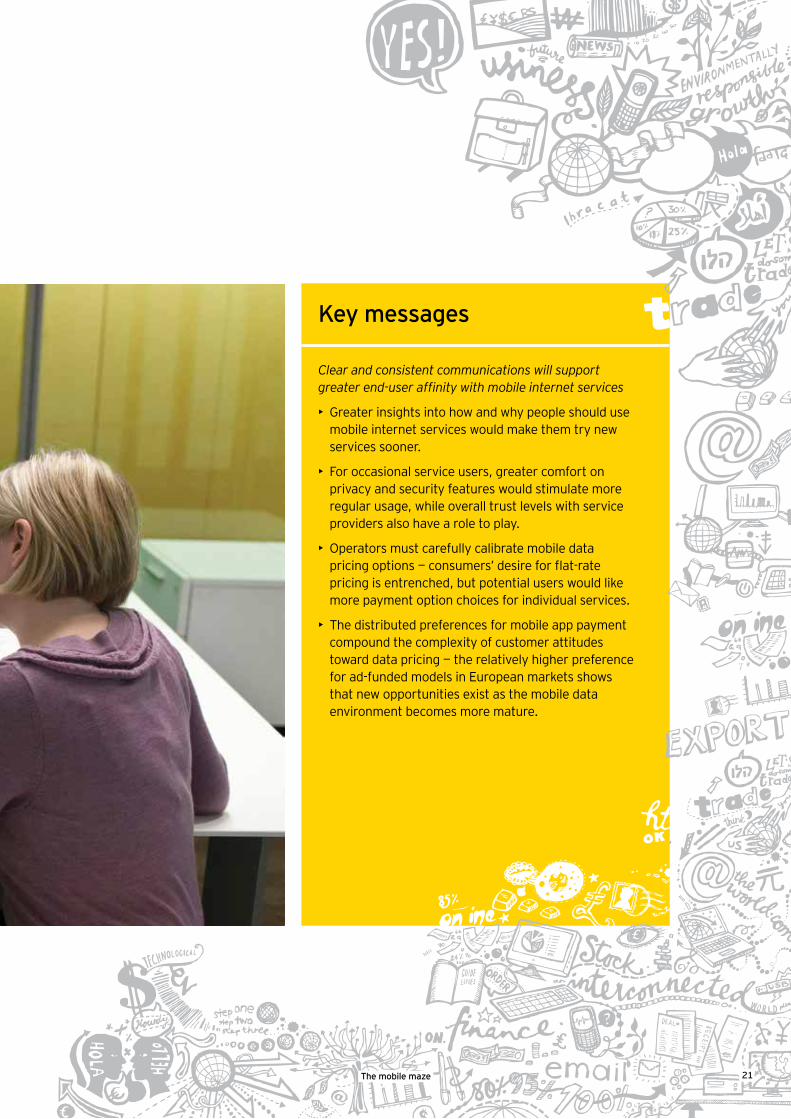
Clear and consistent communications will support greater end-user affinity with mobile internet services
• Greater insights into how and why people should use mobile internet services would make them try new services sooner.
• For occasional service users, greater comfort on privacy and security features would stimulate more regular usage, while overall trust levels with service providers also have a role to play.
• Operators must carefully calibrate mobile data pricing options — consumers’ desire for flat-rate pricing is entrenched, but potential users would like more payment option choices for individual services.
• The distributed preferences for mobile app payment compound the complexity of customer attitudes toward data pricing — the relatively higher preference for ad-funded models in European markets shows that new opportunities exist as the mobile data environment becomes more mature.
Key messages
21The mobile maze
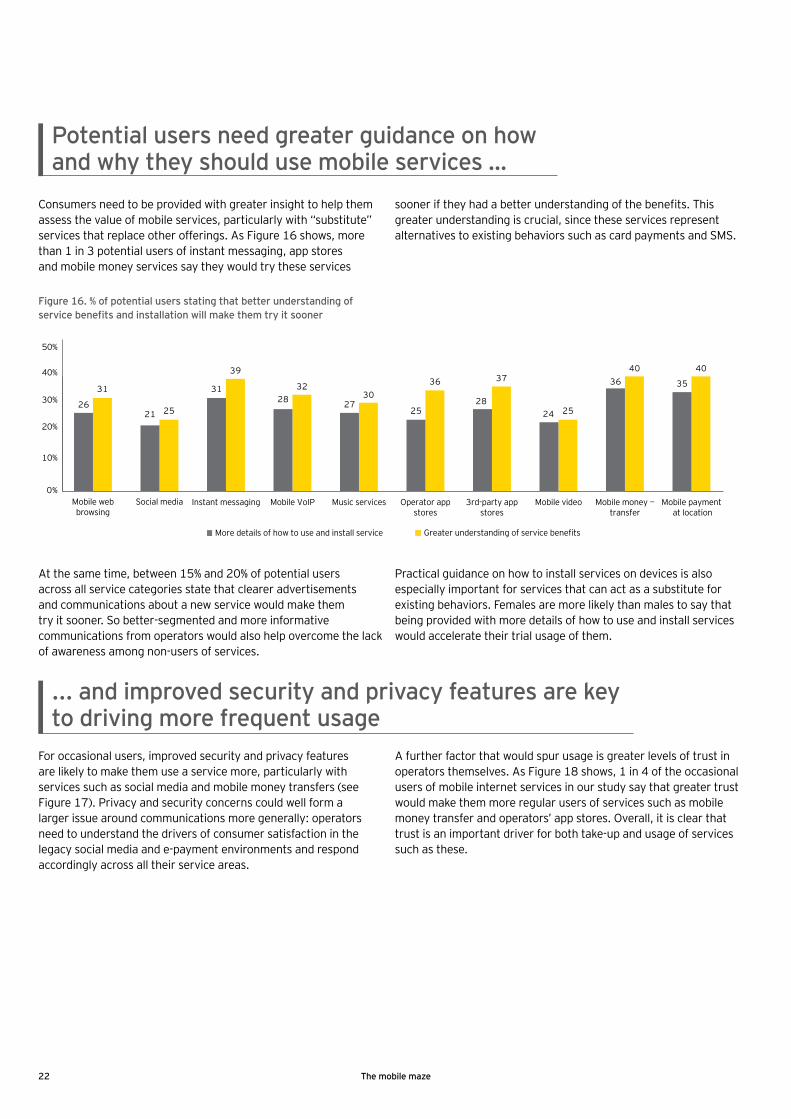
Consumers need to be provided with greater insight to help them assess the value of mobile services, particularly with “substitute” services that replace other offerings. As Figure 16 shows, more than 1 in 3 potential users of instant messaging, app stores and mobile money services say they would try these services
sooner if they had a better understanding of the benefits. This greater understanding is crucial, since these services represent alternatives to existing behaviors such as card payments and SMS.
Potential users need greater guidance on how and why they should use mobile services …
At the same time, between 15% and 20% of potential users across all service categories state that clearer advertisements and communications about a new service would make them try it sooner. So better-segmented and more informative communications from operators would also help overcome the lack of awareness among non-users of services.
Practical guidance on how to install services on devices is also especially important for services that can act as a substitute for existing behaviors. Females are more likely than males to say that being provided with more details of how to use and install services would accelerate their trial usage of them.
For occasional users, improved security and privacy features are likely to make them use a service more, particularly with services such as social media and mobile money transfers (see Figure 17). Privacy and security concerns could well form a larger issue around communications more generally: operators need to understand the drivers of consumer satisfaction in the legacy social media and e-payment environments and respond accordingly across all their service areas.
A further factor that would spur usage is greater levels of trust in operators themselves. As Figure 18 shows, 1 in 4 of the occasional users of mobile internet services in our study say that greater trust would make them more regular users of services such as mobile money transfer and operators’ app stores. Overall, it is clear that trust is an important driver for both take-up and usage of services such as these.
Figure 16. % of potential users stating that better understanding of service benefits and installation will make them try it sooner
4040
25
373630
32
39
25
31 3536
2428
252728
31
2126
Greater understanding of service benefitsMore details of how to use and install service
0%
10%
20%
30%
40%
50%
Mobile payment at location
Mobile money —transfer
Mobile videoOperator appstores
3rd-party appstores
Music servicesMobile VoIPInstant messagingMobile web browsing
Social media
... and improved security and privacy features are key to driving more frequent usage
22 The mobile maze
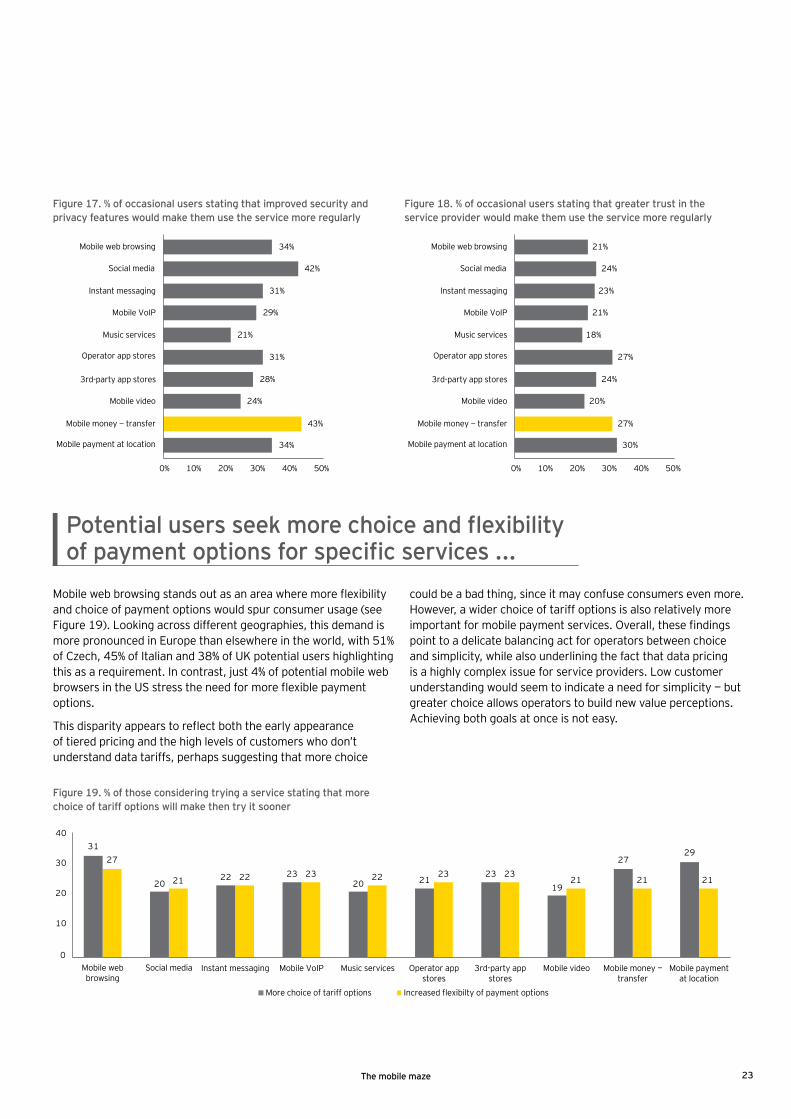
Figure 17. % of occasional users stating that improved security and privacy features would make them use the service more regularly
34%
43%
24%
28%
31%
21%
29%
31%
42%
34%
0% 10% 20% 30% 40% 50%
Mobile payment at location
Mobile money — transfer
Mobile video
Operator app stores
3rd-party app stores
Music services
Mobile VoIP
Instant messaging
Mobile web browsing
Social media
0% 10% 20% 30% 40% 50%
Mobile payment at location
Mobile money — transfer
Mobile video
Operator app stores
3rd-party app stores
Music services
Mobile VoIP
Instant messaging
Mobile web browsing
Social media
30%
27%
20%
24%
27%
18%
21%
23%
24%
21%
Figure 18. % of occasional users stating that greater trust in the service provider would make them use the service more regularly
Mobile web browsing stands out as an area where more flexibility and choice of payment options would spur consumer usage (see Figure 19). Looking across different geographies, this demand is more pronounced in Europe than elsewhere in the world, with 51% of Czech, 45% of Italian and 38% of UK potential users highlighting this as a requirement. In contrast, just 4% of potential mobile web browsers in the US stress the need for more flexible payment options.
This disparity appears to reflect both the early appearance of tiered pricing and the high levels of customers who don’t understand data tariffs, perhaps suggesting that more choice
could be a bad thing, since it may confuse consumers even more. However, a wider choice of tariff options is also relatively more important for mobile payment services. Overall, these findings point to a delicate balancing act for operators between choice and simplicity, while also underlining the fact that data pricing is a highly complex issue for service providers. Low customer understanding would seem to indicate a need for simplicity — but greater choice allows operators to build new value perceptions. Achieving both goals at once is not easy.
Potential users seek more choice and flexibility of payment options for specific services ...
Figure 19. % of those considering trying a service stating that more choice of tariff options will make then try it sooner
212121232322232221
2729
27
1923
21202322
20
31
0
10
20
30
40
Mobile paymentat location
Mobile money —transfer
Mobile video3rd-party appstores
Operator appstores
Music servicesMobile VoIPInstant messaging
Increased flexibilty of payment optionsMore choice of tariff options
Mobile web browsing
Social media
23The mobile maze
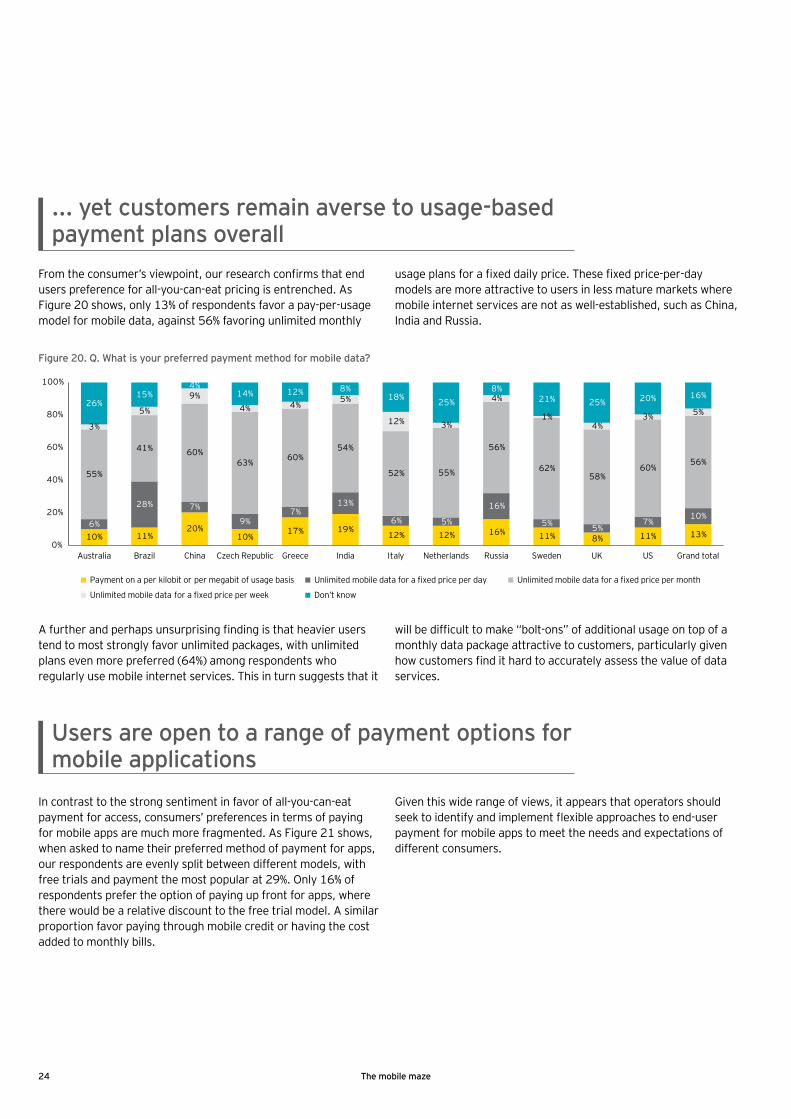
... yet customers remain averse to usage-based payment plans overall
From the consumer’s viewpoint, our research confirms that end users preference for all-you-can-eat pricing is entrenched. As Figure 20 shows, only 13% of respondents favor a pay-per-usage model for mobile data, against 56% favoring unlimited monthly
usage plans for a fixed daily price. These fixed price-per-day models are more attractive to users in less mature markets where mobile internet services are not as well-established, such as China, India and Russia.
A further and perhaps unsurprising finding is that heavier users tend to most strongly favor unlimited packages, with unlimited plans even more preferred (64%) among respondents who regularly use mobile internet services. This in turn suggests that it
will be difficult to make “bolt-ons” of additional usage on top of a monthly data package attractive to customers, particularly given how customers find it hard to accurately assess the value of data services.
In contrast to the strong sentiment in favor of all-you-can-eat payment for access, consumers’ preferences in terms of paying for mobile apps are much more fragmented. As Figure 21 shows, when asked to name their preferred method of payment for apps, our respondents are evenly split between different models, with free trials and payment the most popular at 29%. Only 16% of respondents prefer the option of paying up front for apps, where there would be a relative discount to the free trial model. A similar proportion favor paying through mobile credit or having the cost added to monthly bills.
Given this wide range of views, it appears that operators should seek to identify and implement flexible approaches to end-user payment for mobile apps to meet the needs and expectations of different consumers.
Users are open to a range of payment options for mobile applications
10% 11%20%
10%17% 19%
12% 12% 16% 11% 8% 11% 13%6%
28% 7%
9%7%
13%
6% 5%
16%
5% 5%7%
10%
55%
41% 60%63% 60%
54%
52% 55%
56%
62%58%
60%56%
3%
5%
9%4% 4%
5%
12% 3%
4%
1%4%
3% 5%26%
15%4%
14% 12% 8%18% 25%
8%21% 25% 20% 16%
0%
20%
40%
60%
80%
100%
Grand total
Unlimited mobile data for a fixed price per monthPayment on a per kilobit or per megabit of usage basis
Unlimited mobile data for a fixed price per week
Unlimited mobile data for a fixed price per day
Don’t know
Italy USChina Czech Republic Greece India Netherlands Russia Sweden UKAustralia Brazil
Figure 20. Q. What is your preferred payment method for mobile data?
24 The mobile maze
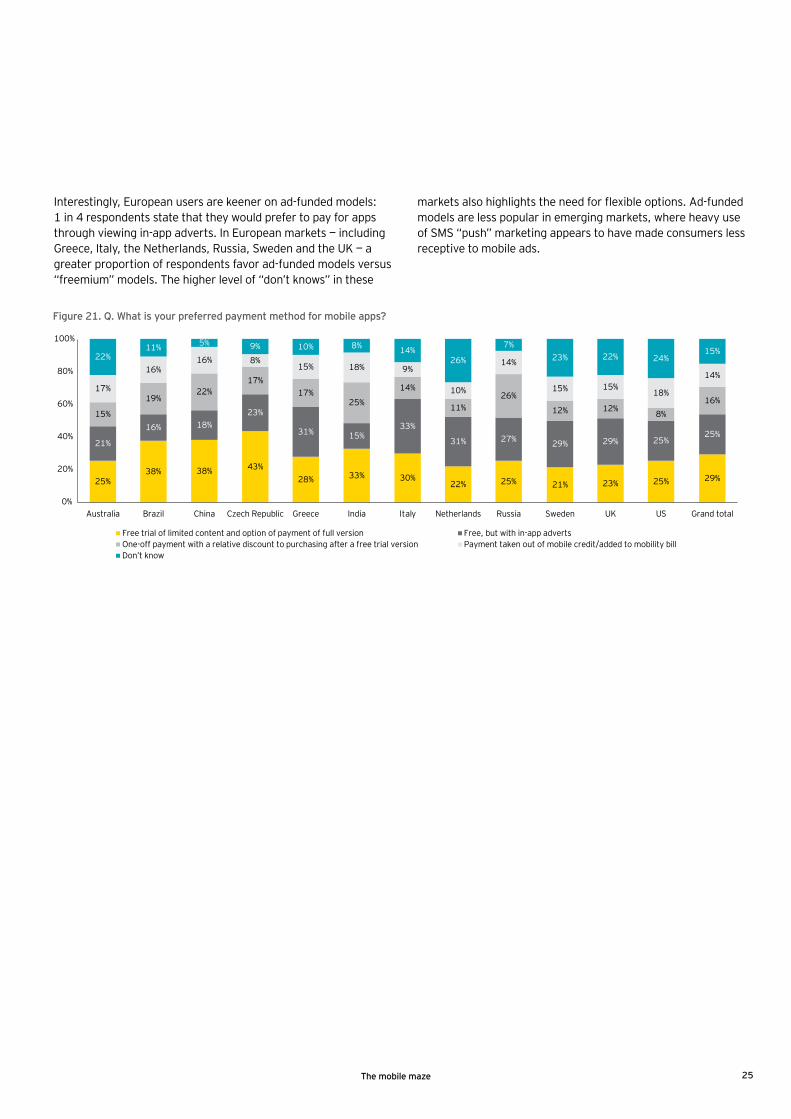
Interestingly, European users are keener on ad-funded models: 1 in 4 respondents state that they would prefer to pay for apps through viewing in-app adverts. In European markets — including Greece, Italy, the Netherlands, Russia, Sweden and the UK — a greater proportion of respondents favor ad-funded models versus “freemium” models. The higher level of “don’t knows” in these
markets also highlights the need for flexible options. Ad-funded models are less popular in emerging markets, where heavy use of SMS “push” marketing appears to have made consumers less receptive to mobile ads.
Figure 21. Q. What is your preferred payment method for mobile apps?
38% 43%28% 33% 30%
22% 25% 21% 23% 25% 29%
18%23%
31% 15%33%
31% 27% 29% 29% 25%25%
22%17%
17%25%
14%
11%26%
12% 12% 8%16%
16% 8%15% 18% 9%
10%
14%
15% 15%18%
14%
25%
21%
15%
17%
22%
38%
16%
19%
16%
11% 5% 9% 10% 8% 14%26%
7%23% 22% 24%
15%
0%
20%
40%
60%
80%
100%
Free trial of limited content and option of payment of full version Free, but with in-app advertsOne-off payment with a relative discount to purchasing after a free trial version Payment taken out of mobile credit/added to mobility billDon’t know
Grand totalItaly USChina Czech Republic Greece India Netherlands Russia Sweden UKAustralia Brazil
25The mobile maze

Overall, our consumer study shows that smartphones do unlock new services, but that regular usage remains low. Within this overall scenario, our study has produced six key results.
Segmenting customer attributes brings opportunities
4.
26 The mobile maze
Operators can drive additional value from specific customer groups
• Smartphone usage is highest among young urban consumers, although they are not necessarily higher spenders. A digital divide based on network quality may also hinder service take-up and usage.
• Prepaid users with smartphones and 3G are a high value segment: in some markets, youth prepaid customers outspend their postpaid counterparts.
• 36- to 45-year-old customers have high potential if they are targeted and segmented effectively.
• Overall, segmentation approaches in terms of attitudinal and behavioral factors will need to evolve if operators are to understand customers better and meet their needs. Attitudes to data pricing, hardware ownership and peer group influences are important considerations.
Key messages
27The mobile maze
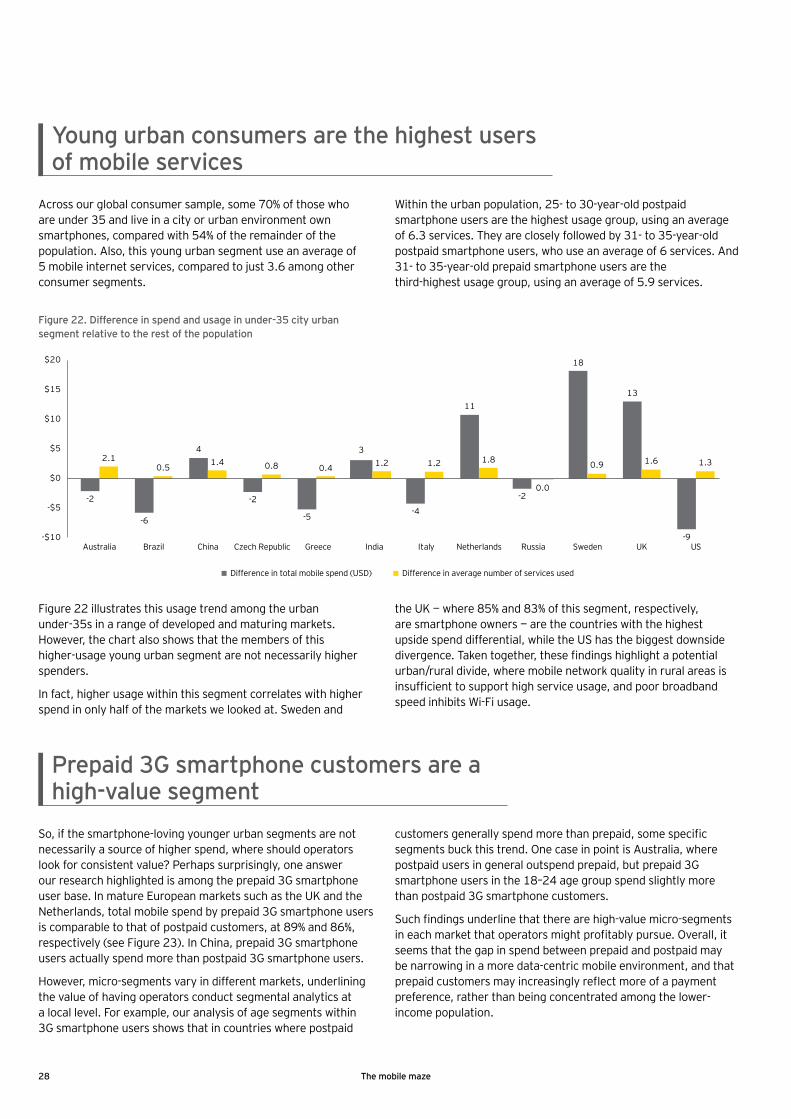
Across our global consumer sample, some 70% of those who are under 35 and live in a city or urban environment own smartphones, compared with 54% of the remainder of the population. Also, this young urban segment use an average of 5 mobile internet services, compared to just 3.6 among other consumer segments.
Within the urban population, 25- to 30-year-old postpaid smartphone users are the highest usage group, using an average of 6.3 services. They are closely followed by 31- to 35-year-old postpaid smartphone users, who use an average of 6 services. And 31- to 35-year-old prepaid smartphone users are the third-highest usage group, using an average of 5.9 services.
Young urban consumers are the highest users of mobile services
Figure 22 illustrates this usage trend among the urban under-35s in a range of developed and maturing markets. However, the chart also shows that the members of this higher-usage young urban segment are not necessarily higher spenders.
In fact, higher usage within this segment correlates with higher spend in only half of the markets we looked at. Sweden and
the UK — where 85% and 83% of this segment, respectively, are smartphone owners — are the countries with the highest upside spend differential, while the US has the biggest downside divergence. Taken together, these findings highlight a potential urban/rural divide, where mobile network quality in rural areas is insufficient to support high service usage, and poor broadband speed inhibits Wi-Fi usage.
So, if the smartphone-loving younger urban segments are not necessarily a source of higher spend, where should operators look for consistent value? Perhaps surprisingly, one answer our research highlighted is among the prepaid 3G smartphone user base. In mature European markets such as the UK and the Netherlands, total mobile spend by prepaid 3G smartphone users is comparable to that of postpaid customers, at 89% and 86%, respectively (see Figure 23). In China, prepaid 3G smartphone users actually spend more than postpaid 3G smartphone users.
However, micro-segments vary in different markets, underlining the value of having operators conduct segmental analytics at a local level. For example, our analysis of age segments within 3G smartphone users shows that in countries where postpaid
customers generally spend more than prepaid, some specific segments buck this trend. One case in point is Australia, where postpaid users in general outspend prepaid, but prepaid 3G smartphone users in the 18–24 age group spend slightly more than postpaid 3G smartphone customers.
Such findings underline that there are high-value micro-segments in each market that operators might profitably pursue. Overall, it seems that the gap in spend between prepaid and postpaid may be narrowing in a more data-centric mobile environment, and that prepaid customers may increasingly reflect more of a payment preference, rather than being concentrated among the lower-income population.
Prepaid 3G smartphone customers are a high-value segment
-$10
-$5
$0
$5
$10
$15
$20
Difference in total mobile spend (USD) Difference in average number of services used
-4
1.2
Italy-9
1.3
US
41.4
China
-2
0.8
Czech Republic
-5
0.4
Greece
31.2
India
11
1.8
Netherlands
-20.0
Russia
18
0.9
Sweden
13
1.6
UK
-2
2.1
Australia
-6
0.5
Brazil
Figure 22. Difference in spend and usage in under-35 city urban segment relative to the rest of the population
28 The mobile maze
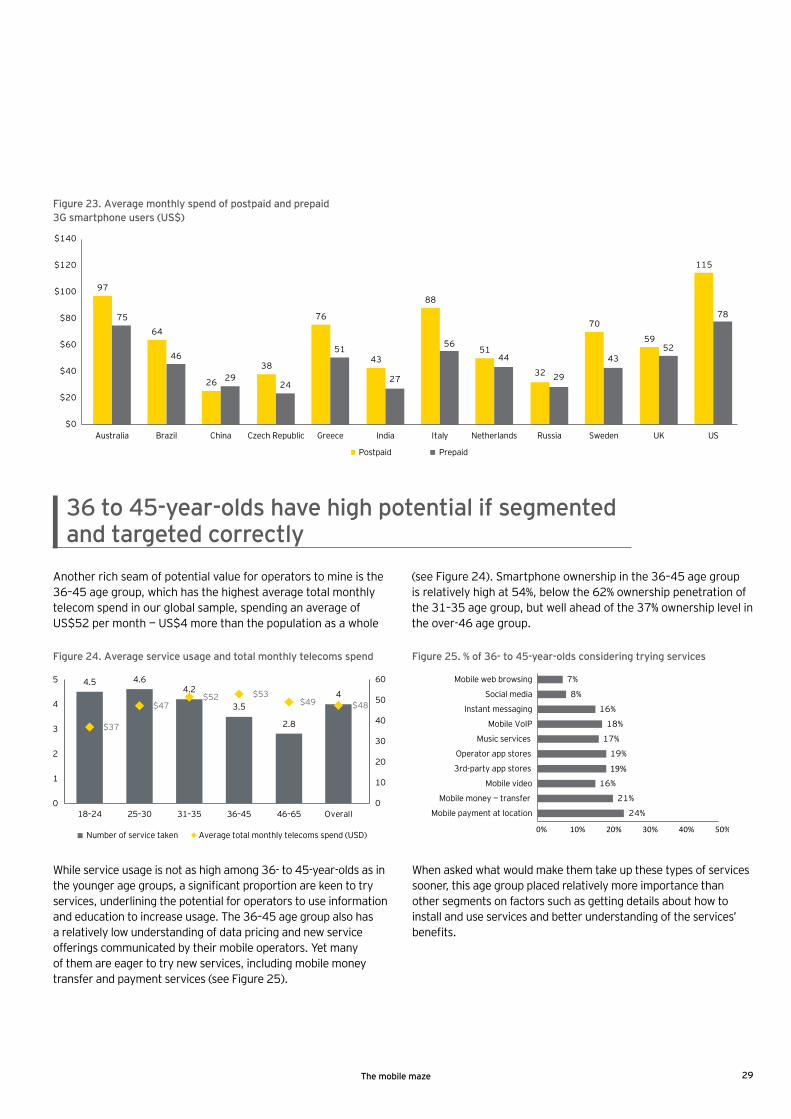
Figure 23. Average monthly spend of postpaid and prepaid 3G smartphone users (US$)
97
64
26
38
76
43
88
51
32
70
59
115
75
46
2924
51
27
5644
29
4352
78
$0
$20
$40
$60
$80
$100
$120
$140
Italy US
Postpaid Prepaid
China Czech Republic Greece India Netherlands Russia Sweden UKAustralia Brazil
Another rich seam of potential value for operators to mine is the 36–45 age group, which has the highest average total monthly telecom spend in our global sample, spending an average of US$52 per month — US$4 more than the population as a whole
(see Figure 24). Smartphone ownership in the 36–45 age group is relatively high at 54%, below the 62% ownership penetration of the 31–35 age group, but well ahead of the 37% ownership level in the over-46 age group.
36 to 45-year-olds have high potential if segmented and targeted correctly
While service usage is not as high among 36- to 45-year-olds as in the younger age groups, a significant proportion are keen to try services, underlining the potential for operators to use information and education to increase usage. The 36–45 age group also has a relatively low understanding of data pricing and new service offerings communicated by their mobile operators. Yet many of them are eager to try new services, including mobile money transfer and payment services (see Figure 25).
When asked what would make them take up these types of services sooner, this age group placed relatively more importance than other segments on factors such as getting details about how to install and use services and better understanding of the services’ benefits.
$37
$47$52 $53
$49 $48
0
10
20
30
40
50
60
0
1
2
3
4
5 4.5
18–24
4.6
25–30
4.2
31–35
3.5
36–45
2.8
46–65
4
Overall
Number of service taken Average total monthly telecoms spend (USD)
Figure 24. Average service usage and total monthly telecoms spend Figure 25. % of 36- to 45-year-olds considering trying services
0% 10% 20% 30% 40% 50%
24%Mobile payment at location
21%Mobile money — transfer
16%Mobile video
19%3rd-party app stores
19%Operator app stores
17%Music services
18%Mobile VoIP
16%Instant messaging
8%Social media
7%Mobile web browsing
29The mobile maze
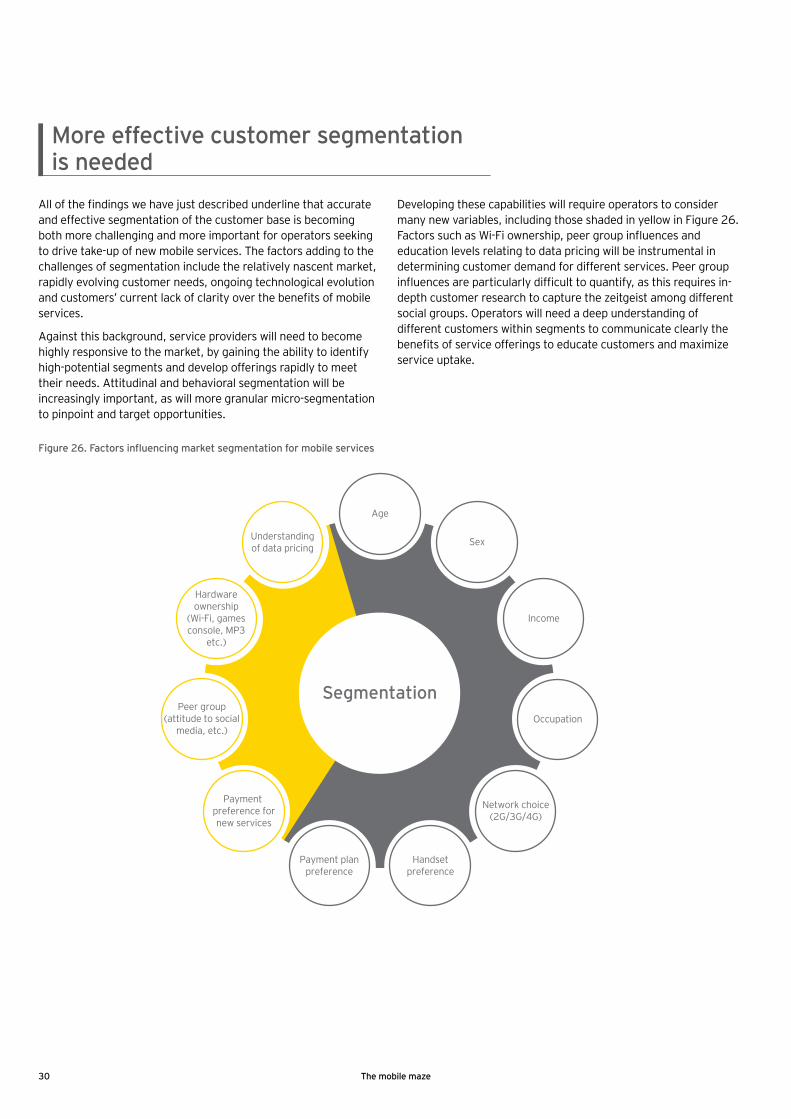
All of the findings we have just described underline that accurate and effective segmentation of the customer base is becoming both more challenging and more important for operators seeking to drive take-up of new mobile services. The factors adding to the challenges of segmentation include the relatively nascent market, rapidly evolving customer needs, ongoing technological evolution and customers’ current lack of clarity over the benefits of mobile services.
Against this background, service providers will need to become highly responsive to the market, by gaining the ability to identify high-potential segments and develop offerings rapidly to meet their needs. Attitudinal and behavioral segmentation will be increasingly important, as will more granular micro-segmentation to pinpoint and target opportunities.
Developing these capabilities will require operators to consider many new variables, including those shaded in yellow in Figure 26. Factors such as Wi-Fi ownership, peer group influences and education levels relating to data pricing will be instrumental in determining customer demand for different services. Peer group influences are particularly difficult to quantify, as this requires in-depth customer research to capture the zeitgeist among different social groups. Operators will need a deep understanding of different customers within segments to communicate clearly the benefits of service offerings to educate customers and maximize service uptake.
More effective customer segmentation is needed
Figure 26. Factors influencing market segmentation for mobile services
Segmentation
Age
Sex
Income
Occupation
Network choice(2G/3G/4G)
Handsetpreference
Payment planpreference
Payment preference fornew services
Peer group (attitude to social
media, etc.)
Hardware ownership
(Wi-Fi, games console, MP3
etc.)
Understanding of data pricing
30 The mobile maze
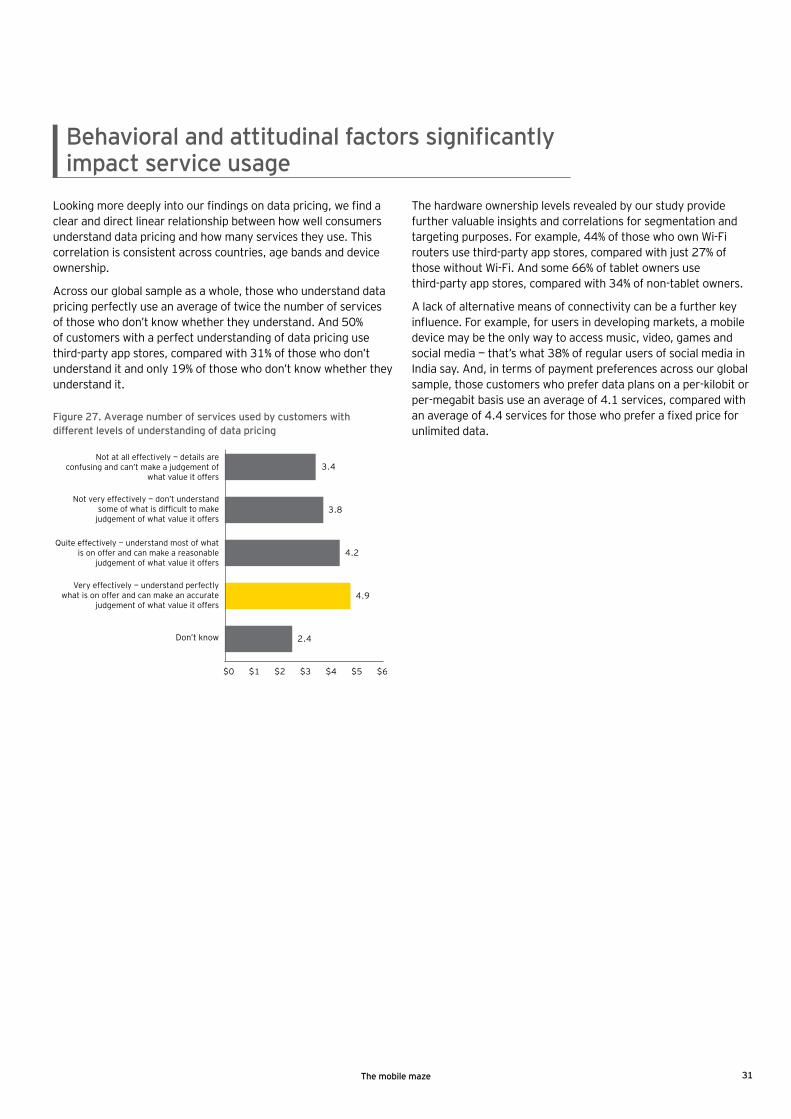
Looking more deeply into our findings on data pricing, we find a clear and direct linear relationship between how well consumers understand data pricing and how many services they use. This correlation is consistent across countries, age bands and device ownership.
Across our global sample as a whole, those who understand data pricing perfectly use an average of twice the number of services of those who don’t know whether they understand. And 50% of customers with a perfect understanding of data pricing use third-party app stores, compared with 31% of those who don’t understand it and only 19% of those who don’t know whether they understand it.
The hardware ownership levels revealed by our study provide further valuable insights and correlations for segmentation and targeting purposes. For example, 44% of those who own Wi-Fi routers use third-party app stores, compared with just 27% of those without Wi-Fi. And some 66% of tablet owners use third-party app stores, compared with 34% of non-tablet owners.
A lack of alternative means of connectivity can be a further key influence. For example, for users in developing markets, a mobile device may be the only way to access music, video, games and social media — that’s what 38% of regular users of social media in India say. And, in terms of payment preferences across our global sample, those customers who prefer data plans on a per-kilobit or per-megabit basis use an average of 4.1 services, compared with an average of 4.4 services for those who prefer a fixed price for unlimited data.
Behavioral and attitudinal factors significantly impact service usage
Figure 27. Average number of services used by customers with different levels of understanding of data pricing
3.4
3.8
4.2
4.9
2.4
$0 $1 $2 $3 $4 $5 $6
Not at all effectively — details are confusing and can’t make a judgement of
what value it offers
Not very effectively — don’t understand some of what is difficult to make
judgement of what value it offers
Quite effectively — understand most of what is on offer and can make a reasonable
judgement of what value it offers
Very effectively — understand perfectly what is on offer and can make an accurate
judgement of what value it offers
Don’t know
31The mobile maze
32 The mobile maze
Better explanati
on of
sim
pler
tarif
fs
Focu
s in
youn
g con
sumers
Prep
aid
3G no
t ig
nored
More prepaid options
Clear changing better c
ustom
er e
duca
tion
Stronger privacy security protection
Usage-based charges Sim
pler tariffs
Increase awareness an
d rele
vanc
e
Customer service and comm
ercial innovations
Bett
er ho
us
ehold
ana
lys
is
(Low
est s
pe
nders)
Service choices
Smartphones drive usage
Segm
ent p
rodu
cts
Migration from 2G, 3G and 4G
capacity
Lack of network
Poor comm
unication service
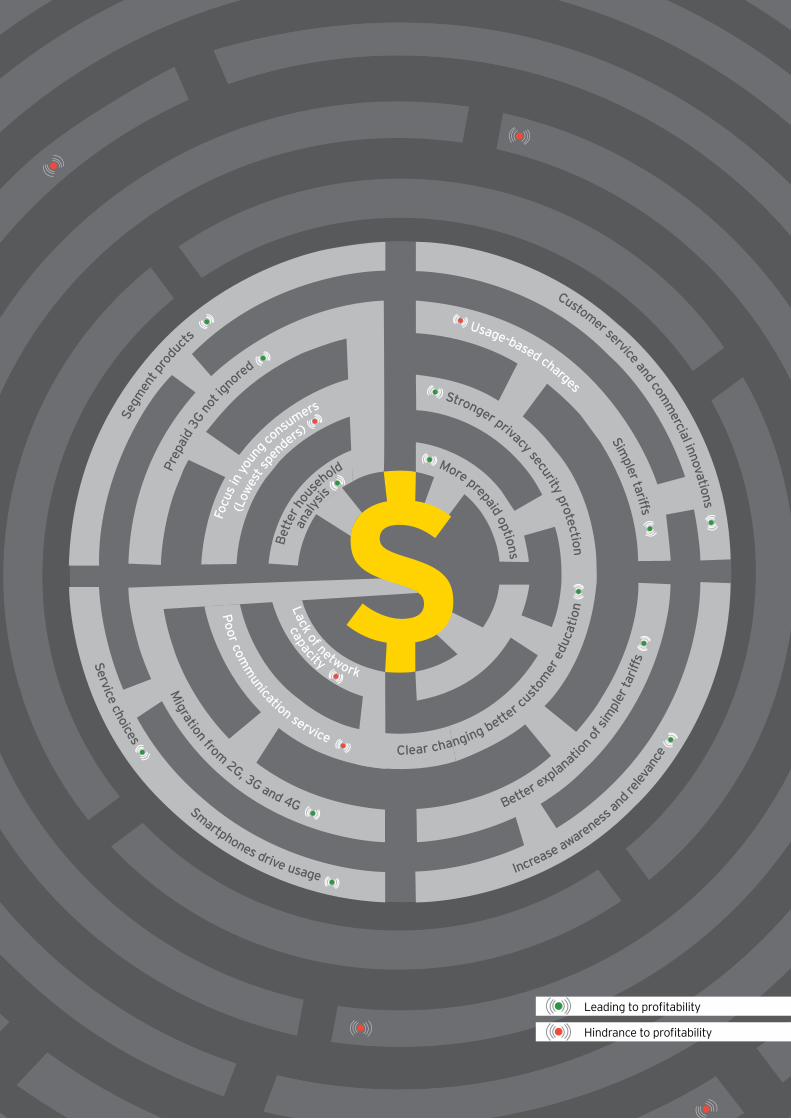
Navigating the mobile maze
5.
While demand for mobile data services has never been higher, a significant proportion of end-users feel overwhelmed by the array of pricing options and new functionalities available through their service providers. As operators help end-users tackle the mobile maze, the challenge is to ensure that new propositions are clearly articulated — and that customers feel empowered to choose the right price plan and service combinations.
Operators need to communicate more effectively with their customers, bearing in mind that increased choice can be a burden for many end-users who prize convenience at an appealing price. Opportunities to educate customers on the suitability of data price plans and new services have to be taken. At the same time, operators should leverage their trusted customer relationships to reassure users that smart services add value without compromising privacy and security.
Much can be done to make services more appealing to specific user groups, whether older smartphone users or customers in sparsely populated areas where mobile networks can reach further than traditional infrastructures. Traditional distinctions between prepaid and postpaid users in terms of propensity to spend and take-up new services also need to be revisited. Meanwhile, targeted network investment is just as important than an improved dialogue with consumers on service and price plan benefits.
Closer engagement with specific customer segments can drive greater take-up of new services, build higher levels of customer loyalty and make mobile data propositions more profitable. Converting service triallists into users and boosting existing usage frequency are vital if the explosive take-up of smart devices is to provide a platform for the continued growth of the mobile industry.
33The mobile maze
Better explanati
on of
sim
pler
tarif
fs
Focu
s in
youn
g con
sumers
Prep
aid
3G no
t ig
nored
More prepaid options
Clear changing better c
ustom
er e
duca
tion
Stronger privacy security protection
Usage-based charges Sim
pler tariffs
Increase awareness an
d rele
vanc
e
Customer service and comm
ercial innovations
Bett
er ho
us
ehold
ana
lys
is
(Low
est s
pe
nders)
Service choices
Smartphones drive usage
Segm
ent p
rodu
cts
Migration from 2G, 3G and 4G
capacity
Lack of network
Poor comm
unication service
Leading to profitability
Hindrance to profitability
34
We have analyzed the findings of our mobile maze study to identify issues facing the global communications industry. EY service offerings that can help operators address each issue, drawing on our wealth of experience in delivering these solutions for operator clients worldwide to inform and enrich the research analysis in this report. As operators strive to broaden their service offerings and grow their mobile data revenues, we are finding that demand for — and the client benefits delivered by — our solutions are increasing rapidly over time. This in turn is helping us refine and evolve the solutions to escalate the benefits for clients further.
How EY can help
The mobile maze
Cont
acts
Jonathan DharmapalanGlobal Telecommunications [email protected]
Global Telecommunications Markets Leader [email protected]
Prashant Singhal
Olivier LemaireTelecommunications Leader — [email protected]
Luis MontiTelecommunications Leader — Americas [email protected]
David McGregorTelecommunications Leader — Asia-Pacific [email protected]
Masahiko TsukaharaTelecommunications Leader — [email protected]
Holger ForstGlobal Telecommunications Markets Leader [email protected]
To learn more about how can help your business make the most of its opportunities in mobile data services, please contact:
35The mobile maze
EY | Assurance | Tax | Transactions | Advisory
About EY EY is a global leader in assurance, tax, transaction and advisory services. The insights and quality services we deliver help build trust and confidence in the capital markets and in economies the world over. We develop outstanding leaders who team to deliver on our promises to all of our stakeholders. In so doing, we play a critical role in building a better working world for our people, for our clients and for our communities.
EY refers to the global organization, and may refer to one or more, of the member firms of Ernst & Young Global Limited, each of which is a separate legal entity. Ernst & Young Global Limited, a UK company limited by guarantee, does not provide services to clients. For more information about our organization, please visit ey.com.
How EY’s Global Telecommunications Center can help your businessTelecommunications operators are facing a rapidly transforming business model. Competition from technology companies is creating challenges around customer ownership; and service innovation, and pricing pressures and network capacity are intensifying scrutiny on return on investment. Additionally, regulatory pressures and shareholder expectations require agility and cost efficiency. If you are facing these challenges, we can provide a sector-based perspective to addressing your assurance, advisory, transaction and tax needs. Our Global Telecommunications Center is a virtual hub that brings together people, cultures and leading ideas from across the world. Whatever your need, we can help you improve the performance of your business.
© 2013 EYGM Limited. All Rights Reserved.
EYG No. EF0128CSG/GSC2013/1115394ED 0114
In line with EY’s commitment to minimize its impact on the environment, this document has been printed on paper with a high recycled content.
This material has been prepared for general informational purposes only and is not intended to be relied upon as accounting, tax, or other professional advice. Please refer to your advisors for specific advice.
ey.com