Embed Size (px)
Citation preview

By Sarah Kee, BSc PGCE
QC Scientific Consultant, Randox Laboratories
QComplete QC solutions for results you can trust
Improving Laboratory Performance Through Quality Control
Five simple steps for QC success
Troubleshooting QC Problems:
Your QC has failed, what do you do next?
QUALITY CONTROL

2
Your QC has failed, what do you do next?
When it comes to troubleshooting QC errors, unfortunately there is no easy path to take. However, it’s important that you have standard operating procedures in place, outlining what to do in the event of an out-of-control error. Errors occur in laboratories all over the world. A lab with effective troubleshooting procedures in place will still have errors but will be able to detect them, quickly reducing their impact and reducing the risk of wasting both time and money.
So you ran QC this morning and realised that one of your analytes has been flagged as “out-of-control”, what do you do next? Do you ignore the warning and continue patient testing, repeat the control until it’s within range or do you halt patient testing and investigate the source of the error?
Put the problem into perspective before you begin troubleshooting
Review your Levey-Jennings
charts to understand the
type of error that has occurred
Relate the type of error to possible
causes
Implement corrective
actions, check the effectiveness of the corrective actions and document the
solution
Although there is perhaps no correct way to go about troubleshooting, here are some helpful tips that your laboratory can use in order to ensure it has effective troubleshooting procedures in place.
1
2
3
4

3
1. Put the problem into perspective before you begin troubleshooting
• Outline what you recognise as an out-of-control event
• It’s important to estimate the magnitude and size of the out-of-control event before you attempt to correct it.
Using QC multi-rules is a great way to ensure sensitive error detection, whilst keeping the false rejection rate low. Make sure you outline what you recognise as an out-of-control event that warrants corrective action to take place. In the event that a series of QC multi-rules have been broken, you should halt patient testing immediately until the problem has been rectified. In the event that only a single rule has been broken, you should repeat the control ensuring you do so only once.
It’s important to estimate the magnitude and size of the out-of-control event before you attempt to correct it. It’s a good idea to monitor your average patient mean or test a known patient sample. That way, you can measure the extent of the problem and the effect the out-of-control event has had on patient results.
Measuring the direction and magnitude of the shift in results, can help you decide whether any clinically significant errors may have occurred and whether or not you need to repeat patient results.
When an out-of-control event has occurred, ISO 15189 requires laboratories to “evaluate the results from patient samples that were examined
after the last QC event”.
Ensure you know how many samples were run from the last QC event and do not release any patient results until the problem has been rectified.
4
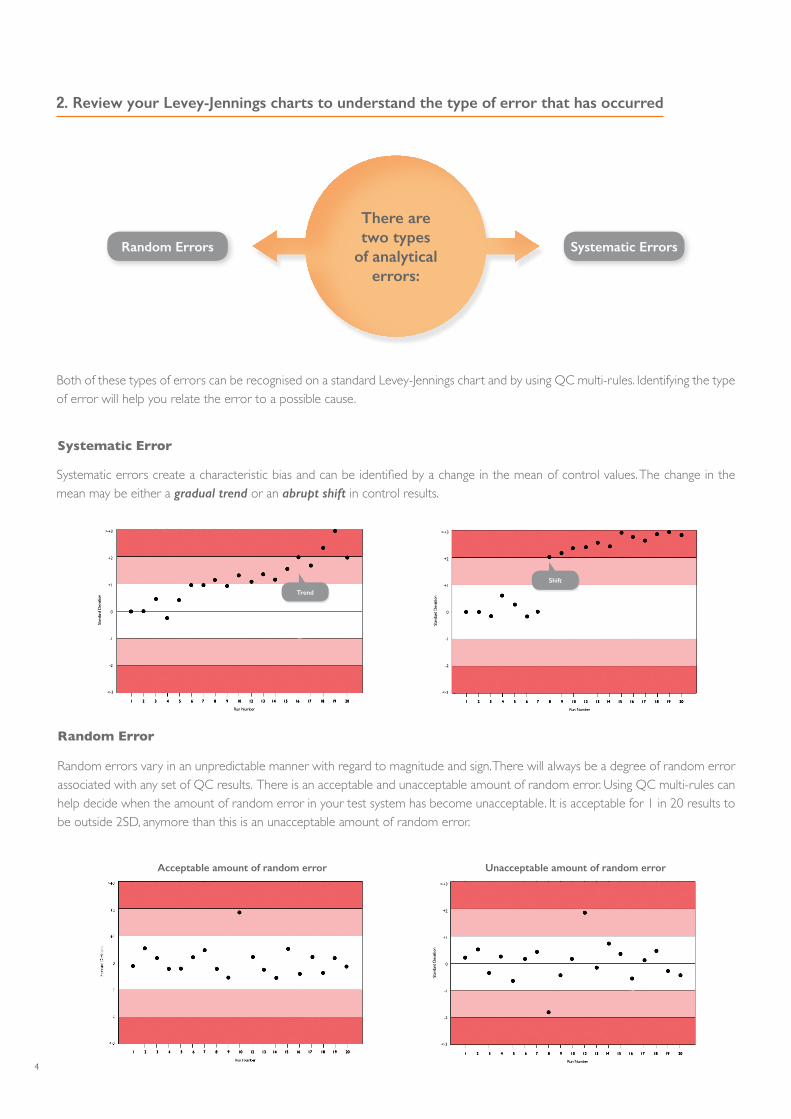
Systematic errors create a characteristic bias and can be identified by a change in the mean of control values. The change in the mean may be either a gradual trend or an abrupt shift in control results.
Random errors vary in an unpredictable manner with regard to magnitude and sign. There will always be a degree of random error associated with any set of QC results. There is an acceptable and unacceptable amount of random error. Using QC multi-rules can help decide when the amount of random error in your test system has become unacceptable. It is acceptable for 1 in 20 results to be outside 2SD, anymore than this is an unacceptable amount of random error.
>+3
+2
+1
0
-1
-2
<-3<-3
Stan
dard
Dev
iatio
n
1 2 3 4 5 6 7 8 9 10 12 13 14 15 16 17 18 19 20
Run Number
>+3
+2
+1
0
-1
-2
<-3<-3
Stan
dard
Dev
iatio
n
1 2 3 4 5 6 7 8 9 10 12 13 14 15 16 17 18 19 20
Run Number
Trend
Shift
Acceptable amount of random error Unacceptable amount of random error
Systematic Error
Random Error
1 2 3 4 5 6 7 8 9 10 12 13 14 15 16 17 18 19 20
>+3
+2
+1
0
-1
-2
<-3<-3
Stan
dard
Dev
iatio
n
1 2 3 4 5 6 7 8 9 10 12 13 14 15 16 17 18 19 20
Run Number
2. Review your Levey-Jennings charts to understand the type of error that has occurred
There aretwo types
of analyticalerrors:
Random Errors Systematic Errors
Both of these types of errors can be recognised on a standard Levey-Jennings chart and by using QC multi-rules. Identifying the type of error will help you relate the error to a possible cause.

5
1 2 3 4 5 6 7 8 9 10
+3s
+2s
+1s
M
-1s
-2s
-3s
Run Number
Stan
dard
Dev
iatio
n
Rule 12s: This is a warning rule that is broken when a single control observation is outside the +/-2s limits. This rule warns that either a random or systematic error is present in the test system. If no other unacceptable results are apparent in the test system, it must be assumed that this is simply a random error and no further troubleshooting action is necessary.
Rule 22s: This rule is broken when two results are greater than 2s on the same side of the mean. It is indicative of systematic error. It could indicate the start of a trend or a shift in QC results.
1 2 3 4 5 6 7 8 9 10
+3s
+2s
+1s
M
-1s
-2s
-3s
Run Number
Stan
dard
Dev
iatio
n
12s Rule
Using QC Multi-rules to Identify Systematic and Random Error
You can use QC multi-rules to differentiate between systematic and random error.
Rule 13s: Any QC result outside +/-3s breaks this rule. This rule identifies unacceptable random error or possibly the beginning of a large systematic error. If this rule is broken, troubleshooting should occur to investigate the source of the error.
1 2 3 4 5 6 7 8 9 10
+3s
+2s
+1s
M
-1s
-2s
-3s
Run Number
Stan
dard
Dev
iatio
n
13s Rule
1 2 3 4 5 6 7 8 9 10
+3s
+2s
+1s
M
-1s
-2s
-3s
Run Number
Stan
dard
Dev
iatio
n
22s Rule
1 2 3 4 5 6 7 8 9 10
+3s
+2s
+1s
M
-1s
-2s
-3s
Run Number
Stan
dard
Dev
iatio
n
Rule R4s: If there is at least a 4s difference between control values within a single run, this rule is violated and can represent random error.
1 2 3 4 5 6 7 8 9 10
+3s
+2s
+1s
M
-1s
-2s
-3s
Run Number
Stan
dard
Dev
iatio
n
R4s Rule
Rule 7X, 8X, 9X 10X and 12X: These rules are broken when 7, 8, 9, 10 or 12 QC results are on the same side of the mean. This is indicative of a systematic error. Again, these rules don’t necessarily require you to reject the analytical run. As long as the error is not clinically significant, there is no need to carry out any troubleshooting. However, this analytical bias can be eliminated by performing calibration or instrument maintenance.
41s Rule
31s Rule7x Rule
Rule 31s: When three respective control results are greater than 1s and on the same side of the mean. Rule 41s: When four results are greater than 1s and on the same side of the mean. Both these rules are indicative of systematic error but don’t necessarily require you to reject the analytical run. As long as this error is not clinically significant there is no need to troubleshoot this small amount of error. However, this analytical bias can be eliminated by performing calibration or instrument maintenance.
6
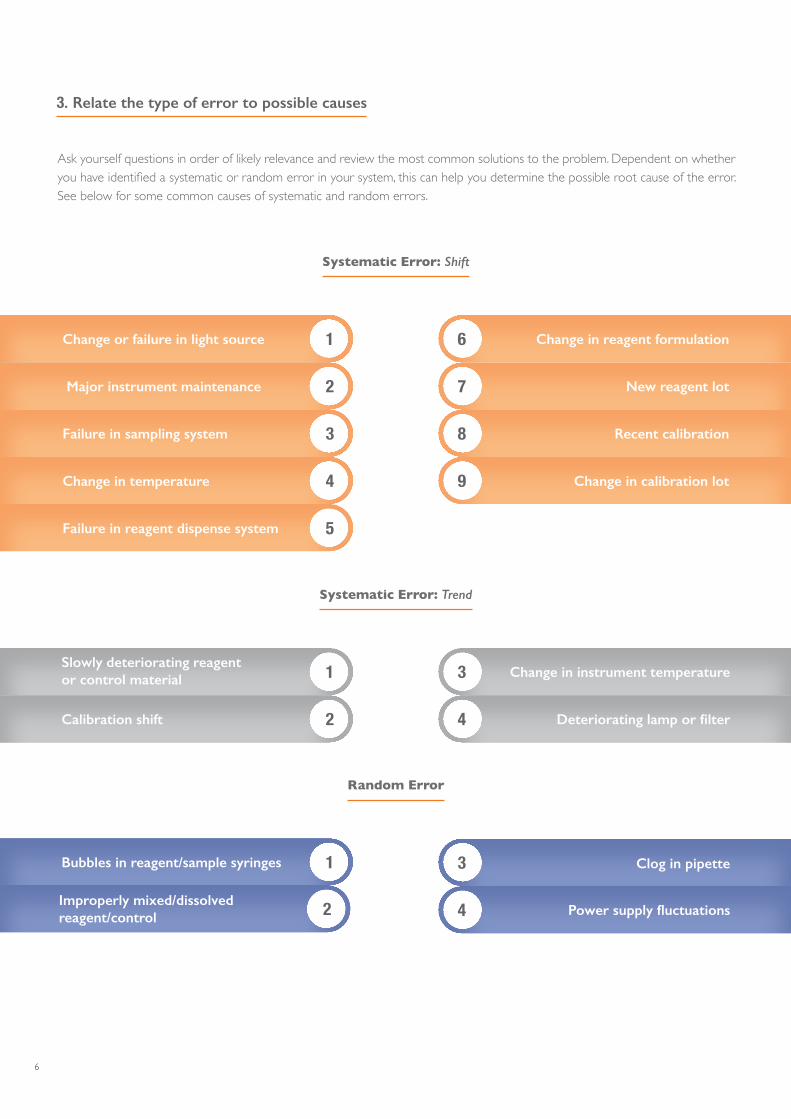
3. Relate the type of error to possible causes
Ask yourself questions in order of likely relevance and review the most common solutions to the problem. Dependent on whether you have identified a systematic or random error in your system, this can help you determine the possible root cause of the error. See below for some common causes of systematic and random errors.
Change or failure in light source 1
Major instrument maintenance 2
Failure in sampling system 3
Change in temperature 4
Failure in reagent dispense system 5
Change in reagent formulation6
New reagent lot7
Recent calibration8
Change in calibration lot9
1
2
3
4
1Slowly deteriorating reagent or control material
2Calibration shift
3 Change in instrument temperature
4 Deteriorating lamp or filter
Bubbles in reagent/sample syringes
Improperly mixed/dissolved reagent/control
Clog in pipette
Power supply fluctuations
Systematic Error: Shift
Systematic Error: Trend
Random Error

7
4. Implement corrective actions, check the effectiveness of the corrective actions and document the solution
Once you have identified possible causes of the out-of-control event, implement any necessary corrective action. It’s important that you implement only one change at a time and monitor the improvement of that change on your QC and patient results. It’s important that you document the solution and learn from your previous laboratory failures. Put procedures in place to prevent any errors from reoccurring. Remember that a single unacceptable result is most likely due to random error. In this instance re-run the sample, if the result of repeat analysis is acceptable then corrective actions is not required. If the issue persists, investigate possible sources of systematic error. See below for some suggested actions that may help to resolve systematic errors:
In conclusion, make sure you have effective troubleshooting procedures in place. Keeping these few tips in mind will help assure your laboratory is on the right track when it comes to troubleshooting QC failures.
Perform instrument
maintenanceRecalibrate instrument
Review reagent / sample
storage e.g.
Check pipettes
Prepare fresh
reagents and re-run
sample
Perform staff training

8Information correct at time of print. Randox Laboratories Ltd is a subsidiary of Randox Holdings Limited a company registered within Northern Ireland with company number N.I. 614690. VAT Registered Number: GB 151 6827 08. Product availability may vary from country to country. Please contact your local Randox representative for information. Products may be for Research Use Only and not for use in diagnostic procedures in the USA.
QUALITY CONTROL
Randox Laboratories Ltd, 55 Diamond Road, Crumlin, County Antrim, BT29 4QY, United Kingdom +44 (0) 28 9442 2413 +44 (0) 28 9445 2912 [email protected] randoxqc.com
find out more
24•7
Compatible for use with the Acusera range of third party controls, the Acusera 24•7 software is designed to help laboratories monitor and interpret their QC data. Access to an impressive range of features including interactive charts and real time peer group data generated from our extensive database of laboratory participants, ensures Acusera 24•7 is the most comprehensive package available.
Online QC software with real-time peer group statistics
Comprising over 360 routine and esoteric parameters in 24 comprehensive and flexible EQA programmes, RIQAS is designed to cover all areas of clinical testing. Each programme benefits from a wide range of concentrations, frequent reporting and comprehensive yet user-friendly reports.
The largest global EQA scheme with over 31,000 lab participants
Uniquely combining more than 100 parameters conveniently in a single control, laboratories can significantly reduce costs and consolidate without compromising on quality. As true third party controls, unbiased performance assessment with any instrument or method is guaranteed.
True third party controls offering complete test menu consolidation
JUL1
5