Embed Size (px)
Citation preview

RAPID EPIDEMIOLOGICAL METHODS
Moderator: Prof. Y. Manihar Singh
Date of presentation: 24/06/15

Format of presentation
Introduction Rapid epidemiological methods
Sampling methodsData collection methodsAnalysis and presentation of aggregate level
dataRapid assessment in EmergencyConclusions

In developing countries -Scant resourcesFew skilled peoplesNot reflect the needs or priorities of the
populationLack of data specially in local levelsData are rarely analyzed Published after long time

As Health manager are you willing to wait for long time for information?

No

Need:
Timely
Accurate information
At low cost

Rapid assessment refers to a broad collection of
epidemiological, statistical and anthropological
techniques which aim to provide accurate information
quickly, at a low cost, in a simple format
e.g. EPI cluster sampling method to evaluate nutritional
status of under five children

Historical aspects of REA
1981=ACHBRD was formed to met to identify areas
of research to improve health of developing countries
WHO developed novel epidemiological sampling and
surveillance methods for small pox eradication in
EPI.
Committee named as Rapid Epidemiological
assessment

REA began an amalgam of concepts and techniques
borrowed from the fields of health services research
and operations research, as well as traditional
epidemiology
Largely inspired by the ‘quick and dirty’ methods of
epidemiology

Aspects of Rapid methods
1. Sampling methods for rapid health assessment
* WHO-EPI cluster sampling
* LQAS
* Case-control methodology
2. Collection, organization and analysis of data
*Methods of Data collection: Focus-group discussion, key-informant interviews, observations, case reports, personal diaries

conversations, participant observations, collection
of data from secondary sources
Methods of organizing, analyzing and presenting
data : Geographical Information Systems
3. Rapid assessment in emergency situations

I. Quantitative methods I. Quantitative methods
a. WHO-EPI cluster sampling
b. LQAS
c. Case-control methodology

Traditional Cluster sampling method
• Population are divided into non-overlapping
subgroups(cluster) based on political and
geographical reason
• Clusters are selected randomly
• Within each cluster, each subject is sample
• Two stage cluster sampling random sample of
clusters is selected and within each cluster a random
sample of subject is selected

Advantages
Only need to obtain list of units in the selected clusters
Cost effective
Disadvantages
Not intended for calculation of estimates from
individual cluster
Less precise than simple random sampling


• Developed by WHO in 1978
• Goal :to estimate immunization coverage to
within ±10 percentage points of the true
proportion, with 95% confidence interval

• To identify clusters we should know the total
population of the area to be surveyed and the
population of the cities, towns and villages in
the area
• Make a list of the communities ,with their
population size and calculate the cumulative
population size

Tab 1: List of communities, showing cumulative population size
Community Population size Cumulative population size
D 1100 1100
F 2800 3900
P 5000 8900
S 600 9500
H 9400 18900
E 3200 22100
A 3500 25600
Q 1200 26800
C 4300 31100
etc ……. 12030

• A sampling interval is a number used to systematically
select clusters
• Calculate a sampling interval by using the formula
below:
Total population to be surveyed
30
• Should be rounded off to the nearest whole number

• Select a random number which is less than or equal to
the sampling interval
• The number must have the same number of digits as
the sampling interval
• Identify the community in which Cluster 1 is located.
This is done by locating the first community listed in
which the cumulative population equals or exceeds
the random number

• Identify the community in which Cluster 2 is located
by using the formula below:
• The cumulative population listed for that community
will equal or exceed the number you calculate
• Random number + sampling interval =______ and
so on

Example:
• Total population=120300, sampling
interval:120300/30=4010
• If the random no is 1946, so 1st cluster population
is=1946, this number fall in community F, select F
community

Tab:2 List of communities, showing cumulative population size
Community Population size Cumulative population size
D 1100 1100
F 2800 3900 (1st)
P 5000 8900
S 600 9500
H 9400 18900
E 3200 22100
A 3500 25600
Q 1200 26800
C 4300 31100
etc ……. 12030

• 2nd cluster population :(1946+4010)=5956, P
• 3rd cluster will be:(5956+4010)=9966, select H
• 4th cluster: (9966+4010)=13976, it also falls in H
community
• Resulting communities are selected with a
probability with proportional to size

Tab 3: List of communities, showing cumulative population size
Community Population size Cumulative population size
D 1100 1100
F 2800 3900 (1st)
P 5000 8900 (2nd)
S 600 9500
H 9400 18900 (3rd & 4th)
E 3200 22100
A 3500 25600
Q 1200 26800
C 4300 31100
etc ……. 12030

• In the 2nd stage of sampling, 7 subjects are selected
within each cluster
• The subjects are chosen by selecting a household and
every eligible subject in the household is included in
the sample
• With traditional PPS cluster sampling, each of the 7
subjects would be randomly selected

Select the starting household
The first house to be visited in each cluster should be selected at
randomly
Areas where house list were not available
Select central position of the village and spin a bottle to select
direction
If most children attend school, randomly select one child from the
attendance list and use the house of that child as the starting point
.

only the 1st household is randomly selected and all
eligible subjects in that household are sampled
After the 1st household is visited, the surveyor moves
to the “next” household, which is defined as the one
whose front door is closest to the one just visited
This process continues until all 7 eligible subjects are
found
Select subsequent households


Not all of the first 7 households visited will
necessarily have an eligible subject, therefore >7
households may have to be visited
Also <7 households may need to be selected if there
is >1eligible subject per household.
The information from each cluster is then combined
to obtain an overall estimate of immunization
coverage

Disadvantages
Chances of biased estimate
Estimates for individual clusters cannot be
calculated
When immunization coverage is extremely high
(e.g. only 1 person in 1000 is not immunized),
estimating this proportion to within 10 percentage
points is not very informative

Advantages
Easier to use
More economical
No need for list of all the units which makes it more
feasible
Decreased travel time & preparation

Stratified sampling
• Population is divided into non-overlapping
subpopulations(strata) basis of some known
characteristics that is believed to be variable of
interest
• Random sample is taken from every strata
• Sampling frame for each strata is required
• Can obtain estimates from each strata
• Strata are chosen to be homogenous
• Sample size usually large enough to obtain precise
estimates from each stratum


Advantages
Production of estimates and corresponding
confidence intervals for each stratum
Increased precision over a SRS
Disadvantages
A list of all the units with in each stratum required

Lot quality assurance sampling
• Originated in the manufacturing industry for quality
control purposes in determining weather batch, or lot,
of goods met the desired specifications
• Rather than checking each item in the lot decided to
check sample of lots to accept or reject entire lot
• Only out come is “acceptable” or “Not acceptable”

• Sample size and decision values for lot quality
assurance sampling are based on the risks that the
investigators are willing to take
• Sample size is the number of units that are selected
from each lot
• Decision value is the number of defective items needs
to be found before the lot is deemed unacceptable

• Two type of risk
a) Accepting bad lot(Type-I error)
b) Not accepting good lot(Type-II error)

LQ is used by health workers to monitor the quality
of immunization and other services
To identify health centres or other health service units
that are not meeting coverage targets or other
standards, so that attention can be directed to the units
most in need

• Lots may be villages and communities, catchment
areas of hospitals or health centres, groups of health
care workers, or even health records
• Individuals may be classified as "failed to receive
appropriate treatment" or "received appropriate
treatment”
• Individuals are classified as "unimmunized" or
"immunized"

Uses:
To decide whether 1 or more health service units is
meeting a specified standard of performance — Lot
Quality Assessment
To measure immunization coverage, which is done by
aggregating data from all health service units in the
area being surveyed— Lot Quality Coverage Survey

Advantages
To make judgements about individual health service
units (i.e.lots). Allows managers to direct supervision
and other resources to the units that need it most
To interpret data as soon as they are collected from a
health service unit. Data do not have to be collected
from all units before action can be taken

Disadvantages Specific levels of coverage can be calculated only for all of
the units in the study
Selecting a lot sample size and a decision value, involves
the assessment of risks
The risk to the service provider is that resources will be
spent on relatively good health service units because they
have been wrongly identified as unacceptable
The consumer or client risk is that real health service
problems will be wrongly identified as acceptable and
nothing will be done to improve them

STEPS FOR CONDUCTING LQAS

Identify the target populations
Target populations : Children aged 12-23 months to
assess immunization coverage among children
Mothers of children aged 0-11 months to assess
tetanus toxoid coverage and
To determine whether their children were protected
at birth against neonatal tetanus

Set assessment criteria Depends on what you are studying
To assess children’s immunization coverage, need to
determine whether each child in a sample is “fully
immunized” or “not fully immunized”
Fully immunized: Child has received all of the
immunizations recommended in the official immunization
schedule
Not fully immunized: Child has not received all of the
immunizations recommended in the official immunization
schedule

Step 1: Set a level of accuracy for the survey results

The level of accuracy tells you how close a
measurement is to the true value of what is being
measured
The LQ technique gives you a choice of accuracy
levels from +1% to +10%

When you choose a higher level of accuracy, i.e.,
below 10%, you need a larger sample
Very high accuracy (e.g., + 1%) requires very large
sample sizes
Since a larger sample means more work in collecting
and analyzing data, we must balance the need for
accuracy with time and resource considerations

Step 2: Set a level of confidence for the survey results

In traditional 30/7-cluster surveys, the level of
confidence is set at 95%
In studies using the LQ technique, you may choose
one of three levels,90%, 95% and 99%, although
95% is still recommended for most studies

Step 3: Make a first estimate of total sample size

Step 4: Estimate the size of the target population from which you will select the
sample Estimate how many individuals are there in the
target population, eg., the number of children in the
survey area who are l2-23 months of age
If reliable numbers are available from local vital
statistics or birth registries, use them
If not, you can base a calculation on estimates of the
total population size and the proportion of children
12-23 months in the population

In most developing countries, children in this age
range make up approximately 3% of the population
This is the percent that WHO/EPI recommends using
when actual rates are not available

Step 5: Calculate a sampling fraction to decide whether you should reduce the
total sample size
To determine whether your total sample size is too
large, divide the total sample size by the target
population to find the sampling fraction:
Total sample size x 100 = % (sampling fraction)
Target population

If the sampling fraction is more than 10%, recalculate
the total sample size:
Total sample size = revised total sample size
1 + sampling fraction
A sampling fraction shows what proportion of a total
population will be included in a study
This fraction will tell you whether your total sample
size is too large in comparison to the total population

Step 6:Count the number of lots to be studied
For the studies of health services, lots are usually the
geographical areas in which the target population
lives
These may be health centre catchment areas,
communities assigned to different health workers, or
communities for which different supervisors are
responsible
Lots can also be neighborhoods, zones, or wards of a
city or even districts in a province

Step 7: Calculate the minimum lot sample size
Total sample size = Minimum lot sample size
Number of lots
The lot sample size is the same for every lot,
regardless of its population size
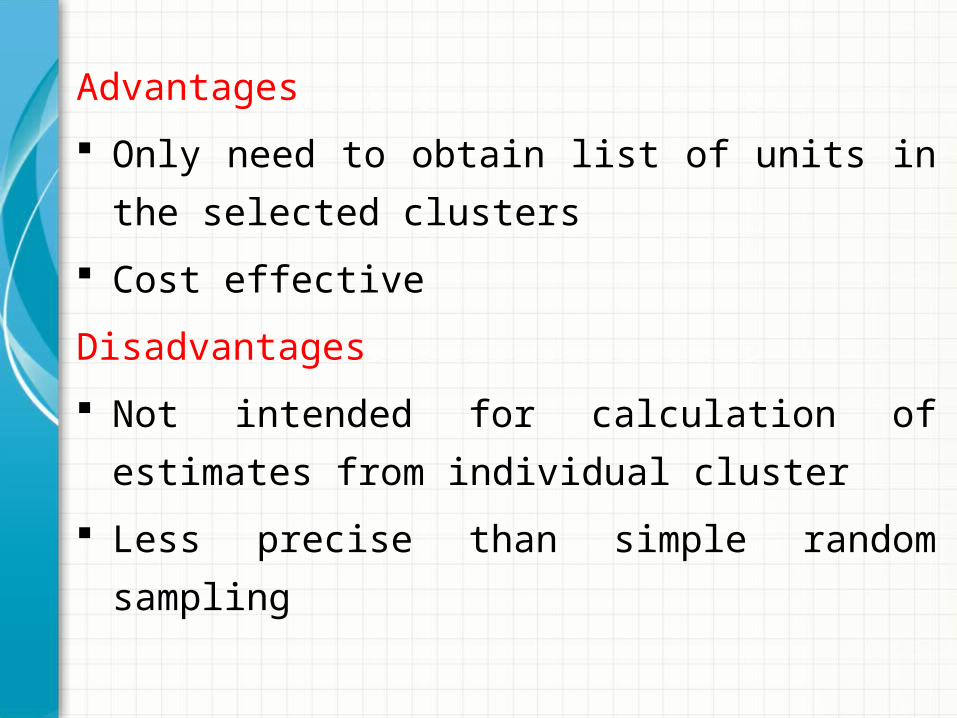
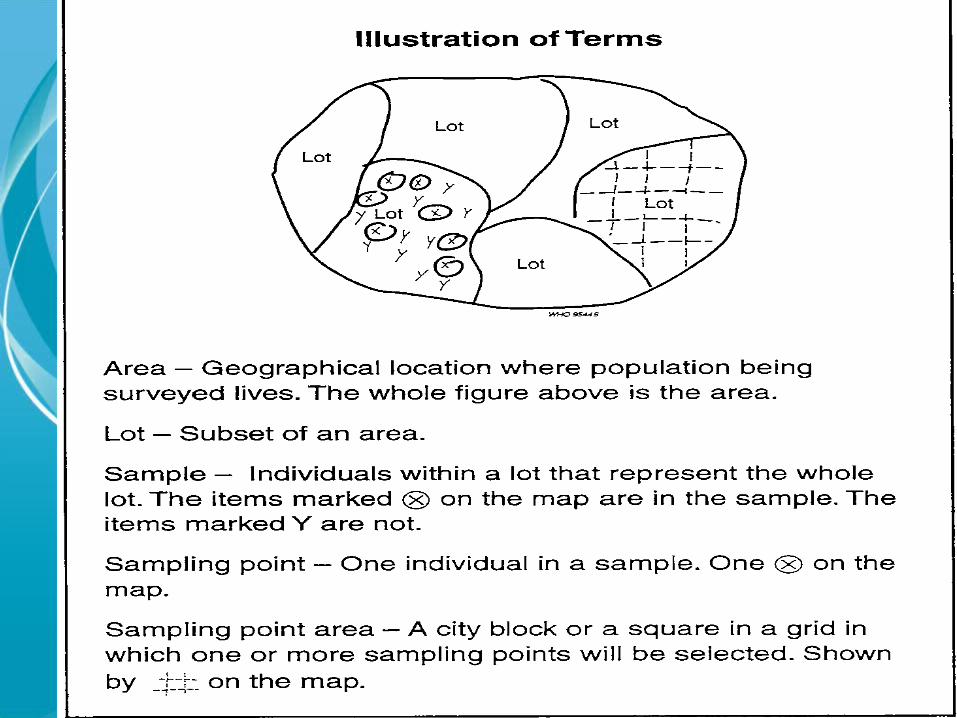
Step 8: Set a low threshold level
A threshold is a percentage used to assess the
performance of a lot
2 threshold levels are recommended for LQ studies
A level at which good lots will be judged
“accceptable”
A level at which bad lots will be judged
“unacceptable”

A low threshold is based on estimates of coverage
obtained from sources such as routine reporting etc
Lower than the average estimated coverage but above
the worst units, a low threshold represents a level of
coverage that managers feel is “unacceptable”
Lots found to be below this level will be given
priority for remedial action

Step 9: Set a high threshold level
Based on the coverage goal set at the national level
Needed to determine the decision value
The high threshold is not used to judge lots as
“acceptable” or “unacceptable”

Step 10 Select a decision value
• A decision value is the highest number of individuals
in a lot that you can find to be not receiving a service
and yet still classify the lot as acceptable
• If you find one more individual than the decision
value, you judge the lot unacceptable, or reject the
lot; if you find the same number or fewer individuals
than the decision value, you accept it

Table for selecting Decision values


Which method will be appropriate?
1.Is it interest of make inference about each
individual population?
If yes, LQAT
2.Are subpopulations heterogeneous or
homogenous?
If heterogeneous 30/7 cluster sampling
3.How difficult is to obtain a list of all the units of
population?
If difficult then 30/70

4.What is the desired precision of the estimates?
30/7 precision level is fixed ±10 percentage point
at 95% confidence interval
5.Is the event of interest very rare or very common?
If event is rare 30/7 is not appropriate

6.What knowledge is there about the actual level of
immunization coverage in the population?
Actual level of event coverage is required for LQAS
methods
7.What is the budget for the survey?
Less budget go for 30/7 cluster sampling
8.What is experience level of field worker
Less experience go for 30/7 cluster sampling

Difference between EPI cluster sampling and LQAS
Issue 30/7 cluster sampling LQAS
Sampling design Two-stage cluster sampling Stratified random sampling
Subpopulations Called clusterUsually based on geographical and political boundaries
Called lotsUsually based on geographic and political boundaries
Sample size N=210 Dependent on the desired proportion and level of risks, may be much larger than 210
List of Units No need for list of units Needs for list of all units of population
Basis for inference
Confidence interval for estimate
Hypothesis test

Issue 30/7 cluster sampling LQAS
Outcomes Overall estimates of immunization coverage, Estimates from individuals cluster should not be calculated
Overall estimates of immunization coverage, individuals lots are judged to be acceptable or not
precision Set to be within ±10 percentage points of the population value
Can be set at different level
Cost Decrease travel and preparation time Needs to sample each lot, yielding higher cost
Reasons for potential bias
Heterogeneous cluster, the households are not randomly selected, all eligible subjects in households are sampled
Small samples in each lot
When to use
Interest in an overall population estimate obtained at a low cost
Interested in information from each lot, and a traditional stratified sample not affordable

(c) Case – control methodology
• Consider as a rapid and efficient means
to evaluate health programmes,
products,
procedures such as screening programmes
diagnostic tests, and
evaluation of the quality of medical services

Examples:
Effectiveness of water & sanitation program in
reducing diarrhea in Philippines (1989)
cases were children attending the clinic for diarrhoea
controls were chosen from those patients presenting
to the clinic with a disease not known related to water
and sanitation, in this case respiratory disease
exposure variable was whether the person came from
the intervention area or not
compared with traditional prospective studies

Finding was suggested that case-control methods
provide
Increase efficiency
Reduce in cost
Important information to improve health services
However, designing a case-control study is not
simple, and requires inputs from researchers well
trained in epidemiology or biostatistics

II. Qualitative methods for II. Qualitative methods for data collectiondata collection

(a) Focus – Group Discussions(FGDs)

• Rapid assessment, semi‐structured data gathering
method in which a purposively selected set of
participants gather to discuss issues and concerns
based on a list of key themes drawn up by the
researcher/facilitator (Kumar 1987)
• Originally developed to give marketing researchers a
better understanding of the data from quantitative
consumer surveys

• Has become extremely popular because it
provides a fast way to learn from the target audience
and is cost‐effective for eliciting views and opinions of
prospective clients, customers and end‐users to obtain
insights into target audience perceptions, needs,
problems, beliefs, and reasons for certain practices
• FGDs can be conducted before a program begins,
during or after a program ends

• Useful for exploring people’s knowledge,
experiences, opinions, attitudes
• To examine
– what people think
– how they think
– why they think that way

Description of FGDs
• Group of 6-12 people with similar characteristics
• To discuss a focus topic of interest
• A moderator/ facilitator guides the discussion
• A note-taker records the non-verbal aspect
• Should not last more than 60-90 minutes
• Tape recorded notes and non-verbal notes are
transcribed for analysis

How many?
- “theoretical saturation”
- practical concerns
- recommendation

Data capturing in FGD
Video recording:
• captures verbal & non-verbal information
• can be intrusive, inhibit some participants
Audio recording:
• records verbal information per verbatim
Manual note taking:
• hand writing discussion per verbatim

Results
• Qualitative:
– Themes, Issues, Concerns
– Substantiating Quotes
• Quantitative:
– No. of participants who agreed or disagreed
– Frequency of themes within the group discussion
– Sample characteristics

Strengths & Limitations
Focus group
methodology is only as
useful and as strong as
its link to the underlying
research question and
the rigor with which it is
applied

• Provides concentrated amounts of rich data, in
participants’ own words, on precisely the topic of
interest
• Interaction of participants adds richness to the data
that may be missed in individual interviews
• Provides critical information in development of
hypotheses or interpretation of quantitative data

Limitations
• Small number of participants
• Limited generalizability
• Group dynamics can be a challenge
– Particularly if moderator is inexperienced
• Interpretation
– Requires experienced analysts

(b) Key Informant Interviews(KIIs)

Who is a key informant?
• A person with unique skills or professional background
on the issue being evaluated
• A person who knows what is going on in the community
(community leaders, professionals, or residents) & who
has first hand knowledge about the community
• Someone who is knowledgeable and can help in better
understanding of the project participants, their
backgrounds, behaviors, and attitudes and any language
or culturally relevant considerations

Someone who
can ‘unlock’
key
information
for you!

Techniques used to conduct key informant
interviews:
– Telephone Interviews
– Face-to-Face Interviews
When to conduct key informant interviews?
•To get information about a pressing issue or problem in
the community from a limited number of well-
connected and informed community experts
•To understand the motivation and beliefs of
community residents on a particular issue

• To get information from people with diverse
backgrounds and opinions and be able to ask in-depth
and probing questions
• To discuss sensitive topics, get respondents’ candid
discussion of the topic, or to get the depth of
information you need

STEPS:
•Gather and review existing data
•Determine what information is needed
•Determine target population and brainstorm about possible key informants
•Choose key informants (Diversity is important)
•Choose type of interview (Persistence is key)
•Develop an interview tool
•Determine documentation method
•Select designated interviewer(s)
•Conduct key informant interviews
•Compile and organize key informant interview data

• Analysis: summary sheets, codes, storage & retrieval,
presentation
• Example: KIIs with TBAs & indigenous medical
practitioners

Advantages
• Provides in-depth and rich information about a topic,
gives an opportunity to explore causes of problems
• Relatively easy and inexpensive
• Allows interviewer to establish rapport with the
respondent and clarify questions
• Permits personal contact and provides an opportunity
to build or strengthen relationships with important
community stakeholders
• Can raise awareness, interest, and enthusiasm around
an issue

Disadvantages
• Conducting many interviews can be time consuming
• Relationship between evaluator and informants may
influence responses and interviewee may distort
information through biases
• May overlook perspectives of community members
who are less visible
• Difficult to generalize
• Large volume of information, difficult to quantify and
organize

(c) Observation

• It is a simple process of observing and recording
events or situations
• Can often reveal characteristics of groups or
individuals which would have been impossible to
discover by other means

• It can be particularly useful to discover whether
people do what they say they do, or behave in the
way they claim to behave
• Should be clear about what should be observed, how
it should be recorded

• Can be used to study
– Breast feeding or weaning practices
– Types of individuals frequenting STD clinics
– Infant behavior
• No necessity to depend on memory recall as one can
record events as they unfold

Direct Observation
• Broadly the techniques can be divided to
1. Participant observation
2. Non-participant observation

Participant observation
• Observer collects data while participating in the
activities of the group under observation
• Most useful in sociological enquiries about cultural
aspects
• Concerned with putting yourself in place of the client
or user and seeing what happens

Non-participant observation
• Researcher remains detached from the activity under
observation
• Simply watches and records what is going on

Disadvantages
• May require training
• Observer’s presence may create artificial situation
• Potential for bias
• Potential to overlook meaningful aspects
• Potential for misinterpretation
• Difficult to analyze

(d) Case Study Method

• Real life situation in real time immediate impact
and relevance
• Plan and chart techniques
• Schedule data collection and recording
• Notes vs audiotape vs videotape
• Regular review

• Example: Case study of women with morbidities
Yield illuminating and in-depth data on specific
issues/ illnesses
Limited in scope

Making non-science into science?
• Get as many different views on the situation as
possible (triangulate)
• Decide in advance the techniques and the ways
they will be used
• Be careful with recording and cataloguing all data

Combining Qualitative and Quantitative Methods
• Blending of methods captures a more complete,
holistic and contextual portrayal of the subject under
study
• Weakness and limitations of each method are
counterbalanced therefore neutralizes rather than
compounding the problems

• Coding responses to open ended questions and using
statistical methods to analyse ranked data sets
arising from participatory enquiries i.e. creating
frequency tables from the coded data
• Using participatory techniques in exploratory studies
to set up hypotheses which can then be tested
through questionnaire based sample surveys

III. Data Analysis and III. Data Analysis and presentationpresentation

Geographical Information Systems

“A system for capturing, storing, checking,
integrating, manipulating, analysing and
displaying data which are spatially referenced to
the Earth. This is normally considered to involve
a spatially referenced computer database and
appropriate applications software”

GIS concepts are not new!
• London cholera epidemic 1854
Cholera deathCholera death
Water pumpWater pump
SohoSoho
+

• Range from very sophisticated, well developed
systems requiring substantial inputs in terms of data
and expensive equipment, to simple systems run on
microcomputers, using economical, user-friendly
software
• Ability to integrate large amounts of data and to
provide epidemiological insights which cannot be
obtained easily by other means
• Rapid retrieval of information possible
• Presentation of data in a mapped form, providing
structure and organization to the data

• Maps combined with graphical displays allows to
grasp more quickly the dimension and implication of
current health situation or changes forecast via
various predictive methods or analyses
• Softwares: CAP II, Eurostat, EpiMap, MapInfo, ESRI

GIS components
Specific applications /
decision making objectives
??G I SG I S
Spatial
data
Computer Computer hardware / /
software toolssoftware tools

GIS System Architecture and Components
Data Input
Query InputGeographic Database
Output: Display and Reporting
Transformation and Analysis

Examples of Applied GIS• Urban Planning, Management & Policy
– Zoning, subdivision planning– Land acquisition– Economic development– Code enforcement– Housing renovation programs– Emergency response– Crime analysis– Tax assessment
• Environmental Sciences– Monitoring environmental risk– Modeling stormwater runoff– Management of watersheds,
floodplains, wetlands, forests, aquifers
– Environmental Impact Analysis– Hazardous or toxic facility siting– Groundwater modeling and
contamination tracking• Political Science
– Redistricting– Analysis of election results– Predictive modeling
• Civil Engineering/Utility– Locating underground facilities– Designing alignment for freeways, transit– Coordination of infrastructure maintenance
• Business– Demographic Analysis– Market Penetration/ Share Analysis– Site Selection
• Education Administration– Attendance Area Maintenance– Enrollment Projections– School Bus Routing
• Real Estate– Neighborhood land prices– Traffic Impact Analysis– Determination of Highest and Best Use
• Health Care– Epidemiology– Needs Analysis– Service Inventory

0 1 2 3 4 5 6 7 8 90 R T1 R T2 H R3 R4 R R5 R6 R T T H7 R T T8 R9 R
Real World
Vector RepresentationRaster Representation
Concept of Vector and Raster
line
polygon
point

Benefits of GIS
• Better information management
• Higher quality analysis
• Ability to carry out “what if?” scenarios
• Improve project efficiency
• In health system: disease mapping, epidemiology,
facility planning, provider & purchaser planning,
expenditure monitoring and patient analysis

IV. Managing Emergency Public Health problems

Objectives
• Identifying the priority health problems and determining
the extent of disease existing within an affected
community
• Identifying the causes of disease and the risk factors
• Determining the priority health interventions
• Determining the extent of damage and the capacity of the
local infrastructure
• Monitoring health trends and evaluating the impact of
health programs

• Focus on four core issues:
1. What is the most severely affected geographic area
and catchment population?
2. What are unmet needs?
3. What goods and services are appropriate for the
current phase of post-event response?
4. Is the intervention amenable to on-going surveillance
and monitoring?

Acute emergency situations
• Requires very experienced professionals to lead the
operations
• Following surveys or sampling methods can be used
for the rapid assessment:
Water Usage
Nutrition Screening
Aerial Mapping
Determining the population’s size and composition

Post - emergency situations
• To estimate population size during post-emergency
situations, other techniques can be used if the
information from census or registration exercises is
unreliable
Participatory mapping of the catchment area
Household registration

Conducting the rapid health needs assessment
• Preliminary observations
• Interview officials
• Review existing records
• Detailed visual inspection
• Rapid surveys
• Prepare a basis for ongoing health information
• Preliminary analysis
• Report findings
• Dissemination
• Recommendation for follow up surveys

Disaster Epidemiology Methodology
• Examples of rapid needs assessment/ CASPER in disaster setting
– Hurricane Irene in NC, 2011 (to assess hurricane evacuation behavior and residents’ understanding of flood risk)
• Rapid assessments using CASPER methods
• GIS and GPS Technology

Definition of CASPER
• Format:
– Face-to-face survey with people living in affected area
• Target audience:
– Decision-makers
• Benefits
– Quick and low-cost
– Accurate and useful
information

Purpose of a CASPER
Determine type and magnitude of needs to
plan and implement relief efforts

What CASPERs are NOT
• Do not deliver food, medicine, medical services or
other resources to the affected area
• Do not provide direct services to residents such as
cleanup or home repair

CASPERSample Selection
• Select a sample area
– Storm path, damage reports, service areas
• Randomly select 30 population weighted geographic
clusters in sample area
• Randomly select 7 households within each geographic
cluster
• 210 total surveys, 10 survey teams

GIS as a CASPER Tool
• Tools for storing, manipulating, analyzing and
displaying spatial data
• Used to construct maps that communicate spatial
data
– Raster-based: Data and image stored in a
regularized grid made of pixels [Satellite]
– Vector-based: Data and image stored separately
in map layers (points, lines, polygons)

Hurricane IreneCASPER Results
• 205 interviews– 27.8% of respondents
evacuated
– Only 35% of county residents knew an evacuation order had been issued
– Evacuation rates highest among those living in 100 year flood plain

V. ConclusionsV. Conclusions
"It will perhaps always be a struggle to argue,
however valid the case, that it is better to be vaguely
right than precisely wrong“
(Carruthers and Chambers 1981)

• It is increasingly recognised that it is not just necessary to
provide appropriate health services, but it is also essential
to have essential and rational administration of health
care systems
• The development of REA can provide programme
managers the tools necessary for priority setting,
appropriate allocation of resources and evaluation of
impact of the services
• Improved information – improved decision making –
better distribution of scarce health resources – health
gains

• Qualitative methods can complement quantitative
methods by adding depth and insight, but may be
dangerous to use them as stand-alones for policy makers
• Most appropriate method is dependent on the amount of
time available to analysts and program managers
• High standards and scientific objectivity is critical for
assessment process
• The need for rapid results is not an acceptable excuse for
“quick and dirty” work

References
• The Johns Hopkins and IFRC Public Health Guide for
Emergencies. Disaster
Epidemiology.http://www.ifrc.org/docs/pubs/health/chapte
r4.pdf.
• Duppenthaler JL. A brief history of GIS and their
application to the work of WHO 1990;WHO, Geneva.
• Beebee J. Basic concepts and Techniques of Rapid
Appraisal. Human Organization 1995;54(1).
• Anker M. Epidemiological and statistical methods for
rapid health assessment. Wld hlth statist, quart 1991(44).

• Smith GS. Development of rapid epidemiologic
assessment methods to evaluate health status and
delivery of health services. Int J of Epidemiol
1989;18(4).
• The training module mid-level manager “The EPI
coverage survey” 2008. Available at
www/WHO/IVB/08.7

Thank You