Embed Size (px)
Citation preview

REPUBLIC OF NAMIBIA
Ministry of Health and Social Services
Windhoek, June 2015
NAMIBIA 2012/13
HEALTH ACCOUNTS REPORT

Recommended Citation: Ministry of Health and Social Services. June 2015. Namibia 2012/13 Health Accounts Report. Windhoek, Namibia.
Program management and support and funding for the health accounts estimation were provided by the United States Agency for International Development (USAID) through the Health Finance and Governance (HFG) project, implemented by Abt Associates Inc. under cooperative agreement AID-OAA-A-12-00080.

NAMIBIA 2012/13
HEALTH ACCOUNTS REPORT
i
CONTENTS
Acronyms ........................................................................................................................ iii
Foreword ......................................................................................................................... iv
Executive Summary ....................................................................................................... v
1. Introduction ..................................................................................................... 1
1.1 Health Accounts in Namibia ............................................................................... 1 1.2 Objectives ........................................................................................................... 1 1.3 Methodology ....................................................................................................... 2 1.3.1 Data sources ............................................................................................. 2 1.3.2 Accomplishments and limitations ............................................................. 3
2. Health Accounts Key Findings..................................................................... 5
2.1 General health expenditures............................................................................... 7 2.2 HIV expenditures .............................................................................................. 20 2.3 Reproductive health expenditures ................................................................... 23
3 Policy Implications and Recommendations ...........................................24
4 Recommendations for Future Resource Tracking Exercises.............26
Annex A: Key Health Indicators for Namibia and Comparative Countries
with Similar Income Level, 2012...............................................................................27
Annex B: Contributors to the Health Accounts Exercise ..................................28
Annex C: References ...................................................................................................29
List of Tables
Table 1. Key policy questions guiding Health Accounts estimation............................ 2 Table 2. Key Health Accounts findings ........................................................................ 6 Table 3. Trend in absolute and real spending managed by government ................... 16

ii
List of Figures Figure 1. Total health spending: Summary of Health Accounts results ..................... vi Figure 2. Growth in THE, 2001/02-2012/13 (real 2012/13 N$ millions).................... 7 Figure 3. Total government expenditure and total government health expenditure,
2001/02-2012/13 (real 2012/13 N$ millions) ..................................................... 8 Figure 4. THE by source of financing ........................................................................... 9 Figure 5. THE by financing scheme ............................................................................ 10 Figure 6. THE by public vs. private financing source ................................................. 11 Figure 7. Cross-country comparison of private expenditure on health as a percent
of THE ............................................................................................................... 12 Figure 8. THE by facility type ..................................................................................... 12 Figure 9. Government health spending by health system level ................................. 13 Figure 10. THE by type of service.............................................................................. 14 Figure 11. Household OOP spending by type of provider........................................ 15 Figure 12. Spending managed by households by type of service ............................... 15 Figure 13. Total household OOP spending per capita (real 2012/13 N$) (OOP
spending as a % of THE).................................................................................... 16 Figure 14. Spending managed by the government by type of service ....................... 17 Figure 15. Spending managed by PSEMAS by type of service.................................... 17 Figure 16. THE by disease / health condition ............................................................ 18 Figure 17. Disease burden in Namibia, both sexes, 2013 ........................................ 19 Figure 18. Top 25 causes of YLLs 1990-2010, Namibia ............................................ 20 Figure 19. HIV spending by source of financing......................................................... 21 Figure 20. HIV spending by type of service ............................................................... 22 Figure 21. RH spending by source of financing.......................................................... 23 Figure 22. RH spending by type of service ................................................................ 23

iii
ACRONYMS
DHS Demographic and Health Survey
GDP Gross Domestic Product
HFG Health Finance and Governance
MOHSS Ministry of Health and Social Services
NAMFISA Namibia Financial Institutions Supervisory Authority
NASA National AIDS Spending Assessment
NCD Non-communicable Disease
NGO Non-governmental Organization
NHA National Health Accounts
NHIES National Household Income and Expenditure Survey
OECD Organization for Economic Cooperation and Development
OOP Out-of-pocket
PSEMAS Public Service Employees Medical Aid Scheme
RH Reproductive Health
SHA System of Health Accounts
STG Standard Treatment Guidelines
THE Total Health Expenditure
USAID United States Agency for International Development
WHO World Health Organization
YLL Years of Life Lost

iv
FOREWORD
This report presents findings from Namibia’s Health Resource Tracking exercise for the 2012/13 financial year. The report is the product of a continuous effort by the Ministry of Health and Social Services to institutionalize resource tracking in the health sector. The study was conducted to provide a comprehensive assessment of health spending and the use of both private and public financial resources in the health sector in Namibia. The study was conducted by a multidisciplinary team. Technical assistance for the Health Accounts estimation was provided through the ministry’s directorates of Policy, Planning and Human Resource Development, of Special Programs, Tertiary Health Care and Clinical Support Services, and of Finance and Logistics, as well as the USAID-funded Health Finance and Governance (HFG) project, led by Abt Associates, and the World Health Organization. We are grateful to the United States government for the financial and technical support of the United States Agency for International Development (USAID). I thank all those who contributed to this Health Accounts estimation for Namibia: participants of the launch and dissemination events, who provided key input and feedback; institutions that provided essential information for the estimation through survey responses; the team of data collectors, who collected data from employers, medical aid schemes, donors, and non-governmental organizations; and the technical team that analyzed the data. The data collected and analyzed were from nongovernmental organizations, donor organizations, medical aid funds, government ministries, private employers, and households. I would like to take this opportunity to express my sincere appreciation to all institutions for their contribution and support throughout this resource tracking exercise. My sincere appreciation goes to Mr. Tesfaye Ashagari, Ms. Heather Cogswell, and Ms. Claire Jones of the USAID Health Finance and Governance project for their technical assistance in making this project a success. Furthermore, my gratitude goes to Namibia’s Health Accounts team: Mr. T. Mbeeli, Ms. H. Nangombe, Mr. LC Usurua, Mr. M. Simasiku, Mr. L. Indongo, Ms. T. Block, and Mr. A. Uakurama (MOHSS); Mr. E. Coetzee (Ministry of Finance); Ms. E. Ilonga (National Planning Commission); Dr. Tomas Zapata (WHO); Mr. Cons Karamata (Social Security Commission); Mr. J. Hidinwa (Polytechnic of Namibia); Mr. K. Mbapaha (Namibia Medical Aid Fund); Mr. L. Kamwi (Namibia Chamber of Commerce and Industry) for their efforts in finalizing this project.
By providing sound estimates of spending on health, this Health Accounts estimation is a vital component of health systems strengthening in Namibia as it provides stakeholders with information on the value of health care goods and services purchased and patterns in financing, provision and consumption of health care resources. Data from the Health Accounts will support the Ministry of Health and Social Services and other National policymakers, donors, and stakeholders to guide their strategic planning and dialogue to inform decision making for health and social service delivery.

v
EXECUTIVE SUMMARY
This report presents the findings and policy implications of Namibia’s Health Accounts estimation for the fiscal year April 2012 through March 2013 (2012/13). Earlier, Namibia completed three rounds of National Health Accounts covering the 11 years of spending between 1998/99 and 2008/09. The 2012/13 Health Accounts estimation in Namibia is the first round conducted using the SHA 2011 methodology. Health Accounts capture spending from all sources: the government, non-governmental organizations, external donors, private employers, private medical aid schemes, and households. The analysis breaks down spending into the standard classifications defined by the System of Health Accounts 2011 framework, namely sources of financing, financing schemes, type of provider, type of activity, and disease/ health condition.
Findings
Total health expenditure (THE) in Namibia in 2012/13 was N$9,200,965,309, representing 9 percent of gross domestic product (GDP). Ninety-six percent of THE was recurring spending, i.e., spending on health goods and services that were consumed within the year of the Health Accounts analysis. The remaining 4 percent of spending was for capital investment, representing spending on goods and services whose benefits are consumed over more than one year. The government was the largest source of health financing (54 percent), followed by the private sector (38 percent) and donors (8 percent). The private sector’s 38 percent comprises: households, which contributed 16 percent of THE; private sector employers, which provided 11 percent; and other institutions, which contributed another 11 percent.
Fifty-six percent of health funds were spent on secondary care provided by public and private hospitals. Almost a quarter of spending was at the primary care level, primarily at clinics and health centers. At the activity level, approximately two-thirds (69 percent) of THE was for curative care. General administration and management consumed 12 percent, and the purchase of medicine and medical goods from pharmacies accounted for 7 percent. Spending on prevention services represented 6 percent of THE. Of the spending data that could be allocated to a disease or health condition, the Health Accounts exercise found that reproductive health (including maternal health, family planning, and other services) represents 38 percent of total health spending. Infectious and parasitic diseases followed at 33 percent; HIV/AIDS and respiratory infections account for the largest proportions of this spending category, 13 and 10 percent of THE, respectively. Figure 1 illustrates this breakout of THE.
As noted, spending on HIV represents 13 percent of total health spending. Essentially all of this (99 percent) was on recurring expenditure; 1 percent was on capital expenditure. Donors provided the majority of HIV funds (51 percent) whereas 37 percent came from government. With the Health Accounts estimation showing that only 2 percent of HIV spending comes from households, it seems that people living with HIV are well protected from financial risk when seeking care. The health activities that consume the largest amounts of HIV financing were curative care (46 percent), administration (28 percent), and prevention (16 percent). Spending on health care-related items was minimal, less than 1 percent of total health spending.

vi
A comparison of Namibia’s health spending indicators with those of neighboring countries that have also conducted Health Accounts and neighboring countries with similar levels of income (World Bank-classified upper-middle-income sub-Saharan African countries) is provided in Annex A. Relative to its peers, Namibia has high spending on health – its THE per capita at N$4,294 (USD 500) is the third highest of the eight countries analyzed, behind only South Africa and Seychelles. Namibia’s THE as a percentage of gross domestic product also is one of the highest in the group, comparable to that of South Africa and higher than that of the other six countries (Algeria, Angola, Botswana, Gabon, Mauritius, and Seychelles). The government of Namibia’s health spending as a percentage of its total spending, at 13 percent, is higher than all of the neighboring countries and just shy of the Abuja Declaration target of 15 percent. In terms of out-of-pocket (OOP) spending, Namibia falls in the middle of the group, with OOP spending 11 percent of THE.
Implications and recommendations
The results of the Health Accounts 2012/13 exercise highlight the strong commitment of the government to financing the general health care of the population and the national HIV response. The commitment is commendable and should be maintained as it will be a key strength in Namibia’s efforts toward achieving universal health coverage. Recommendations that arose from these results:
Figure 1. Total health spending: Summary of Health Accounts results
Govt, 54%
Employers, 11%
Households, 16%
NGOs, <1%
Donors, 8%
Other, 11%
Govt schemes, 54%
Medical aid schemes, 30%
Household OOP, 11%
NGO schemes, <1% Capital, 4%
Primary, 22%
Secondary and tertiary, 56%
Central govt, 12%
Rest of economy, 2% Overseas, <1%
Other, 9%
Inpatient curative, 39%
Outpatient curative, 30%
Ancillary services, 1%
Pharmaceuticals, 7%
Prevention, 6%
General mgt, 11%
Other, 1% Capital, 4%
Reproductive health, 38%
Nutritional deficiencies, <1%
NCDs, 5%
Injuries, 5%
HIV/AIDS, 13%
TB, 1% Malaria, 1%
Respiratory infections, 10%
Diarrheal diseases, 4%
Vaccine preventable diseases, 1%
Other, 21%
0%
10%
20%
30%
40%
50%
60%
70%
80%
90%
100%
Source Scheme Level of Care Activity Disease

vii
Identify alternative sources of health financing. As Namibia transitions from donor funding to increasingly domestic financing for health, the country needs to investigate alternative sources of financing to ensure efficient allocation of resources, which will contribute to the sustainability of the domestic financing.
Increase government health expenditure to achieve the Abuja target. Government expenditure on health as a percentage of government total expenditure declined from 14.7 percent in 2008/09 to 13 percent in 2012/13. Increasing the government health budget could be critical to compensating for the significant decline in donor funding over the last four years.
Increase HIV/AIDS expenditure to respond to the high HIV burden of disease. HIV remains a top contributor to morbidity in Namibia, however, with 51 percent of HIV funding coming from donors, it remains heavily donor-financed. The government should mobilize domestic resources to fill the HIV funding gap by allocating more resources to HIV and by integrating HIV services into other health services to increase efficiency.
Contain increases in household OOP expenditure. OOP expenditure has increased from 6.3
percent of THE in 2008/09 to 11 percent in 2012/13. High levels of OOP payments are inequitable and consistently prove to be an inefficient means of financing health care.
Reallocate funds on primary care in order to improve quality, accessibility, and efficiency. Health Accounts found spending in Namibia skewed toward secondary and tertiary curative care. This calls for a closer investigation of cost efficiency and resource allocation decisions. Greater spending on primary care and prevention cannot only help to improve the quality of life of the population but also to reduce the costs of care.
Shift attention and funding to non-communicable diseases (NCDs). Namibia is facing an epidemiological transition from communicable diseases to NCDs. Despite this, health expenditure on NCDs is small, only 5 percent of THE. If not addressed, the growing burden of NCDs will have an economic cost as Namibians who suffer from these diseases are less able to work the length of a normal working lifespan and are less productive even when they do work.
Improve equity in financing and in access to health services. Given that 44 percent of THE goes to paying for health care for only 19 percent of the population that is covered by some form of medical aid, this leaves only 56 percent of THE to cover the remaining 81percent of the population indicating a strong likelihood for inequity in financing. This should be investigated further as it is important for the Ministry of Health and Social Services to understand whether its health spending is sufficient and equitable across the population. The government needs to understand where and by how much its spending is not helping to provide care for those who need it most.
Identify ways to improve efficiency within the public and private health sector. Health Accounts data has shown a significant increase in resources to the health sector over the past 13 years. With this increase, efficiency becomes one of the key questions, especially in relation to the provision of high priority health services. When Health Accounts data is paired with additional health system data and indicators, it can provide insight into how efficiently those resources were spent. An analysis should be performed in the public and private sectors in order to identify bottle necks in service delivery, reduce unnecessary cost, and improve efficiencies.

1
1. INTRODUCTION
1.1 Health Accounts in Namibia
This report presents the findings of Namibia’s Health Accounts exercise for 2012 /13. The current exercise is Namibia’s fourth round of Health Accounts and is the first round conducted using the SHA 2011 methodology; the prior three rounds covered 11 years of spending between 1998/99 and 2008/09.1 These prior rounds have been critical to informing the design and review of the country’s Health Sector Strategic Plan. Health Accounts estimates of spending in priority areas such as reproductive health have informed resource allocation discussions. Further, combined with information from other sources regarding the geographic distribution of health resources, Health Accounts estimates have helped the Ministry of Health and Social Services (MOHSS) develop a resource allocation formula that is currently under review for implementation. In addition to the Health Accounts estimations, the MOHSS has completed three rounds of National AIDS Spending Assessments (NASA), the latest report of which was published in 2014 (MOHSS et al. 2014). Taken together, the NASA and Health Accounts data provide the government and other stakeholders with key information on the resource flows for the health sector as well as for the overall HIV/AIDS response.
Despite the wealth of information generated to date, five years have passed since the last Health Accounts exercise was completed. The MOHSS would like to fill that gap as it moves toward institutionalization (regular production and use) of Health Accounts. The United States Agency for International Development’s (USAID’s) Health Finance and Governance (HFG) project provided technical support jointly with the World Health Organization (WHO) to the government of Namibia to complete this estimation.
Namibia faces a serious HIV/AIDS epidemic with adult prevalence estimated at 13 percent (MOHSS 2010). In addition, Namibia is highly dependent on external donor funding for priority programs like HIV/AIDS, TB, and malaria. The country is facing shrinking funding for health care as it transitions into upper-middle-income status and donor support declines (WHO 2015a). This shrinking funding environment calls for equitable allocation of available resources and efficient utilization of those resources.
Namibia’s financing of its health goods and services is under increasing pressure. As more than half of the population is living below the poverty line (WHO 2010), its predominantly tax-based system for public financing of health is increasingly vulnerable to changes in economic growth (WHO 2015a). At the same time, demand and costs for health services are increasing, caused by an ageing population, increasing incidence of non-communicable diseases (NCDs), and the threat of communicable diseases.
By providing sound estimates of past spending, the Health Accounts findings can be used to determine if sufficient resources are being spent on health care, if they are appropriately allocated, and if not, how they could be reallocated to achieve more value-for-money.
1.2 Objectives
Namibia’s Health Accounts exercise to estimate health spending in 2012/13 was conducted between July 2014 and April 2015. The immediate objective was to track the magnitude and flow of spending from all sources of health financing – government, households, non-governmental organizations (NGOs), employers, medical aid schemes, and external donors – to all its uses. During the planning stages of the Health Accounts, the MOHSS and its Health Accounts Steering Committee identified 1 The first in 2003 for financial years 1998/99 to 2000/01 (MOHSS 2003), the second in 2008 for 2001/02 to 2006/07 (MOHSS and Health Systems 20/20 2008), and the third for 2007/08 and 2008/09 (Government of Namibia et al. 2010).

2
specific policy questions that the Health Accounts should answer (Table 1); findings will contribute to the evidence base on health spending and inform policy decisions about health financing reform.
Table 1. Key policy questions guiding Health Accounts estimation
Policy area Policy question
Sustainability of health financing How sustainable are the overall resources flowing to the health sector, given the potential decline of donor support as the country transitions into upper-middle-income status?
Sustainability of health financing; spending by disease area
How is declining donor support reflected in funding of priority areas such as HIV, TB, malaria, non-communicable diseases, and maternal and child health?
Risk pooling What share of spending on health comes from out-of-pocket spending?
Relative spending of private sector What is the role of the private sector in provision of health? How big is its share of total spending on health?
1.3 Methodology
Health Accounts is an internationally standardized tool to summarize, describe, and analyze the
financing of health systems. To date, Health Accounts estimations have been conducted in over 130 countries and have contributed significantly to the discussion on how to improve health financing. They summarize in table form different aspects of countries’ health expenditure. Health Accounts capture spending by the public sector, the private sector including households, NGOs, and donors.
Health Accounts are based on the System of Health Accounts (SHA) framework, which was developed and revised by key international stakeholders over the past two decades. The latest version of SHA, known as “SHA 2011” was developed by the Organization for Economic Cooperation and Development (OECD), EUROSTAT, and WHO. The 2012/13 Health Accounts estimation in Namibia is the first round conducted using the SHA 2011 methodology and represents the fourth round of Health Accounts in Namibia.
For additional details on the SHA 2011, please refer to the 2011 Edition of the System of Health Accounts (OECD et al. 2011) and two recently developed technical briefs on the SHA 2011 (Nakhimovsky et al. 2014; Cogswell et al. 2013). For more detailed information on the methodology used in Namibia, please see the Statistical Report (MOHSS 2015).
1.3.1 Data sources
To gather primary data, the Health Accounts technical team led by the MOHSS surveyed a wide range of sources:

3
Donors (both bilateral and multilateral donors), to get an understanding of their level of external funding for health programs in Namibia;
NGOs involved in health, to understand flows of health resources through NGOs that manage health programs;
Private employers, to understand the extent to which employers provide medical insurance through the workplace and, where applicable, which employers manage their own health facilities or provide workplace prevention programs; and
Private medical aid schemes, to understand total expenditures on health by medical aid
schemes through health, or any other type of insurance or risk-pooling mechanism.
Secondary data were collected from the following sources:
Government spending data for the MOHSS, Ministry of Finance, Ministry of Defense, and Ministry of Education from the Republic of Namibia Estimates of Revenues and Expenditures 2012-13 (Republic of Namibia, n.d.)
Household expenditure data from the 2013 Namibia Demographic and Health Survey (DHS)(MOHSS et al. 2014)
Utilization data from the National Health Information System, electronic Patient Management System, and the Electronic Dispensing Tool as well as the MOHSS annual report 2012/13
Cost data from WHO Choice to triangulate the distribution keys
Medical aid expenditure data extracted from the annual report for 2012 of the Namibia Financial Institutions Supervisory Authority (NAMFISA)
Health Facility Census data from 2009 to develop a distribution key for the expenditure of the MOHSS
National Population Census, 2011
1.3.2 Accomplishments and limitations
The Health Accounts estimation is a significant accomplishment for the MOHSS. The MOHSS Health Accounts technical team is knowledgeable about the SHA 2011 framework, the Health Accounts methodology, and the Health Accounts Production Tool software (software developed by WHO and used by many countries worldwide to facilitate the planning and production of Health Accounts). Through this Health Accounts estimation, the MOHSS has strengthened its engagement with the Health Accounts Steering Committee, composed of representatives of the MOHSS, Ministry of Finance, National Planning Commission, Social Security Commission, Namibia Association of Medical Aid Funds, and the Namibia Chamber of Commerce and Industry. The Steering Committee also is well versed in Health Accounts estimation process and will be a useful source of strategic direction and feedback for future Health Accounts estimations.
Several challenges were encountered during the estimation process and they should be taken into consideration during future resource tracking exercises.
The response rate on questionnaires sent to employers was lower than expected, which could have led to some underestimation of the expenditures incurred by the employers. However, the exercise captured employer contributions to medical aid schemes from what is believed to be reliable and complete information obtained directly from the schemes and from the NAMFISA annual report. (In fact, the exercise identified a trend for employers to contribute to medical aid schemes on behalf of their employees rather than provide elaborate in-house health services, workplace programs, or alternative benefits.) As such, the underestimation of employer expenditures on health is expected to be minimal. To prevent double-counting, the expenditure information on medical aid
4
contributions from the employer questionnaires was excluded from the total health expenditure (THE) amounts and analyses.
The breakdown of government health expenditures by function and disease was not available from the ministries. Therefore, the Health Accounts team estimated this spending information using “distribution keys.”2 These distribution keys were calculated using the SHA 2011 recommendations and were triangulated using other sources such as the utilization data obtained from various MOHSS databases and reports as well as from the WHO Choice cost information. The distribution key by health care function for the MOHSS expenditure data at regional government level was calculated using the expenditure breakdown from Karas region.
Household spending data were obtained from the DHS of 2013, which contained a module that asked respondents about their health expenditures. During the previous Health Accounts exercises, the household expenditure data were based on the National Household Income and Expenditure Survey (NHIES), which asked respondents to disaggregate their income among various expenditure categories including health. International experience has shown that the responses from these two approaches tend to differ, and this might affect the comparability of the results between years.
Because the structure of the DHS questionnaire did not specifically exclude expenditure that was reimbursed to the households by medical aid schemes, there was a risk of double-counting. To eliminate the risk, additional information was requested from selected medical aid funds on the proportion of reimbursements paid directly to providers versus those paid to scheme members. These percentages were extrapolated to all medical aid expenditure information , and the total estimated amount of reimbursements made to scheme members was excluded from the estimated household expenditure amount.
In some cases, health spending as reported in secondary sources or in surveys required additional breakdowns in order to allocate spending based on all disease classifications of the SHA framework. Given the difference in methodologies in allocating non-targeted expenditures by disease and priority areas, the team was not able to compare the results of the Health Accounts on HIV spending to the results of the 2008/09 Health Accounts – the 2008/09 Health Accounts used a distribution key for HIV spending based on commodity prices, whereas the current distribution key is based on utilization (e.g., the proportional share of each disease category at health facilities) and unit costs incurred for treatment. The current exercise offers a more refined estimation of HIV spending. Because these methodologies differ, caution should be taken when comparing HIV spending across years of data.
Comparing HIV/AIDS spending estimates in the 2012/13 Health Accounts and 2013 NASA report revealed two areas for clarification: First, there is a gap of approximately US$14 million in PEPFAR-reported HIV/AIDS spending between the two reports. In the NASA report, PEPFAR reported spending US$71 million in Namibia, whereas the Health Accounts reported US$57 million. The discrepancy is explained by the fact that the NASA reports “budget allocated” and Health Accounts reports “expenditure.” Second, there is a difference in the government expenditure on HIV reported by the 2013 NASA in comparison with the current Health Accounts data. The Health Accounts allocates non-targeted expenditures to HIV/AIDS and other diseases based on utilization and unit costs incurred for treatment. Caution should be taken when comparing HIV spending across the Health Accounts and NASA as the figures have been calculated using different methodologies.
2 In some cases, health spending as reported in secondary sources or in surveys required additional breakdowns in order to allocate spending based on all classifications of the SHA framework. Part of the Health Accounts therefore involved
estimating “distribution keys” based on unit cost and service utilization data to break down spending for the provider,
functional, and disease classifications.

5
2. HEALTH ACCOUNTS KEY FINDINGS
THE in Namibia in 2012/13 was N$9,200,965,309 (USD1,072,373,579), of which 96 percent is recurring spending – spending on health goods and services consumed within the year of the Health Accounts analysis. The remaining 4 percent of spending was for capital investment – goods and services whose benefits are consumed over more than one year. Health care-related items, such as social care for HIV positive people, totaled an additional N$401,789,334. A summary of Namibia’s key health spending indicators relative to those of neighboring countries, to those of countries of similar income that have conducted Health Accounts, and to those of countries with a similar level of GDP per capita is provided in Annex A.

6
Table 2. Key Health Accounts findings
Indicator 2008/09 2012/13
Total population 2,051,896 2,142,660
Exchange rate (N$/US$1) N$8.20011 N$8.58369
GDP (in 2012/13 real N$) N$93,781,052,720 N$107,323,000,000
GDP per capita (in 2012/13 real N$) N$45,704 N$50,089
THE (in 2012/13 real N$) N$6,361,267,006 N$9,200,965,309
Total current health expenditure * N$8,826,952,539
Total capital health expenditure * N$374,012,770
THE per capita (in 2012/13 real N$) N$3,100 N$4,294
THE/GDP 7% 9%
Total government health expenditure (in 2012/13
real N$)
N$3,421,310,270 N$4,970,002,000
Current government health expenditure * N$4,610,706,580
Capital government health expenditure * N$359,295,420
Government health spending as a percentage of
total general government expenditure
14% 13%
Who funds health? Key Financing Sources (% THE)
Public 54% 54%
Private 24% 38%
Donors 22% 8%
How much do households spend? Household Spending (% THE)
Total household spending (prepayments to
medical aid and direct payments to providers) as
a % of THE
12% 16%
Household OOP spending (direct payments to
providers only) as a % of total health spending
6% 11%
Who manages health resources? Key Financing Agents (% THE)
General government 54% 44%
Medical aid schemes 28% 37%
Corporations (other than insurance corporations) <1% 1%
NGOs 9% 6%
Households 8% 11%
Donors <1% <1%
Where are health funds spent? Key Health Care Providers (% THE)
Public hospitals 37% 41%
Private hospitals 22% 14%
Private clinics and doctor’s offices 9% 13%
Health centers** <1% 7%
Pharmacies 10% 7%
Providers of preventive programs 14% 3%
Other 11% 14%
What types of health care are consumed? Key Health Functions (% THE)
Inpatient curative care 16% 39%
Outpatient curative care 37% 30%
Medical goods 11% 7%
Preventive care 14% 6%
Governance, health system and financing
administration
11% 12%
Capital formation 2% 4%
Other 10% 2% Sources: All 2008/09 figures are from Government of Namibia et al. 2010, unless otherwise noted. The 2012/13 population fig ure is from the 2011 National
Population Census of Namibia http://www.gov.na/population. Exchange rates and GDP comes from the Namibia Statistical Agency: Country Profile.
Notes: Where applicable, values are in real 2012/13 Namibian dollars. *The previous framework didn’t allow expenditure tracking within the “current” and “capital” expenditure boundaries as set forth in SHA 2011. **This includes government-owned health centers and clinics.

7
2.1 General health expenditures
The results presented in this section represent THE: they include both current and capital spending but exclude health care-related spending. Figures 2 and 3 illustrate trends across several health resource tracking indicators in Namibia.
Figure 2 shows that in real 2012/13 Namibian dollars, THE grew from N$2.8 billion in 2001/02 to N$9.2 billion in 2012/13, an average increase of more than 12 percent per year. Similarly, per capita expenditures on health increased steadily from N$1,712 in 2001/02 to N$4,294 in 2012/13.
A steady increase in the dollar amount of THE occurs, despite variation in THE as a percentage of GDP, over the years in which Health Accounts estimations have been done. THE as a percentage of GDP increased steadily from 2001/02 to 2005/06, dropped back to 7 percent in 2007/08 and 2008/09, and then increased again to its current (2012/13) peak of 9 percent. GDP growth in absolute terms in some years may have compensated for the lower percentage of THE out of GDP.
Figure 2. Growth in THE, 2001/02-2012/13 (real 2012/13 N$ millions)
Source: Health Accounts data 2001/02-2012/13
Figure 3 shows that in absolute Namibian dollars, the amount of government health expenditure has increased steadily from year to year, representing the government’s commitment to health. Between 2001 and 2013, government health expenditure as a percentage of total government expenditure varied between 11.7 percent and 14.7 percent, the latter percentage occurring in 2007/08. As of 2012/13, government health expenditure as a percentage of total government expenditure was 13 percent. This means that the government is allocating nearly 15 percent of its budget to the health sector, as per the Abuja Declaration targets. Increases in GDP growth in some years might account for the lower percentage of government health expenditure out of total government expenditure.
2,809 3,297
3,718 4,223
5,148
5,894 6,050 6,361
9,200
0
1,000
2,000
3,000
4,000
5,000
6,000
7,000
8,000
9,000
10,000
2001/02 2002/03 2003/04 2004/05 2005/06 2006/07 2007/08 2008/09 2012/13
THE
in r
eal
20
12
/13
N$
(mill
ion
s)

8
Figure 3. Total government expenditure and total government health expenditure, 2001/02-2012/13 (real
2012/13 N$ millions)
Source: Health Accounts data 2001/02-2012/13
16,933 18,525
20,985
21,649 21,754
25,620
24,478
26,692
37,761
1,983 2,358 2,588 2,685 2,768 2,893 3,604 3,820 4,970
-
5,000
10,000
15,000
20,000
25,000
30,000
35,000
40,000
2001/02 2002/03 2003/04 2004/05 2005/06 2006/07 2007/08 2008/09 2012/13
Re
al 2
01
2/1
3 N
$ (M
illio
ns)
Total GovtExpenditure
Total GovtHealth
Expenditure

9
2.1.1 Health financing sustainability: Who funds health spending and how
much do they contribute?
Financing sources include all entities and institutions that contribute funds to the health system. The government of Namibia, via its tax-based system for health financing, is the biggest contributor to health spending in the country: it represents over half of total health spending (54 percent). This level of spending by government is consistent with other countries with similar GDP per capita, such as Angola, Botswana, and South Africa (see Annex A). Thirteen percent of the government’s total spending is on health. This reflects the government’s strong commitment to investing in improving the health of the population – even though the percentage is down slightly from previous years and below the Abuja target of 15 percent, it is higher than in other countries in the region (Annex A). It bodes well for the country’s efforts to progress toward universal health coverage, which requires strong government involvement.
Employers contribute 11 percent of health spending, primarily via contributions to medical aid schemes paid on behalf of their employees. Very few employers provide workplace programs for health prevention and promotion.
NGOs and donors together represent 8 percent of health spending, which is a significant decrease from previous years (22 percent in 2008/09) and in line with the transitioning of donor funding from Namibia as a result of its achieving upper-middle-income country status.
Figure 4. THE by source of financing
Government 54%
Employers 11%
Households 16%
NGOs <1%
Donors 8%
Other institutions
11%

10
2.1.2 Risk pooling: To what extent are funds for health pooled to
minimize risk?
Risk pooling in health spending is one indication of the level of equity in paying for health care. The smaller the risk pool, the greater the extent to which individuals will be financially burdened when they require health care. Pooling risk across a large group of individuals is important to ensuring that risks are spread evenly so those who cannot afford health care and are most sick are supported by those who are wealthier and less sick.
Financing “schemes” describe the type of financing arrangement through which people receive health care. The public health sector, called the “government scheme”, accounts for 40 percent of THE and
pools resources (and therefore spreads the risk) across the entire population. An additional 14 percent of government spending is allocated to the Public Service Employees Medical Aid Scheme (PSEMAS), which covers public service employees. Another 30 percent of health spending is pooled via private medical aid schemes. Voluntary, regular pre-payments to these schemes pool resources across policy holders in order to reduce the financial risk for households that might otherwise incur large outlays at the time of receiving care.
Namibia, the country with the second highest GINI coefficient in the world (World Bank 2015), has large income inequality across its population and this inequality is reflected in the health system. Currently, there is no cross-subsidization between the rich and the poor in either private medical aid schemes or public medical aid schemes through PSEMAS. Contributions to medical aid funds are based on the risk of getting sick but not on the ability to pay – PSEMAS contributions are a flat rate regardless of the earnings of the employee – and this imposes a greater financial burden on the poor than on the rich. Furthermore, the government is highly subsidizing civil servants, who tend to be wealthier than the overall population, by funding 85 percent of the premium, which represents N$1.3 billion.
Approximately 400,000 people, or 19 percent of Namibia’s population, are covered by some form of health insurance, either through PSEMAS or a private medical aid scheme. These funds together spend N$4.0 billion on health, 44 percent of THE – that is, 44 percent of THE goes to paying for health care for only 19 percent of the population; the remaining 56 percent of THE is spread among the other 81 percent of the population who are informal workers, the unemployed, and other vulnerable populations.
Figure 5. THE by financing scheme
Govt schemes 40%
PSEMAS 14%
Private medical aid
schemes
30%
Household OOP 11%
NGO schemes 1%
Capital formation
4%
11
While households contribute 16 percent of THE into the health system, approximately 5 percent of that contribution goes toward medical aid schemes, whereas the remaining 11 percent of health spending is incurred by households paying out of pocket (OOP) for the full cost of health goods and services, at the time of seeking care. This percentage falls within the WHO guideline of less than 20 percent of health spending incurred as OOP household spending (Xu et al. 2010). It puts Namibia in the middle of the group with countries with similar income levels; Botswana, South Africa, and Seychelles have lower OOP spending (on average 5 percent of THE) (Annex A). This indicates that there is room for Namibia to continue to increase risk pooling and to lower OOP spending by households.
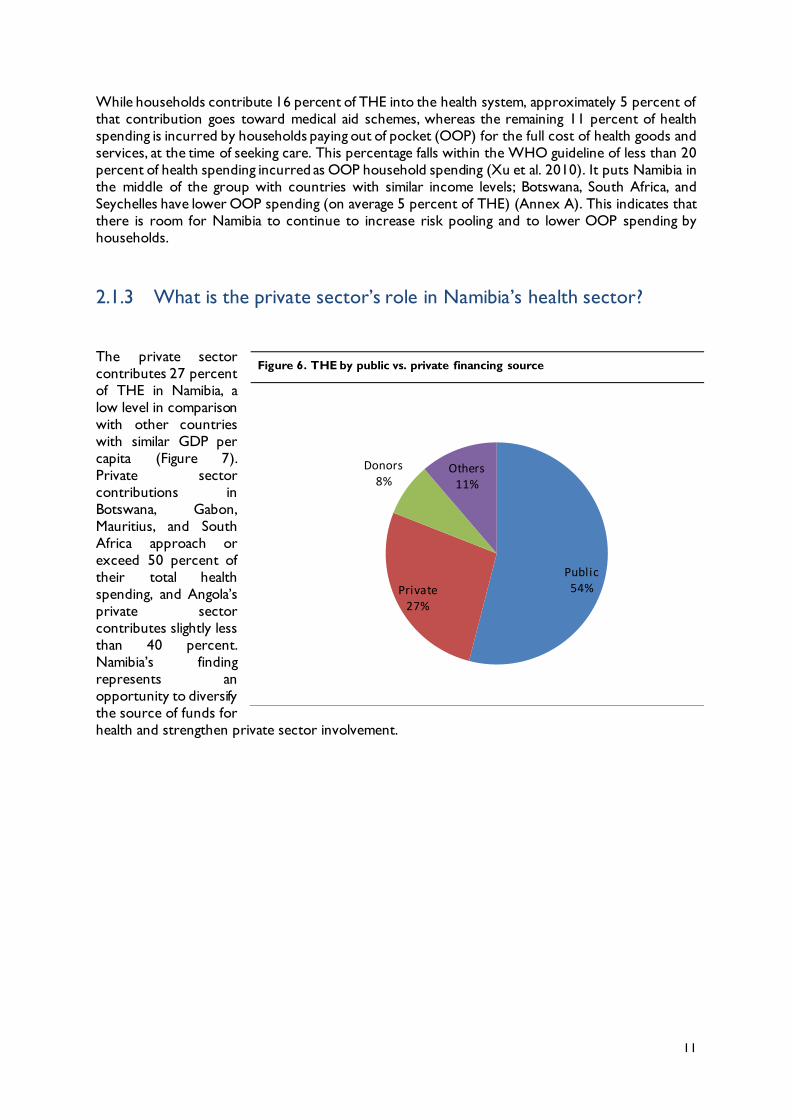
2.1.3 What is the private sector’s role in Namibia’s health sector?
The private sector contributes 27 percent of THE in Namibia, a low level in comparison with other countries with similar GDP per capita (Figure 7). Private sector contributions in Botswana, Gabon, Mauritius, and South Africa approach or exceed 50 percent of their total health spending, and Angola’s private sector contributes slightly less than 40 percent. Namibia’s finding represents an opportunity to diversify the source of funds for health and strengthen private sector involvement.
Figure 6. THE by public vs. private financing source
Public 54% Private
27%
Donors 8%
Others 11%

12
Figure 7. Cross-country comparison of private expenditure on health as a percent of THE
Spending at private sector facilities accounts for 35 percent of THE in Namibia. Fourteen percent of this spending occurs at private hospitals, followed by 13 percent at private clinics, 7 percent at private pharmacies, and one percent at providers of ancillary services (including patient transportation and medical and diagnostic laboratory tests).
Figure 8. THE by facility type
Public hospitals 42%
Public Health centers
6% Admin 12%
Other 5%
Private hospitals 14%
Private clinics 13%
Private providers of ancillary services
1% Private Pharmacies 7%
Private 35%
7
16
27
38
44
49 51 52
0
10
20
30
40
50
60
Seychelles Algeria Namibia Angola Botswana Gabon Mauritius SouthAfrica
Pri
va
te e
xp
en
dit
ure
on
he
alt
h a
s %
of
TH
E

13
2.1.4 At what level of the health system is government spending its resources?
Secondary and tertiary care consumes close to three-quarters (71 percent) of government health spending. Secondary and tertiary care includes all hospital spending, at public, private, and specialized hospitals. Primary care, predominantly at health centers and private clinics but also at NGO facilities, consumes 11 percent of government health spending. “Central government” spending, which includes health system administration, represents 14 percent of government health spending. “Other” spending accounts for 4 percent, and goes to things such as the purchase of medical goods at private pharmacies and ancillary services (e.g., laboratory and imaging tests) at private facilities.
Figure 9. Government health spending by health system
level
Primary 11%
Secondary and Tertiary
71%
Central govt 14%
Other 4%
14
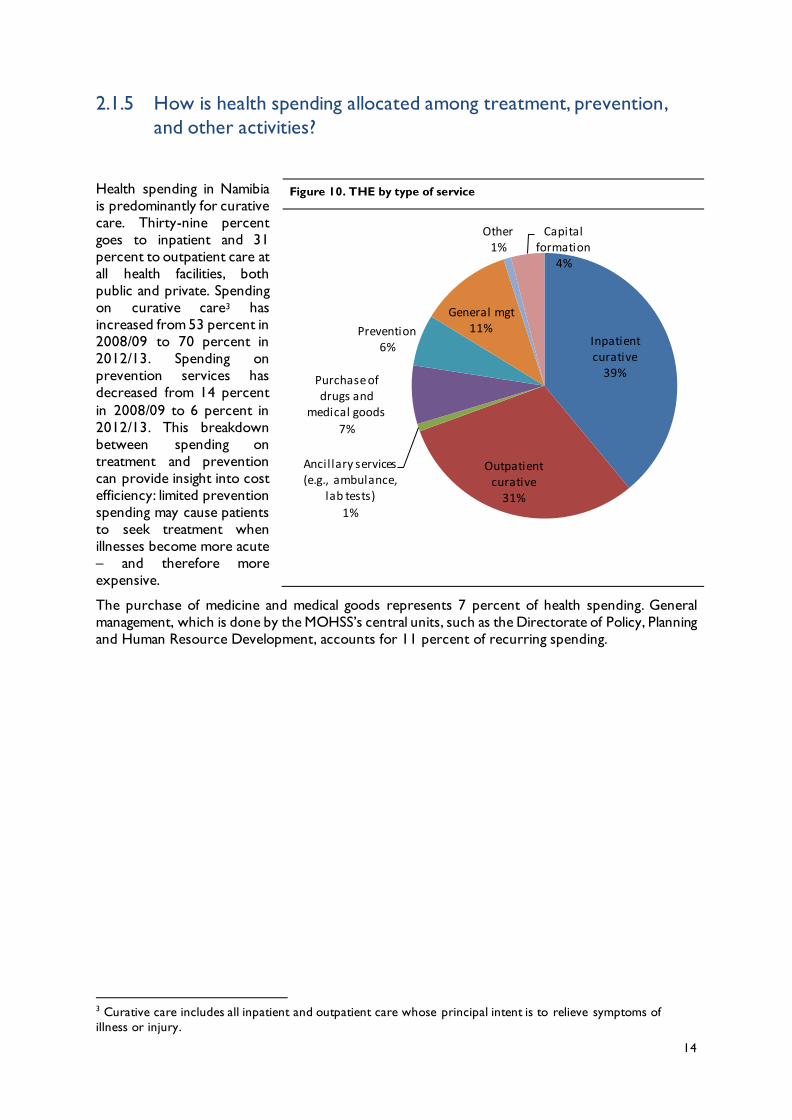
2.1.5 How is health spending allocated among treatment, prevention,
and other activities?
Health spending in Namibia is predominantly for curative care. Thirty-nine percent goes to inpatient and 31 percent to outpatient care at all health facilities, both public and private. Spending on curative care3 has increased from 53 percent in 2008/09 to 70 percent in 2012/13. Spending on prevention services has decreased from 14 percent
in 2008/09 to 6 percent in 2012/13. This breakdown between spending on treatment and prevention can provide insight into cost efficiency: limited prevention spending may cause patients to seek treatment when illnesses become more acute – and therefore more expensive.
The purchase of medicine and medical goods represents 7 percent of health spending. General management, which is done by the MOHSS’s central units, such as the Directorate of Policy, Planning and Human Resource Development, accounts for 11 percent of recurring spending.
3 Curative care includes all inpatient and outpatient care whose principal intent is to relieve symptoms of
illness or injury.
Figure 10. THE by type of service
Inpatient curative
39%
Outpatient curative
31%
Ancillary services (e.g., ambulance,
lab tests)
1%
Purchase of drugs and
medical goods
7%
Prevention 6%
General mgt 11%
Other 1%
Capital formation
4%

15
2.1.6 Where are households spending out of pocket?
Health Accounts data permit a breakdown of OOP spending by type of health care provider. The majority of household OOP spending (43 percent) is at private hospitals, whereas 13 percent is at public hospitals. Twenty-four percent of household OOP spending occurs at private clinics. Only 3 percent of spending occurs at public health centers. Thirteen percent is on medicine and pharmaceuticals.
Household spending goes primarily to inpatient curative care (47 percent of household spending) and outpatient curative care (39 percent of household spending). Thirteen percent goes to the purchase of medicine and medical goods.
Figure 13 shows the trend in OOP spending over time both in absolute terms (as OOP spending per capita) and as the percentage of OOP spending out of THE. In both relative and absolute terms, OOP spending is increasing, particularly in the past six years. In the four years between 2008/09 and 2012/13, OOP spending per capita doubled. OOP payments cause households to bear the full cost of health goods and services at the time of seeking care and represent a significant financial burden for them. High levels of OOP payments are inequitable and consistently prove to be an inefficient means of financing health care.
Figure 11. Household OOP spending by type of provider
Figure 12. Spending managed by households by type of service
Public hospitals
13%
Private hospitals
43% Public health centers
3%
Private clinics
24%
Pharmacies 13%
Other 4%
Inpatient curative
47%
Outpatient curative
39%
Purchase of drugs and
medical goods
13%
Prevention 1%

16
Figure 13. Total household OOP spending per capita (real 2012/13 N$) (OOP spending as a % of THE)
Source: Health Accounts data 2001/02-2012/13
2.1.7 What goods and services are purchased by the government?
Over the past 11 years of Health Accounts data, the government of Namibia has increased spending on health more than two-fold, from N$1,577 million in 2001/02 to N$4,048 million in 2012/13 (Table 2). However, there hasn’t been a concomitant improvement in the quality of health care. As an indicator for quality, a recent study (Akpabio et al. 2014) analyzed compliance with the Namibia Standard Treatment Guidelines (STG) criteria across 13 public health facilities in Namibia. Using the strict criteria (in which prescribing must fully comply with the STG stipulations), only 26.2 percent of prescriptions complied with STG guidelines. Using the loose criteria (in which some deviations in dose and duration of treatment are allowed), only 55.1 percent were compliant. Additionally, the authors noted that compliance in 2013 was much lower than in 2011. This raises the question that if the government is spending more on health, where is the money going if not to improve the quality of services?
Table 3. Trend in absolute and real spending managed by government
2001/02 2002/03 2003/04 2004/05 2005/06 2006/07 2007/08 2008/09 2012/13 Total Expenditure
Managed by govt (real 2012/13 N$ mill ions)
1,577 1,890 2,058 1,996 2,403 2,455 4,071 4,332 4,048
Spending managed by govt as % of THE
56.9% 58.1% 56.1% 47.9% 47.3% 42.2% 67.3% 68.1% 44.0%
Source: Health Accounts data 2001/02-2012/13
47 (3%)
70 (4%)
99 (5%) 80
(4%)
96 (4%)
94 (3%)
207 (7%)
195 (6%)
472 (11%)
-
50
100
150
200
250
300
350
400
450
500
2001/02 2002/03 2003/04 2004/05 2005/06 2006/07 2007/08 2008/09 2012/13
Tota
l H
H O
OP
Sp
en
din
g p
er
Cap
ita
(re
al 2
01
2/1
3 N
N)

17
Inpatient curative
77%
Outpatient curative
5%
Purchase of drugs and medical goods 15%
Prevention <1%
General mgt 3%
Given that the MOHSS manages 95 percent of government resources for health, understanding its breakdown by service provision is critical. As Figure 14 shows, just over two-thirds (67 percent) of government spending goes to curative care, with an approximately equal breakdown between inpatient and outpatient care. Spending on prevention accounts for 7 percent. Nine percent contributes to capital formation, the long-term investment in items such as buildings, machines, vehicles, and equipment. Health system administration and general management accounts for 15 percent of government spending.
PSEMAS, the main medical aid scheme in Namibia, manages 14 percent of THE. The breakdown of spending managed by PSEMAS shows that more than three-quarters (77 percent) are spent on inpatient curative care. Outpatient curative care spending is minimal, 5 percent, while 15 percent are used to purchase medicine and medical goods.
Figure 14. Spending managed by the government by type of
service
Figure 15. Spending managed by PSEMAS by type of service
Inpatient curative
36%
Outpatient curative
31%
Prevention 7%
General mgt 15%
Other 2% Capital
formation 9%

18
2.1.8 Which diseases and health conditions does Namibia spend on?
There was little information available on spending by disease/health condition category; therefore, estimations were based on the health service utilization data obtained from the MOHSS and cost information from WHO. Reproductive health receives the highest allocation of funds, 38 percent of THE, followed closely by infectious and parasitic diseases at 33 percent. Within the infectious and parasitic diseases category, spending is highest on HIV/AIDS at 13 percent of THE, followed by respiratory infections at 10 percent, and diarrheal diseases at 4 percent. Approximately 5 percent of THE is on NCDs and a similar percentage is spent on injuries.
Namibia is undergoing an epidemiological transition from communicable diseases to NCDs and for some time it will continue to face this double burden of disease (high rates of both communicable and non-communicable diseases). Figure 17 shows the disease burden in Namibia: NCDs are displayed in blue. They currently represent roughly one-third of the disease burden and they are an increasing percentage of the burden (IHME 2013). Despite this, expenditure on NCDs is small, only 5 percent of THE. If not addressed clinically and financially, NCDs will have economic costs as Namibians who suffer from them work for fewer years, and are less productive even when they work.
As improvements in data collection enable a greater proportion of spending to be disaggregated to a disease or health condition, this analysis will permit a comparison of spending with national priorities.
Figure 16. THE by disease / health condition
Reproductive health 38%
Nutritional deficiencies
<1%
Non-communicable
diseases 5%
Injuries 5%
Other diseases / conditions
19% HIV/AIDS
13%
TB 2% Malaria
1%
Respiratory infections 10%
Diarrheal diseases 4% Vaccine preventable
diseases 1% Other infectious and
parasitic diseases 2%
Infectious and Parasitic Diseases
33%

19
Figure 17. Disease burden in Namibia, both sexes, 2013
Source: IHME (2013)

20
2.2 HIV expenditures
This section discusses the subset of health spending that goes to HIV health goods and services only. Total spending for HIV in 2012/13 was N$1,202,934,157 (13 percent of THE), with 99 percent representing recurring spending and 1 percent capital spending. Spending on health care-related items was minimal, less than 1 percent of total spending on HIV. The health care-related category comprised provision of non-health support and social services for orphans and vulnerable children and long-term social care. Figure 18 ranks the top 25 causes of years of life lost (YLL) in Namibia. As of 2010, HIV ranks first in the Namibian Burden of Disease list, representing almost 30 percent of the total YLL in the country.
Figure 18. Top 25 causes of YLLs 1990-2010, Namibia
This chart shows the change in the top 25 causes of YLLs due to premature mortality from 1990 to 2010. Solid lines indicate a cause has moved up in rank or
stayed the same. Broken lines indicate a cause has moved down in rank. The causes are color coded by blue for non -communicable diseases, green for
injuries, and red for communicable, maternal, neonatal, and nutritional causes of death.
Source: IHME (2010)

21
Govt 37%
Employers 5%
Households 2%
NGOs <1%
Donors 51%
Other 5%
2.2.1 Who is funding HIV health goods and services?
Donors provide the majority of HIV funds (51 percent) and 37 percent comes from government. The fact that the Health Accounts estimation shows that only 2 percent of HIV spending comes from households implies that people living with HIV are well protected from financial risk when seeking care.
Figure 19. HIV spending by source of financing

22
Curative care 46%
Long-term care <1%
Ancillary services
1%
medical goods
3%
Prevention 16%
Admin 28%
Other 5%
Capital 1%
2.2.2 What types of HIV health goods and services are purchased?
Approximately 46 percent of HIV health spending was on care and treatment. Sixteen percent was on prevention, which includes counselling and testing, distribution of condoms, and information, education and communication. Of the data that could be allocated to a specific disease, prevention spending for HIV/AIDS appears to be greater than for other diseases, which has no doubt contributed to progress with the HIV response. General management of the HIV/AIDS program represents 28 percent of HIV spending. Compared to general health spending, where the share of THE spent on administration is 12 percent, the proportion of HIV spending spent on administration is high. This comparison suggests that there might be some
efficiency gains to be made through pooling administration spending across different service categories.
Figure 20. HIV spending by type of service

23
Curative 71%
Medical goods
6%
Prevention 3%
Admin 13%
Other <1% Capital
7%
Govt 70%
Employers 10%
Households 7%
Donors 1% Other
12%
2.3 Reproductive health expenditures
This section looks at spending on reproductive health (RH) goods and services only. This category is a subset of the results presented in Section 2.1. Spending on RH, which comprises maternal health, family planning, and other services, accounts for 38 percent of THE. Spending for RH in 2012/13 totaled N$3,526,296,384, with 93 percent representing recurring spending and 7 percent capital spending.
2.3.1 Who is funding reproductive health goods and services?
The government provides the majority of RH funds (70 percent). The contribution by donors is low, one percent, which is an encouraging sign of sustainability of the national RH response. With only 7 percent of RH spending comes from households, it seems that people are fairly well protected from financial risk when seeking RH care.
2.3.2 What types of
reproductive health goods and services are purchased?
Approximately 71 percent of RH spending was for care and treatment. Three percent was for prevention. General management represented 13 percent of RH spending.
Figure 21. RH spending by source of financing
Figure 22. RH spending by type of service

24
3. POLICY IMPLICATIONS AND RECOMMENDATIONS
The results of the Health Accounts exercise elicit a number of recommendations to inform financing of the overall health system in Namibia. The key recommendations are discussed in this section.
Investigate alternate sources of financing to ensure sustainability
While the level of government financing of health in Namibia has remained stable at 54 percent of THE since the previous Health Accounts exercise of 2008/09, there has been a significant reduction – from 22 percent to 8 percent – in donor contributions to health. Compensating for this decrease in donor funding were private sources of financing including an increase in general household and specifically household OOP expenditure. With Namibia’s commitment to achieve universal health coverage, the country needs to ensure that it identifies means of sustainable financing for health in order to provide affordable access to health care for all Namibians and to reduce the burden of health care costs on households.
Increase government health expenditure to achieve the Abuja target
Government expenditure on health as a percentage of government total expenditure has declined from 14.7 percent in 2008/09 to 13 percent in 2012/13 even though at the same time absolute government spending increased by 103 percent, from N$18,599 million to N$37,761 million (Ministry of Finance 2015). Despite being one of the countries in southern Africa with the highest proportion of government health spending in comparison to total government spending, there is still room for Namibia to increase its spending to achieve the Abuja target of 15 percent and contribute towards the achievement of universal health coverage. Such an increase in the government health budget would be critical in compensating for the significant decrease in donor funding over the past four years. To maintain Namibia’s HIV response in light of the growing gap in funding as PEPFAR and
other donors pull out resources from Namibia, the government should mobilize domestic resources for HIV by increasing the HIV allocation and by integrating HIV services into other health services to produce efficiency gains.
Contain increases in household out-of-pocket expenditure
Private health expenditure has increased from 24.4 percent in 2008/09 to 38 percent in 2012/13. As part of private health expenditure, both general household expenditure and household OOP payments have increased. Household expenditure has increased from 12.2 percent of THE in 2008/09 to 16 percent in 2012/13 and OOP expenditure has increased from 6.3 percent in 2008/09 to 11 percent in 2012/13. While these figures are not high in comparison to other southern African countries, the significant increase in household OOP over the past four years raises concerns, especially if the trend continues. In relative and absolute terms, OOP spending is increasing in Namibia. Between 2008/09 and 2012/13, OOP spending per capita doubled. OOP payments cause households to bear the full cost of health goods and services at the time of seeking care; this represents a significant – and potentially catastrophic4 – financial burden. High levels of OOP payments are inequitable and consistently prove to be an inefficient means of financing health care. Instead, schemes that pool risk across a large group of individuals ensures risks are spread evenly so that those who cannot afford health care and are most sick are supported by those who are wealthier and less sick. In addition, issues that contribute to household payments, like the escalating cost of medical aid premiums, should be addressed.
4 Catastrophic health expenditure occurs when OOP spending for health exceeds 40 percent of a household’s
non subsistence spending.

25
Focus more funds on primary care in order to improve quality, accessibility, and allocative efficiency
Health spending in Namibia appears to be skewed toward curative care delivered at the secondary and tertiary levels of the health system; spending on secondary and tertiary-level care is 56 percent of THE, whereas THE on primary-level care is only 22 percent. In terms of human resources, Namibia’s public health sector is facing a human resources crisis – the sector has barely two health workers per 1,000 people, which puts it short of the WHO recommendation of at least 2.5 health workers per 1,000 population (WHO 2015b). The primary level is understaffed, especially in rural areas, where the public health sector experiences chronic shortages of frontline primary care workers, including doctors and nurses (McQuide et al. 2013). More resources should be allocated to the primary level in order to improve accessibility, quality of services, and allocative efficiency.
These findings point to the need for closer investigation of cost efficiency and resource allocation decisions. Greater spending on primary care and prevention will not only help to improve the quality of life of the population but also to reduce the costs of care. In this way, reallocating resources toward primary and prevention/ promotion spending has potential to not only free up additional resources but also improve cost efficiency.
Allocate more funding and pay more attention to non-communicable
diseases
Namibia is undergoing an epidemiological transition from communicable diseases to NCDs and for some time it will continue to face this double burden of disease. If not addressed clinically and financially, NCDs will have economic costs as Namibians who suffer from them work for fewer years, and are less productive even when they work. Hence the MOHSS should start preparing the health system to address NCDs. This will include proper communication and promotion of NCD prevention interventions, building the capacity of the system and health workers to respond to NCDs, ensuring the availability and affordability of key medicines and basic technologies, and integrating NCD prevention and control into national policies (Henry J. Kaiser Family Foundation 2014). All this demands that NCDs get a higher share of THE.
Improve equity in financing and in access to health services
With over half of health spending in Namibia provided by the government, the government has demonstrated a strong commitment to health. However, going forward, it is important for the MOHSS to understand whether its health spending is sufficient and equitable across the population. The government should aim to understand the extent to which there are unmet health needs or where its spending is not reaching those who need it the most – groups who are underutilizing health services because of financial and other barriers to access. By comparing costed projections with Health Accounts data on past spending, the government can predict resource gaps and mobilize resources accordingly.
Improve efficiency within the public and private health sector
Health Accounts track total expenditure on health within a given year and, when paired with additional health system data and indicators can provide insight into how efficiently those resources were spent. For example, in Namibia a cesarean section is approximately three times more expensive than a vaginal delivery. WHO’s recommended cesarean section rate is 10 percent (WHO 2015c), however, in the three main private hospitals in Windhoek the cesarean section rate is 78 percent. Therefore, the private health sector in Namibia is over performing cesarean sections which wastes resources and can have negative consequences the health of the mother and infant. An analysis should be performed in the public and private sectors in order to identify bottle necks in service delivery, reduce unnecessary cost, and improve efficiencies so that each dollar spent has its greatest possible impact on health.
26
4. RECOMMENDATIONS FOR FUTURE RESOURCE
TRACKING EXERCISES
The health system in Namibia faces several challenges, including inequity in access to services, high HIV/AIDS prevalence and incidence rates, and shortages of human resources for health. This underscores the need to develop a fiscally sustainable, equitable, and efficient approach to financing health services.
Namibia has been conducting health resource tracking using the Health Accounts framework since 2001; this report represents the eleventh year of health expenditure data. This affords policymakers evidence to guide decisions about resource allocation and health financing reform. As a result of this latest round of Health Accounts, the MOHSS now has staff who are knowledgeable about the SHA 2011 framework and experienced in conducting Health Accounts exercises. Future spending estimations should draw upon the experience of this staff (Annex B).
Response rates from the private sector, and particularly from employers, should be improved. Entities that did not provide data cited reasons such as concerns about confidentiality and lack of time and staff to provide the data in the format requested. In the future, there is a need to increase the accountability and transparency of the private sector organizations operating in the health sector and of the MOHSS. This could be facilitated through orientation sessions for insurance companies, employers, and NGOs to introduce Health Accounts, emphasize the importance of the data collected, and explain the survey instrument and the specific data that the HA requires.
Producing Health Accounts on a routine basis is important to ensure that the health expenditure information remains up-to-date and relevant to policy discussions. It enables more powerful analyses, as data over time allows for identifying trends in health spending, and more meaningful application of results, as more stakeholders will be aware of the results and how to use them effectively. As part of its institutionalization of the Health Accounts process, Namibia should continue to streamline the collection of household data by incorporating household survey questions into existing national surveys, like the DHS.
Future collaboration between the Health Accounts team, the NASA team, and other resource tracking teams will ensure that the different teams use consistent methodologies for their allocation of non-targeted expenditures. This will ensure comparability of results across studies.

27
ANNEX A: KEY HEALTH INDICATORS FOR NAMIBIA AND COMPARATIVE COUNTRIES
WITH SIMILAR INCOME LEVEL, 2012
Source: WHO Global Health Expenditure Database, http://apps.who.int/nha/database/ViewData/Indicators/en
Indicator Namibia (2012/13)
Algeria Angola Botswana Gabon Mauritius Seychelles South Africa
THE per capita at exchange rate (USD)
$500 $279 $191 $384 $397 $444 $521 $645
THE as % GDP 9 5 3 5 3 5 5 9
Government health spending as % THE
54 84 62 56 51 48 93 48
Government health spending as % total government spending
13 10 6 8 7 10 11 13
Private expenditure on health as % of THE
27 16 38 44 49 51 7 52
OOP spending as % THE
11 15 27 6 41 47 2 7

28
ANNEX B: CONTRIBUTORS TO THE HEALTH ACCOUNTS
EXERCISE Core technical team:
ORGANIZATION NAME POSITION
MOHSS, Directorate of Policy, Planning and Human Resource Development (PPHRD)
Mr. T. Mbeeli Deputy Director
Mr. L.C. Usurua Health Program Administrator MOHSS, Directorate of Finance and Logistics Ms. T. Block Accountant
WHO Dr. T. Zapata Health Systems Officer USAID HFG project Mr. T. Ashagari Health Resource Tracking Advisor
Ms. H. Cogswell Health Resource Tracking Specialist
Ms. C. Jones Health Resource Tracking Specialist
Other contributors:
ORGANIZATION NAME POSITION
MOHSS: Directorate of PPHRD Mr. P. Ndaitwa Under-Secretary
MOHSS: Directorate of PPHRD Ms. H. Nangombe Chief Health Program Administrator
Mr. MS. Simasiku Senior Health Program Administrator
MOHSS: Directorate of Special Programs
Mr. A. Uakurama Chief Health Program Administrator
MOHSS: Directorate of Finance and Logistics
Ms. L. Karises Deputy Director
MOHSS: Directorate of Tertiary Health Care and Clinical Support Services
Mr. L. Indongo Deputy Director
MOHSS: Directorate of Primary Health Care
Ms. T. Davids Chief Health Program Administrator
Ministry of Finance: Medical Aid Division
Mr. E. Coetzee Chief Account
National Planning Commission Ms. E. Iilonga National Development Advisor
NAMFISA Ms. M. Nakale-Gaomas General Manager- Provident Institutions
NAMAF Mr. G. Mbapaha Chief Executive Officer
Namibia Chamber of Commerce and Industry
Mr. L. Kamwi Head of Research
Social Security Commission Mr. C. Karamata Research and Development Officer
University of Namibia: Faculty of Nursing and Public Health Science
Dr. L. v/d Westhuizen Lecturer
Polytechnic of Namibia: School of Health and Applied Science
Mr. J. Hidinwa
Lecturer
29
ANNEX C: REFERENCES
Akpabio, E., Sagwa, E., Mazibuko, G., Kagoya, H.R., Niaz, Q, and Mabirizi, D. 2014. Assessment of Compliance of Outpatient Prescribing with the Namibia Standard Treatment Guidelines in Public Sector Health Facilities. Submitted to the US Agency for International Development by the Systems for Improved Access to Pharmaceuticals and Services (SIAPS) Program. Arlington, VA: Management Sciences for Health.
Cogswell, Heather, Catherine Connor, Tesfaye Dereje, Avril Kaplan, and Sharon Nakhimovsky. September 2013. System of Health Accounts 2011: What is SHA 2011 and How Are SHA 2011 Data Produced and Used? Bethesda, MD: Health Finance and Governance project, Abt Associates Inc.
Government of Namibia, Health Systems 20/20 Project, World Health Organization, and UNAIDS.
December 2010. Namibia Health Resource Tracking: 2007/08 & 2008/09. Bethesda, MD: Health Systems 20/20 project, Abt Associates Inc.
Henry J. Kaiser Family Foundation. April 2014. Global Health Policy: The U.S. Government and Global Non-Communicable Diseases. Accessed on May 26, 2015 from: http://kff.org/global-health-policy/fact-sheet/the-u-s-government-and-global-non-communicable-diseases/
IHME. 2010. Global Burden of Disease Profile: Namibia. Retrieved on May 26, 2015 from: http://www.healthdata.org/sites/default/files/files/country_profiles/GBD/ihme_gbd_country_report_namibia.pdf
IHME. 2013. Disease burden in Namibia, both sexes, 2013. Retrieved on May 26, 2015 from: http://vizhub.healthdata.org/gbd-compare/
McQuide, P., Kolehmainen-Aitken, R., and Forster, N. 2013. Applying the workload indicators of staffing need (WISN) method in Namibia: challenges and implications for human resources for health policy. Human Resources for Health, 11:64
Ministry of Finance. 2015. Estimate of Revenue 2014/15 Final. Windhoek, Namibia
Ministry of Health and Social Services [Namibia] (MOHSS). November 2003. Namibia National Health Accounts. Windhoek: Directorate: Policy, Planning and Human Resources Development.
Ministry of Health and Social Services [Namibia] (MOHSS). 2010. United Nations General Assembly Special Session (UNGASS) Country Report: Reporting Period 2008-2009. Windhoek, Namibia: MOHSS.
Ministry of Health and Social Services. June 2015. Namibia 2012/13 Health Accounts: Statistical Report. Windhoek, Namibia.
Ministry of Health and Social Services (MOHSS) [Namibia] and Health Systems 20/20. August 2008. Namibia National Health Accounts 2001/02–2006/07. Windhoek, Namibia and Bethesda, MD, USA: Health Systems 20/20 project, Abt Associates Inc.
Ministry of Health and Social Services [Namibia] (MOHSS) Directorate of Special Programs, Global Fund, and UNAIDS. 2014. Namibia National AIDS Spending Assessment 2012/13 and 2013/14. Windhoek, Namibia.
Ministry of Health and Social Services (MOHSS), National Statistics Agency (NSA), and ICF International. September 2014. 2013 Namibia Demographic and Health Survey. Windhoek, Namibia and Rockville, Maryland, USA: MOHSS, NSA, and ICF International.

30
Nakhimovsky, Sharon, Patricia Hernandez-Pena, Cornelius van Mosseveld, and Alan Palacios. June 2014. System of Health Accounts (2011) and Health Satellite Accounts (2005): Comparison of Approaches. Bethesda, MD: Health Finance and Governance project, Abt Associates Inc.
Organization for Economic Cooperation and Development (OECD), Eurostat, and World Health Organization (WHO). 2011. A System of Health Accounts. OECD Publishing.
Republic of Namibia. n.d. Estimates of Revenue, Income and Expenditure: 01 April 2014 to 31 March 2017. Windhoek, Namibia.
World Bank. 2015. GINI Index. Retrieved on May 26, 2015 from: http://data.worldbank.org/indicator/SI.POV.GINI?order=wbapi_data_value_2009+wbapi_data_value+wbapi_data_value-last&sort=desc&page=1
World Health Organization. May 2010. Country Cooperation Strategy at a Glance—Namibia. Retrieved from: http://www.who.int/countryfocus/cooperation_ strategy/ccsbrief_nam_en.pdf.
WHO. 2015a. Namibia Analytical Summary. Retrieved on June 2, 2015from: http://www.aho.afro.who.int/profiles_information/index.php/Namibia:Analytical_summary_-_Health_financing_system
WHO. 2015b. Namibia Health Workforce Analytical Summary. Retrieved on May 26, 2015 from: http://www.aho.afro.who.int/profiles_information/index.php/Namibia:Analytical_summary_-_Health_workforce
WHO. 2015c. Statement on Caesarean Section Rates. Retrieved on June 3, 2015 from: http://apps.who.int/iris/bitstream/10665/161442/1/WHO_RHR_15.02_eng.pdf?ua=1
WHO. n.d. WHO Global Health Expenditure Database. Accessed May 1, 2015 from: http://apps.who.int/nha/database/ViewData/Indicators/en
Xu, Ke et al. 2010. Exploring the thresholds of health expenditure for protection against financial risk. World Health Report Background Paper, No. 19. Geneva.