Embed Size (px)
Citation preview

Chapter 1
Introduction Regular and non-invasive assessments of cardiovascular function are
important insurveillance for cardiovascular catastrophes and treatment
therapies of chronic diseases.Resting heart rate, one of the simplest
cardiovascular parameters, has been identified as anindependent risk
factor (comparable with smoking, dyslipidemia or hypertension)
for cardiovascular disease [1]. Currently, the gold standard techniques
for measurement of thecardiac pulse such as the electrocardiogram
(ECG) require patients to wear adhesive gel patches or chest straps
that can cause skin irritation and discomfort. Commercial
pulseoximetry sensors that attach to the fingertips or earlobes are also
inconvenient for patientsand the spring-loaded clips can cause pain if worn
over a long period of time.The ability to monitor a patient¶s physiological
signals by a remote, non-contactmeans is a tantalizing prospect that
would enhance the delivery of primary healthcare. For example, the
idea of performing physiological measurements on the face was first
postulated by Pavlidis and associates [2] and later demonstrated
through analysis of facial thermalvideos. Although non-contact
methods may not be able to provide details concerning
cardiacelectrical conduction that ECG offers, these methods can now
enable long-term monitoring of other physiological signals such as
heart rate or respiratory rate by acquiring themcontinuously in an
unobtrusive and comfortable manner.Beyond that, such a technology
would also minimize the amount of cabling andclutter associated with
neonatal ICU monitoring, long-term epilepsy monitoring, burn
or trauma patient monitoring, sleep studies, and other cases where a continuous
measure of heart-rate is important. The use of photoplethysmography
(PPG), a low cost and non-invasivemeans of sensing the
cardiovascular pulse wave (also called the blood volume pulse)
throughvariations in transmitted or reflected light, for non-contact
physiological measurements has been investigated recently. This
electro-optic technique can provide valuable informationabout the
cardiovascular system such as heart rate, arterial blood oxygen
saturation, blood pressure, cardiac output and autonomic function.
Typically, PPG has always been implemented using dedicated light sources (e.g. redand/or infra-red wavelengths), but recent work has shown that pulse measurements can beacquired using digital camcorders/cameras with normal ambient light as the illuminationsource. However, all these previous efforts lacked rigorous physiological and mathematicalmodels amenable to computation; they relied instead on manual segmentation and heuristicinterpretation of raw images with minimal validation of performance characteristics.Furthermore, PPG is known to be susceptive to motion-induced signal corruption andovercoming motion artifacts presents one of the most challenging problems. In most cases,the noise falls within the same frequency band as the physiological
signal of interest, thusrendering linear filtering with fixed cut-off frequencies ineffective. In order to develop aclinically useful technology, there is a need for ancillary functionality such as motion artifactsreduction through efficient and robust image analysis.One technique for noise removal from physiological signals is blind source separation(BSS). BSS refers to the recovery of unobserved signals or ³sources´ from a set of observedmixtures with no prior information about mixing process. Typically, the observations areacquired from the output of a set of sensors, where each sensor receives a differentcombination of the source signals. There are several methods of BSS and in this paper wewill focus on BSS by Independent Component Analysis (ICA). ICA is a technique for uncovering the independent source signals from a set of observations that are composed of linear mixtures of the underlying sources. ICA has also been applied to reduce motionartifacts in PPG measurements.In this topic, a novel methodology for non-contact, automated, and motion tolerantcardiac pulse measurements from video images based on blind source separation. Firstly, theapproach is described and it is applied to compute heart rate measurements from videoimages of the human face recorded using a simple webcam. Secondly, we demonstrate howthis method can tolerate motion artifacts and validate the accuracy of this approach with anFDA-approved finger blood volume pulse (BVP) measurement device.

Thirdly, we showhow this method can be easily extended for simultaneous heart rate measurements of multiple persons.

Chapter 2
Resting Heart Rate Heart rate is the number of heartbeats per unit of time, typically expressed as
beats per minute
(bpm) [3]. Heart rate can vary as the body's need to absorb oxygen
and excrete carbondioxide changes, such as during exercise or sleep.
The measurement of heart rate is used bymedical professionals to a
ssist in the diagnosis and tracking of medical conditions . It is alsoused
by individuals, such as athletes, who are interested in monitoring their
heart rate to gainmaximum efficiency from their training. The R wave
to R wave interval (RR interval) is theinverse of the heart rate.
2.1 Measurement of Heart Rate Heart rate is measured by finding the pulse of the body. This pulse
rate can be measured atany point on the body where the artery's
pulsation is transmitted to the surface by pressuringit with the index
and middle fingers; often it is compressed against an underlying
structurelike bone. The thumb should not be used for measuring another
person's heart rate, as itsstrong pulse may interfere with discriminating the site of
pulsation.Possible points for measuring the heart rate are:1. The ventral
aspect of the wrist on the side of the thumb (radial artery).2. The ulnar artery.3.
The neck (carotid artery).4. The inside of the elbow, or under the biceps
muscle (branchial artery).5. The groin (femoral artery).6. Behind the
medial malleolus on the feet (posterior tibial artery).7. Middle of dorsum
of the foot (dorsalis pedis).8. Behind the knee (popliteal artery).9. Over
the abdomen (abdominal aorta).A more precise method of determining
pulse involves the use of anelectrocardiograph, or EKG (also abbreviated
EKG). Continuous electrocardiographmonitoring of the heart is
routinely done in many clinical settings, especially in critical care
medicine. Commercial heart rate monitors are also available,
consisting of a chest strap withelectrodes. The signal is transmitted to
a wrist receiver for display. Heart rate monitors allowaccurate
measurements to be taken continuously and can be used during
exercise whenmanual measurement would be difficult or impossible (such as
when the hands are beingused).

2.2 Measurements at Rest
The resting heart rate (HRrest) is a person's heart rate when they are at
rest, that is lying down but awake, and not having recently exerted
themselves. The typical healthy resting heart ratein adults is 60±80
bpm , with rates below 60 bpm referred to as bradycardia, and rates
above100 bpm referred to as tachycardia. Note however that
conditioned athletes often have restingheart rates below 60 bpm. Cyclist
Lance Armstrong had a resting HR around 32 bpm, and itis not unusual for
people doing regular exercise to get below 50 bpm. Other cyclists
likeMiguel Indurain also have a very low heart rate at rest (29 bpm).
Musical tempo terms reflectlevels relative to resting heart rate;
Adagio
(at ease, at rest) is typically 66±76 bpm, similar tohuman resting heart
rate, while Lento
and Largo
("Slow") are 40±60 bpm, which reflects thatthese tempi are slow
relative to normal human heart rate. Similarly, faster tempi
correspondto heart rates at higher levels of exertion, such as Andante
(walking: 76±108 bpm) and thelike.
The normal heart rate in children is variable and depends on the
child's age. The rangesthat should be considered normal are
controversial. 2.3 Abnormalities
2.3.1Tachycardia Tachycardia is a resting heart rate more than 100 beats per minute.
This number can vary assmaller people and children have faster heart
rates than average adults.
2.3.2 Bradycardia
Bradycardia is defined as a heart rate less than 60 beats per minute
although it is seldomsymptomatic until below 50 bpm when a human
is at total rest. Trained athletes tend to haveslow resting heart rates,
and resting bradycardia in athletes should not be consideredabnormal

if the individual has no symptoms associated with it. For example
Miguel Indurain,a Spanish cyclist and five time Tour de France
winner, had a resting heart rate of 29 beats per minute, one of the
lowest ever recorded in a healthy human. Again, this number can vary
aschildren and small adults tend to have faster heart rates than average
adults. 2.3.3 Arrhythmia
Arrhythmias are abnormalities of the heart rate and rhythm
(sometimes felt as palpitations).They can be divided into two broad
categories: fast and slow heart rates. Some cause few or minimal
symptoms. Others produce more serious symptoms of lightheadedness,
dizzinessand fainting. 2.4 Heart Rate as a Risk Factor
A number of investigations indicate that faster resting heart rate has
emerged as a new risk factor for mortality in homeothermic
mammals, particularly cardiovascular mortality inhuman beings.
Faster heart rate may accompany increased production of
inflammationmolecules and increased production of reactive oxygen
species in cardiovascular system, inaddition to increased mechanical
stress to the heart. There is a correlation between increasedresting r ate
and cardiovascular risk. This is not seen to be "using an allotment of
heart beats" but rather an increased risk to the system from the
increased rate. An Australian-ledinternational study of patients with
cardiovascular disease has shown that heart beat rate is akey indicator
for the risk of heart attack. The study, published in The Lancet
(September 2008) studied 11,000 people, across 33 countries, who
were being treated for heart problems.Those patients whose heart rate was
above 70 beats per minute had significantly higher incidence of heart attacks,
hospital admissions and the need for surgery.

Chapter 3
Photoplethysmography 3.1 Photoplethysmography
A photoplethysmography [4] (PPG) is an optically obtained
plethysmograph, a volumetricmeasurement of an organ. A PPG is
often obtained by using a pulse oximeter whichilluminates the skin and
measures changes in light absorption. A conventional pulse oximeter monitors
the perfusion of blood to the dermis and subcutaneous tissue of the
skin. With eachcardiac cycle the heart pumps blood to the periphery.
Even though this pressure pulse issomewhat damped by the time it reaches
the skin, it is enough to distend the arteries andarterioles in the subcutaneous
tissue.
Figure 3.1Representative PPG taken from an ear pulse oximeter.
If the pulse oximeter is attached without compressing the skin, a
pressure pulse canalso be seen from the venous plexus, as a small
secondary peak. The change in volumecaused by the pressure pulse is
detected by illuminating the skin with the light from a light-emitting
diode (LED) and then measuring the amount of light either
transmitted or reflectedto a photodiode. Each cardiac cycle appears as
a peak, as seen in the figure. Because bloodflow to the skin can be
modulated by multiple other physiological systems, the PPG can also
7

be used to monitor breathing, hypovolemia, and other circulatory
conditions. Additionally,the shape of the PPG waveform differs from
subject to subject, and varies with the locationand manner in which the
pulse oximeter [5] is attached. 3.2 Sites for Measuring PPG
While pulse oximeters are a commonly used medical device the PPG
derived from them israrely displayed, and is nominally only processed
to determine heart rate. PPGs can beobtained from transmissive
absorption (as at the finger tip) or reflective (as on the forehead).In
outpatient settings, pulse oximeters are commonly worn on the finger.
However, in casesof shock, hypothermia, etc. blood flow to the
periphery can be reduced, resulting in a PPGwithout a discernible
cardiac pulse. In this case, a PPG can be obtained from a pulse
oximeter on the head, with the most common sites being the ear, nasal
septum, and forehead. PPGs canalso be obtained from the vagina and
esophagus.
3.3 Uses of Photoplesmography 3.3.1 Monitoring Heart Rate and Cardiac Cycle
Because the skin is so richly perfused, it is relatively easy to detect
the pulsatile componentof the cardiac cycle. The DC component of
the signal is attributable to the bulk absorption of the skin tissue,
while the AC component is directly attributable to variation in blood
volumein the skin caused by the pressure pulse of the cardiac cycle. The height
of AC component of the photoplethysmogram is proportional to the
pulse pressure, the difference between thesystolic and diastolic
pressure in the arteries. As seen in the figure showing
prematureventricular contractions (PVCs), the PPG pulse for the
cardiac cycle with the PVC results inlower amplitude blood pressure
and a PPG. Ventricular tachycardia and ventricular fibrillation can
also be detected.
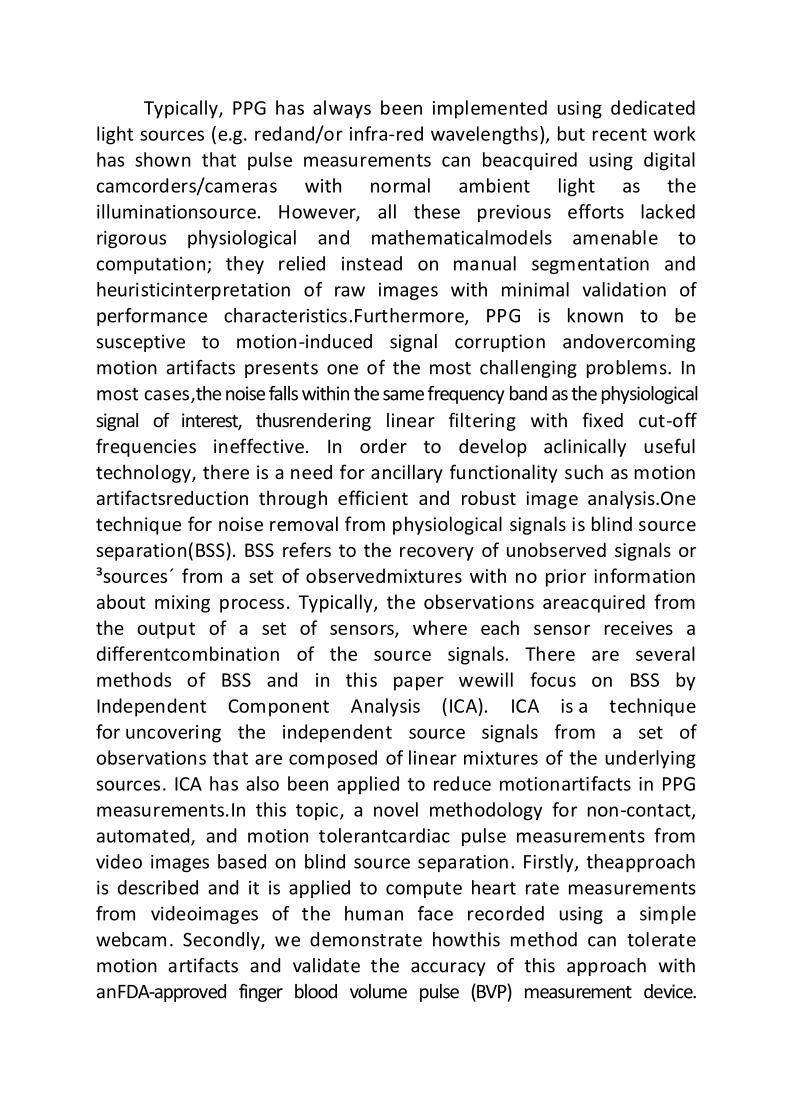
3.3.2 Monitoring Respiration Respiration affects the cardiac cycle by varying the intrapleural
pressure, the pressure between the thoracic wall and the lungs. Since
the heart resides in the thoracic cavity betweenthe lungs, the partial
pressure of inhaling and exhaling greatly influence the pressure on
thevena cava and the filling of the right atrium. This effect is often
referred to as normal sinus arrhythmia. During inspiration,
intrapleural pressure decreases by up to 4 mm Hg, whichdistends the
right atrium, allowing for faster filling from the vena cava, increasing
ventricular preload, and increasing the stroke volume. Conversely
during expiration, the heart iscompressed, decreasing cardiac
efficiency and reducing stroke volume. However, the overallnet effect
of respiration is to act as pump for the cardiovascular system. When
the frequencyand depth of respiration increases, the venous return
increases, leading to increased cardiacoutput.
Figure 3.2 Photoplesmography of respiration
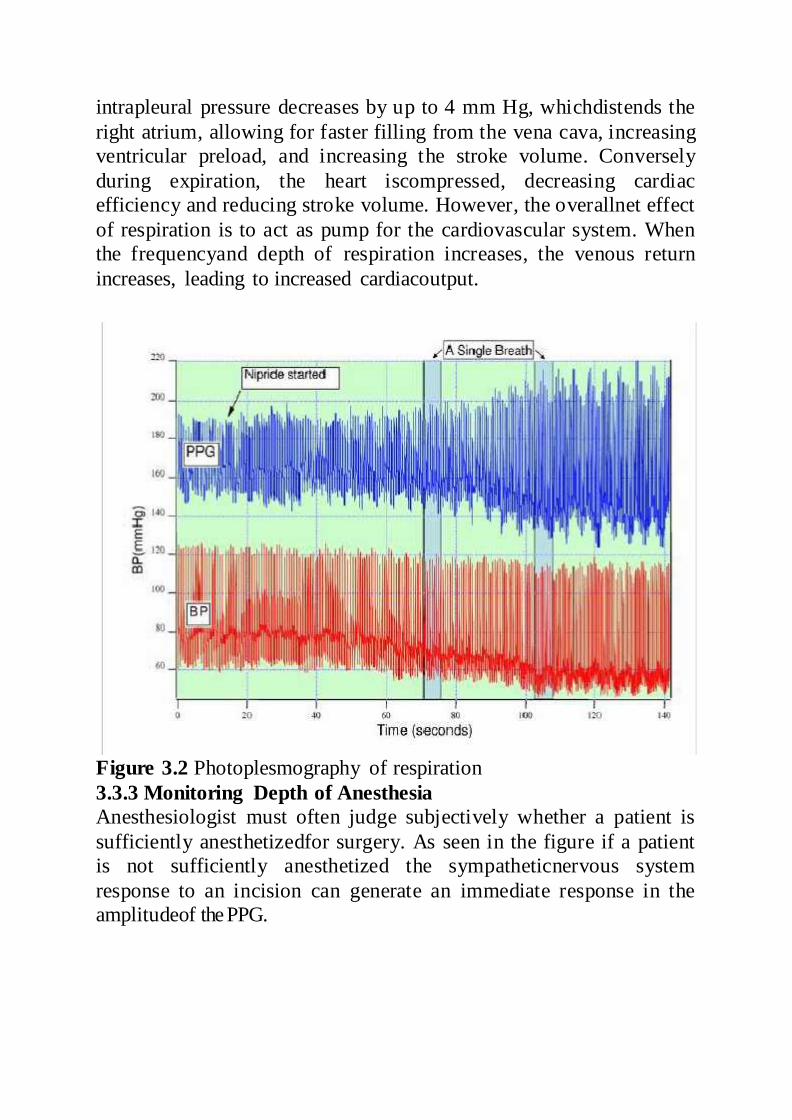
3.3.3 Monitoring Depth of Anesthesia Anesthesiologist must often judge subjectively whether a patient is
sufficiently anesthetizedfor surgery. As seen in the figure if a patient
is not sufficiently anesthetized the sympatheticnervous system
response to an incision can generate an immediate response in the
amplitudeof the PPG.
Figure 3.3 Photoplesmography under the anesthesia condition 3.3.4 Monitoring Hypo and Hypervolemia
Shamir, Eidelman, et al. studied the interaction between
inspiration and removal of 10% of a patient¶s blood volume for blood
banking before surgery. They found that blood loss could bedetected both
from the photoplethysmogram from a pulse oximeter and an arterial
catheter.Patients showed a decrease in the cardiac pulse amplitude
caused by reduced cardiac preloadduring exhalation when the heart is being
compressed.

Chapter 4
Study Description and Experimental Setup 4.1 Experimental setup
Figure 4.1 Experimental setup
A basic webcam embedded in a laptop (built-in iSight camera on a Macbook Pro
by AppleInc.) was used to record the videos for analysis. All videos
were recorded in color (24-bitRGB with 3 channels × 8 bits/channel)
at 15 frames per second (fps) with pixel resolution of 640 × 480 and
saved in AVI format on the laptop. 12 participants (10 males, 2
females) between the ages of 18-31 years were enrolled for this study
that was approved by theMassachusetts Institute of Technology
Committee On the Use of Humans as ExperimentalSubjects
(COUHES). The sample featured participants of both genders,
different ages andwith varying skin colors (Asians, Africans and
Caucasians). Informed consent was obtainedfrom all the participants
prior to the start of each study session.
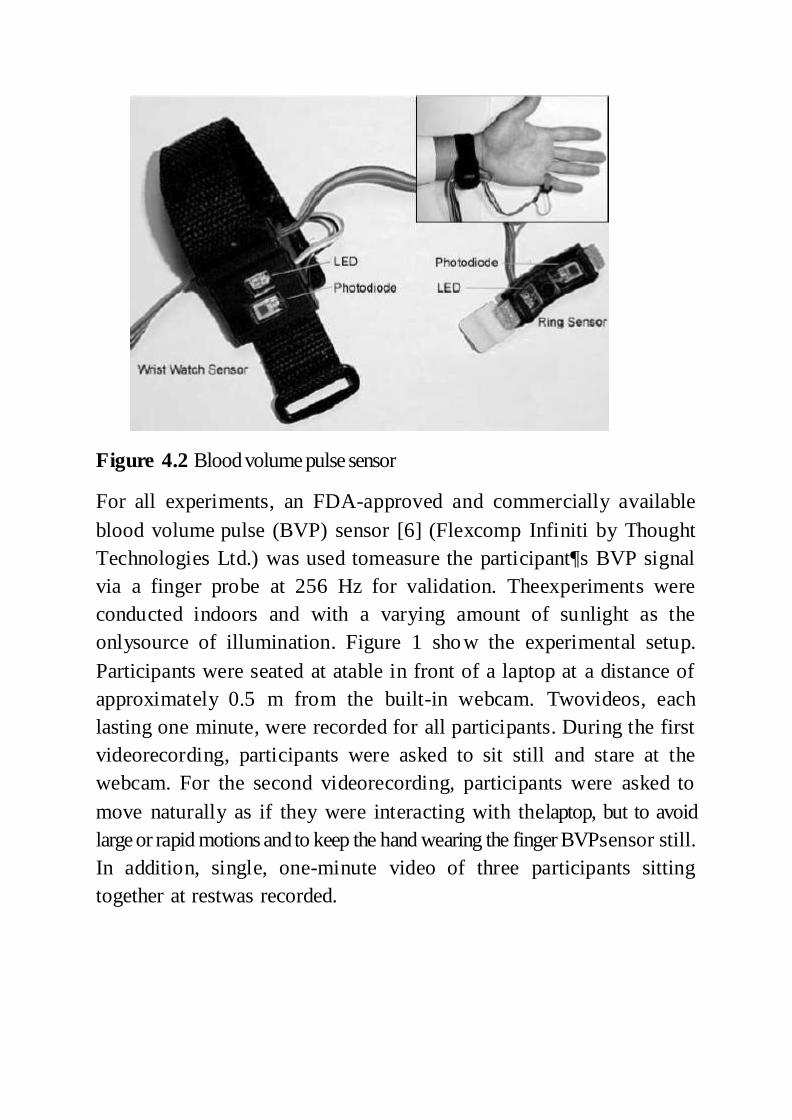
Figure 4.2 Blood volume pulse sensor
For all experiments, an FDA-approved and commercially available
blood volume pulse (BVP) sensor [6] (Flexcomp Infiniti by Thought
Technologies Ltd.) was used tomeasure the participant¶s BVP signal
via a finger probe at 256 Hz for validation. Theexperiments were
conducted indoors and with a varying amount of sunlight as the
onlysource of illumination. Figure 1 show the experimental setup.
Participants were seated at atable in front of a laptop at a distance of
approximately 0.5 m from the built-in webcam. Twovideos, each
lasting one minute, were recorded for all participants. During the first
videorecording, participants were asked to sit still and stare at the
webcam. For the second videorecording, participants were asked to
move naturally as if they were interacting with thelaptop, but to avoid
large or rapid motions and to keep the hand wearing the finger BVPsensor still.
In addition, single, one-minute video of three participants sitting
together at restwas recorded.
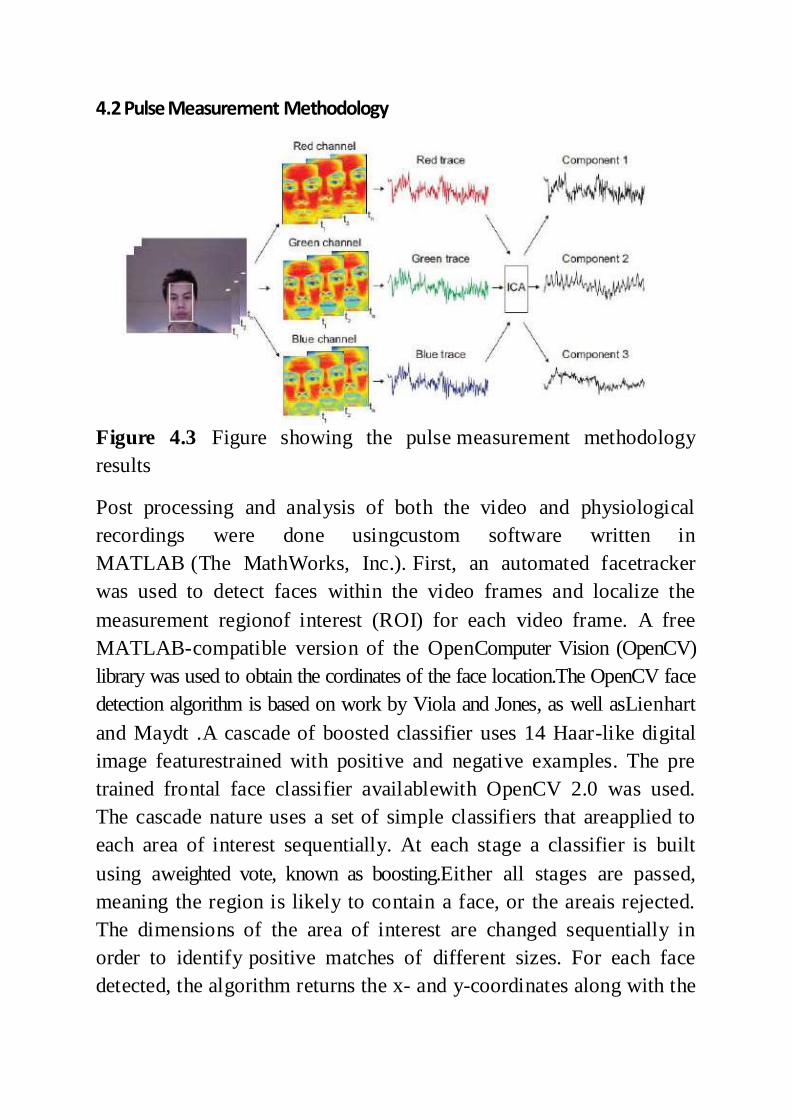
4.2 Pulse Measurement Methodology
Figure 4.3 Figure showing the pulse measurement methodology
results
Post processing and analysis of both the video and physiological
recordings were done usingcustom software written in
MATLAB (The MathWorks, Inc.). First, an automated facetracker
was used to detect faces within the video frames and localize the
measurement regionof interest (ROI) for each video frame. A free
MATLAB-compatible version of the OpenComputer Vision (OpenCV)
library was used to obtain the cordinates of the face location.The OpenCV face
detection algorithm is based on work by Viola and Jones, as well asLienhart
and Maydt .A cascade of boosted classifier uses 14 Haar-like digital
image featurestrained with positive and negative examples. The pre
trained frontal face classifier availablewith OpenCV 2.0 was used.
The cascade nature uses a set of simple classifiers that areapplied to
each area of interest sequentially. At each stage a classifier is built
using aweighted vote, known as boosting.Either all stages are passed,
meaning the region is likely to contain a face, or the areais rejected.
The dimensions of the area of interest are changed sequentially in
order to identify positive matches of different sizes. For each face
detected, the algorithm returns the x- and y-coordinates along with the

height and width that define a box around the face. From thisoutput,
the centre 60% width and full height of the box was selected as the
ROI for subsequent calculations. To prevent face segmentation errors
[7] from affecting the performance of our algorithm, the face
coordinates from the previous frame were used if nofaces were detected.
If multiple faces were detected when only one was expected, then our algorithm
selected the face coordinates that were the closest to the coordinates
from the previous frame.
The ROI was then separated into the three RGB channels and
spatially averaged over all pixels in the ROI to yield a red, blue and
green measurement point for eachframe andform the raw traces
X1(t),x2(t) and x3(t) respectively.. Subsequent processing
was performed using a 30 s moving window with 96.7% overlap (1 s
increment). The raw RGBtraces are normalized as follows:
𝑥(𝑡) −𝑋𝑖(𝑡)𝜇𝑖
𝜎𝑖
for each i =1,2,3 where i, 𝜇 and 𝜎 are the mean and standard deviation
of xi(t) respectively. The normalization transforms xi(t) to xi’(t)
which is zero-mean and hasunit variance.
4.3 Mean Mean is where you add up all the numbers and divide it by the
amount of numbers therewere. There are other statistical measures
that use samples that some people confuse withaverages - including
'median' and 'mode'. Other simple statistical analyses use measures
of spread, such as range, inter quartile range, or standard deviation.
For a real-valued randomvariable X , the mean is the expectation of X .
For a data set, the mean is the sum of the valuesdivided by the number
of values. The mean of a set of numbers x1, x2, ..., xn is
typicallydenoted by , pronounced " x bar". This mean is a type of
arithmetic mean. If the data set was based on a series of observations
obtained by sampling a statistical population, this mean istermed the
"sample mean" to distinguish it from the "population mean".The mean of an
image is the mean values of gray level values of all its pixels. The mean
is given by the formulae
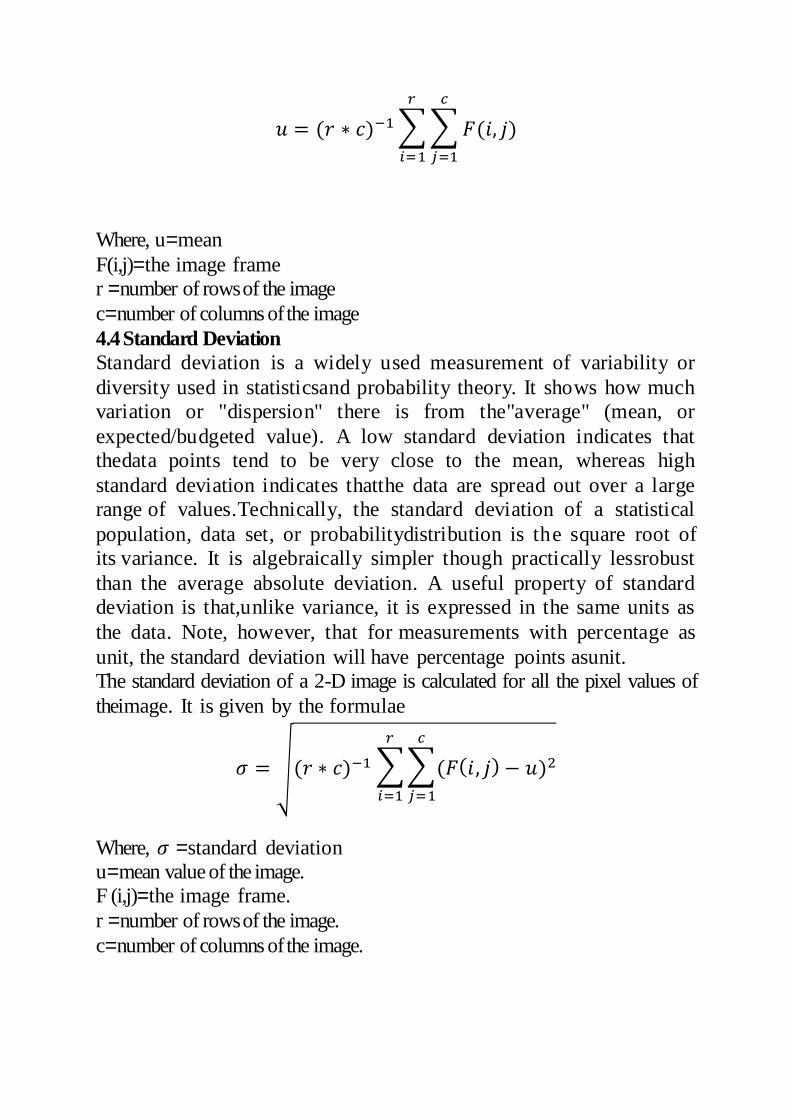
𝑢 = (𝑟 ∗ 𝑐)−1 ∑ ∑ 𝐹(𝑖, 𝑗)
𝑐
𝑗=1
𝑟
𝑖=1
Where, u=mean
F(i,j)=the image frame
r =number of rows of the image
c=number of columns of the image
4.4 Standard Deviation Standard deviation is a widely used measurement of variability or
diversity used in statisticsand probability theory. It shows how much
variation or "dispersion" there is from the"average" (mean, or
expected/budgeted value). A low standard deviation indicates that
thedata points tend to be very close to the mean, whereas high
standard deviation indicates thatthe data are spread out over a large
range of values.Technically, the standard deviation of a statistical
population, data set, or probabilitydistribution is the square root of
its variance. It is algebraically simpler though practically lessrobust
than the average absolute deviation. A useful property of standard
deviation is that,unlike variance, it is expressed in the same units as
the data. Note, however, that for measurements with percentage as
unit, the standard deviation will have percentage points asunit.
The standard deviation of a 2-D image is calculated for all the pixel values of
theimage. It is given by the formulae
𝜎 = √(𝑟 ∗ 𝑐)−1 ∑ ∑(𝐹(𝑖, 𝑗) − 𝑢)2
𝑐
𝑗=1
𝑟
𝑖=1
Where, 𝜎 =standard deviation
u=mean value of the image.
F (i,j)=the image frame.
r =number of rows of the image.
c=number of columns of the image.
Chapter 5Blind Signal Separation and FFT
5.1 Blind Source Separation The technique used for noise removal from physiological signals is
blind source separation(BSS) [8]. Typically, the observations are
acquired from the output of a set of sensors, whereeach sensor
receives a different combination of the source signals.Blind signal
separation, also known as blind source separation, is the separation of
aset of signals from a set of mixed signals, without the aid of
information (or with very littleinformation) about the source signals
or the mixing process. Blind signal separation relies onthe assumption
that the source signals do not correlate with each other. For example, thesignals
may be mutually statistically independent or decorrelated. Blind
signal separation thusseparates a set of signals into a set of other
signals, such that the regularity of each resultingsignal is maximized,
and the regularity between the signals is minimized i.e.
statisticalindependence is maximized. Because temporal redundancies
(statistical regularities in thetime domain) are "clumped" in this way
into the resulting signals, the resulting signals can bemore effectively
deconvolved than the original signals.There are different methods of
blind signal separation:
Principal components analysis
Singular value decomposition
Independent component analysis
Dependent component analysis
Non-negative matrix factorization
Low-Complexity Coding and Decoding
Stationary Subspace Analysis Here we will focus on BSS by Independent Component Analysis
The normalized raw traces are then decomposed into three
independent source signalsusing ICA [9]. In this report, we used the
joint approximate diagonalization of eigen matrices(JADE) algorithm
developed by Cardoso. This approach by tensorial methods uses fourth-order
cumulant tensors and involves the joint diagonalization of cumulant
matrices; thesolution of this approximates statistical independence of the
sources (to the fourth order).Although there is no ordering of the ICA
components, the second component typicallycontained a strong

plethysmographic signal. For the sake of simplicity and automation,
thesecond component was selected as the desired source signal.
5.2 Independent Component Analysis Independent component analysis (ICA) is a computational method for
separating amultivariate signal into additive subcomponents
supposing the mutual statisticalindependence of the non-Gaussian
source signals. It is a special case of blind sourceseparation.
When the independence assumption is correct, blind ICA
separation of a mixed signalgives very good results. It is also used for
signals that are not supposed to be generated by amixing for analysis
purposes. A simple application of ICA is the ³cocktail party
problem´,where the underlying speech signals are separated from a
sample data consisting of peopletalking simultaneously in a room.
Usually the problem is simplified by assuming no timedelays or
echoes. An important note to consider is that if N sources are present,
at least N observations (e.g. microphones) are needed to get the
original signals. This constitutes thesquare ( J = D, where D is the
input dimension of the data and J is the dimension of themodel). Other
cases of underdetermined ( J < D) and over determined ( J > D) have
beeninvestigated.ICA finds the independent components (aka factors,
latent variables or sources) bymaximizing the statistical independence
of the estimated components. We may choose one of many ways to
define independence, and this choice governs the form of the ICA
algorithms.The two broadest definitions of independence for ICA are
1) Minimization of Mutual Information
2) Maximization of non-Gaussianity
The Non-Gaussianity family of ICA algorithms, motivated by the
central limittheorem, uses kurtosis and negentropy. The
Minimization-of-Mutual information (MMI)family of ICA algorithms
uses measures like Kullback-Leibler Divergence and maximum-
entropy. Typical algorithms for ICA use centering, whitening (usually
with the eigenvaluedecomposition), and dimensionality reduction as
preprocessing steps in order to simplify andreduce the complexity of
the problem for the actual iterative algorithm. Whitening
anddimension reduction can be achieved with principal
component analysis orsingular valuedecomposition. Whitening
ensures that all dimensions are treated equally a priori before
thealgorithm is run. Algorithms for ICA include infomax, FastICA,
and JADE, but there aremany others also. In general, ICA cannot
identify the actual number of source signals, auniquely correct
ordering of the source signals, nor the proper scaling (including sign)
of thesource signals. ICA is important to blind signal separation and
has many practicalapplications. It is closely related to (or even a
special case of) the search for a factorial codeof the data, i.e., a new
vector-valued representation of each data vector such that it getsuniquely
encoded by the resulting code vector (loss-free coding), but the code
componentsare statistically independent. 5.2.1 Mathematical Definitions
Linear independent component analysis can be divided into noiseless
and noisy cases, wherenoiseless ICA is a special case of noisy ICA.
Nonlinear ICA should be considered as aseparate case.
The data is represented by the random vector x=(x1,... ...,xm) and the componentsas the random vector s=(s1,... ...,sm). The task is to
transform the observed data , using alinear static transformation W as s=Wx, into maximally independent components
S measured by some function F (s1,... ...,sm) of independence.
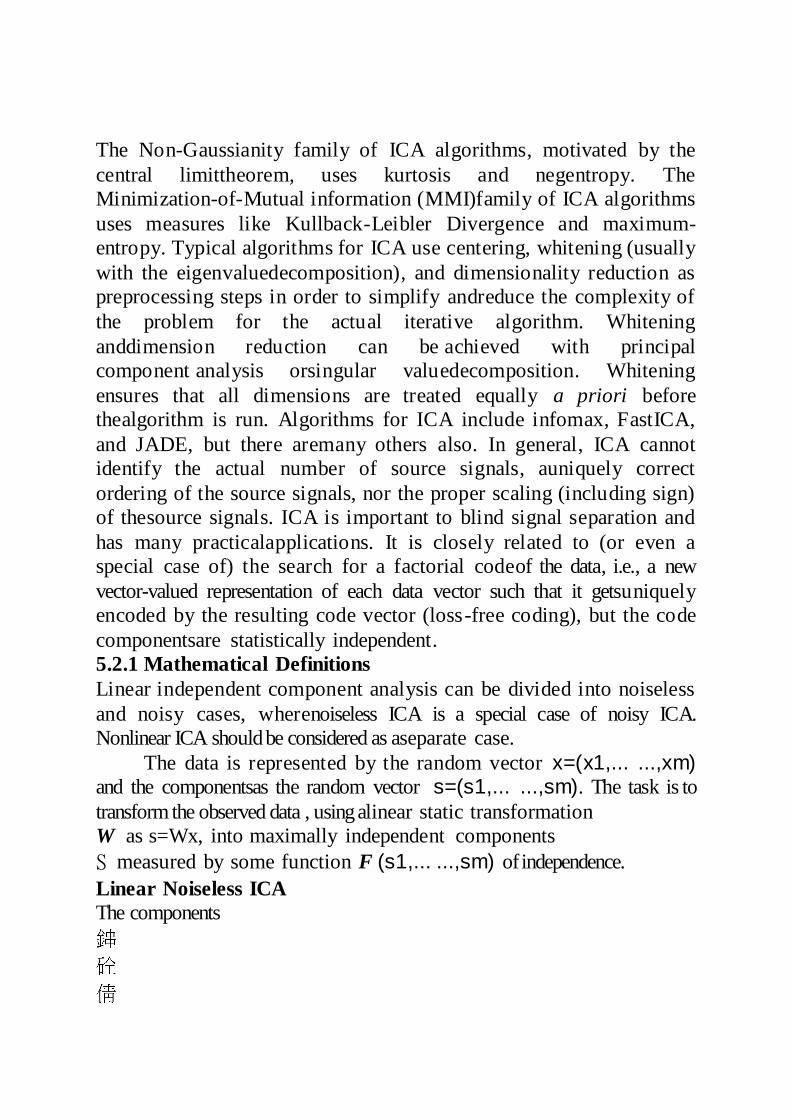
Linear Noiseless ICA The components

of the observed random vector
are generated as asum of the independent components
,
k=1,.....,n:
+
weighted by the mixing weights
. Linear Noisy ICA
With the added assumption of zero-mean and uncorrelated Gaussian
noisen, the ICA modeltakes the form
x=As+n
Identifiability The independent components are identifiable up to a permutation and scaling of
the sources.This identifiability [10] requires that:
At most one of the sources is Gaussian,
‡ The number of observed mixtures m, must be at least as large as the number
of estimated componentsn::m>=n. It is equivalent to say that the
mixing matrix A must be of full rank for its inverse to exist.
In this study, the underlying source signal of interest is the
cardiovascular pulse wavethat propagates throughout the body.
Volumetric changes in the facial blood vessels duringthe cardiac cycle
modify the path length of the incident ambient light such that
thesubsequent changes in amount of reflected light indicate the timing
of cardiovascular events.By recording a video of the faci al region
with a webcam, the RGB color sensors pick up amixture of the
reflected plethysmographic signal along with other sources of
fluctuations inlight due to artifacts such as motion and changes in ambient
lighting conditions. Given thathemoglobin absorptivity differs across the
visible and near-infrared spectral range, eachcolor sensor records
a mixture of the original source signals with slightly different
weights.These observed signals from the red, green and blue color
sensors are denoted by (t ), (t ) and (t ) respectively,
which are amplitudes of the recorded signals (averages of all pixels in
the facial region) at time pointt . In conventional ICA the number of
recoverablesources cannot exceed the number of observations, thus we
assumed three underlying sourcesignals, represented by

(t ), (t )and (t ). The ICA model assumes that the
observedsignals are linear mixtures of the sources, i.e.
for each i =1,2,3
This can be represented compactly by the mixing equation x(t )= As(t )
The column vectors
,
and thesquare 3 × 3 matrixA contains the
mixture coefficientsija. The aim of ICA is to find aseparating ordemixing
matrix that is an approximation of the inverse of the originalmixing matrixA whose output
sÖ(t )=Wx(t )
is an estimate of the vector s(t ) containing the underlying source signals.
According to thecentral limit theorem [11], a sum of independent
random variables is more Gaussian than theoriginal variables. Thus,
to uncover the independent sources,Wmust maximize the non-Gaussianity
of each source. In practice, iterative methods are used to maximize or minimize
agiven cost function that measures non-Gaussianity such as kurtosis,
negentropy or mutualinformation. finally we applied the fast Fourier transform (FFT) on the
selected source signal toobtain the power spectrum. The pulse
frequency was designated as the frequency thatcorresponded to the
highest power of the spectrum within an operational frequency
band.We set the operational range to [0.75, 4] Hz (corresponding to [45, 240]
bpm) to provide awide range of heart rate measurements. Similarly, we
obtained the reference heart ratemeasurements from the recorded
finger BVP signal.
5.3 FFT A fast Fourier transform (FFT) is an efficient algorithm to compute
the discrete Fourier transform (DFT) and its inverse. There are many
distinct FFT algorithms involving a widerange of mathematics, from
simple complex-number arithmetic to group theory and
number theory. A DFT decomposes a sequence of values into
components of different frequencies This operation is useful in many
fields (see discrete Fourier transform for properties andapplications of
the transform) but computing it directly from the definition is often

too slowto be practical. An FFT is a way to compute the same result
more quickly. Computing a DFT of N points in the naive way, using the
definition, takes O( )arithmetical operations, while an FFT can
compute the same result in only O( N log N )operations. The
difference in speed can be substantial, especially for long data sets
where N may be in the thousands or millions²in practice, the
computation time can be reduced byseveral orders of magnitude in
such cases, and the improvement is roughly proportional
to N /log( N ). This huge improvement made many DFT-based
algorithms practical; FFTs are of great importance to a wide variety of
applications, from digital signal processing and solving partial
differential equations to algorithms for quick multiplication of large
integers.
The most well known FFT algorithms depend upon the
factorization of N , but(contrary to popular misconception) there are
FFTs with O( N log N ) complexity for all N ,even for prime N . Many
FFT algorithms only depend on the fact that is at the primitive rootof
unity, and thus can be applied to analogous transforms over any finite field,
such asnumber-theoretic transforms. Since the inverse DFT is the same
as the DFT, but with theopposite sign in the exponent and a 1/ N factor, any
FFT algorithm can easily be adapted for it.An FFT computes the DFT
and produces exactly the same result as evaluating the DFTdefinition
directly; the only difference is that an FFT is much faster. (In the
presence of round-off error, many FFT algorithms are also much more
accurate than evaluating the DFTdefinition directly, as discussed
below.) Let x0, ...., x N -1 be complex numbers. The DFT isdefined by the
formula

Evaluating this definition directly requiresO( ) operations,
there are N outputs Xk ,and each output requires a sum of N terms. An
FFT is any method to compute the sameresults in O( N log N )
operations. More precisely, all known FFT algorithms require
( N log N ) operations (technically,O only denotes an upper bound),
although there is no proof that better complexity is impossible. To
illustrate the savings of an FFT, consider the count of complex
multiplications and additions. Evaluating the DFT's sums directly
involves N 2complex multiplications and N ( N í 1) complex additions
[of whichO( N ) operations can besaved by eliminating trivial operations
such as multiplications by 1. The well-known radix-2Cooley±Tukey
algorithm, for N a power of 2, can compute the same result with
only( N /2)log2 N complex multiplies (again, ignoring simplifications of
multiplications by 1 andsimilar) andN log2 N complex additions. In
practice, actual performance on moderncomputers is usually
dominated by factors other than arithmetic and is a complicated
subject, but the overall improvement from ( N 2) to (N logN ) remains.
5.4 Threshold BPM Selection
Despite the application of ICA in our proposed methodology, the
pulse frequencycomputation may occasionally be affected by noise
[12]. To address this issue, we utilize thehistorical estimations of the
pulse frequency to reject artifacts by fixing a threshold for maximum
change in pulse rate between successive measurements (taken 1 s
apart). If thedifference between the current pulse rate estimation and
the last computed value exceeded thethreshold (we used a threshold
of 12 bpm in our experiments), the algorithm rejected it andsearched
the operational frequency range for the frequency corresponding to
the next highest power that met this constraint. If no frequency peaks
that met the criteria were located, thenthe algorithm retained the
current pulse frequency estimation.

Chapter 6
Results
Figure 6.1 A person standing before the camera embedded mirror

Figure 6.2
Figure showing the raw traces
G trace
R trace
B trace
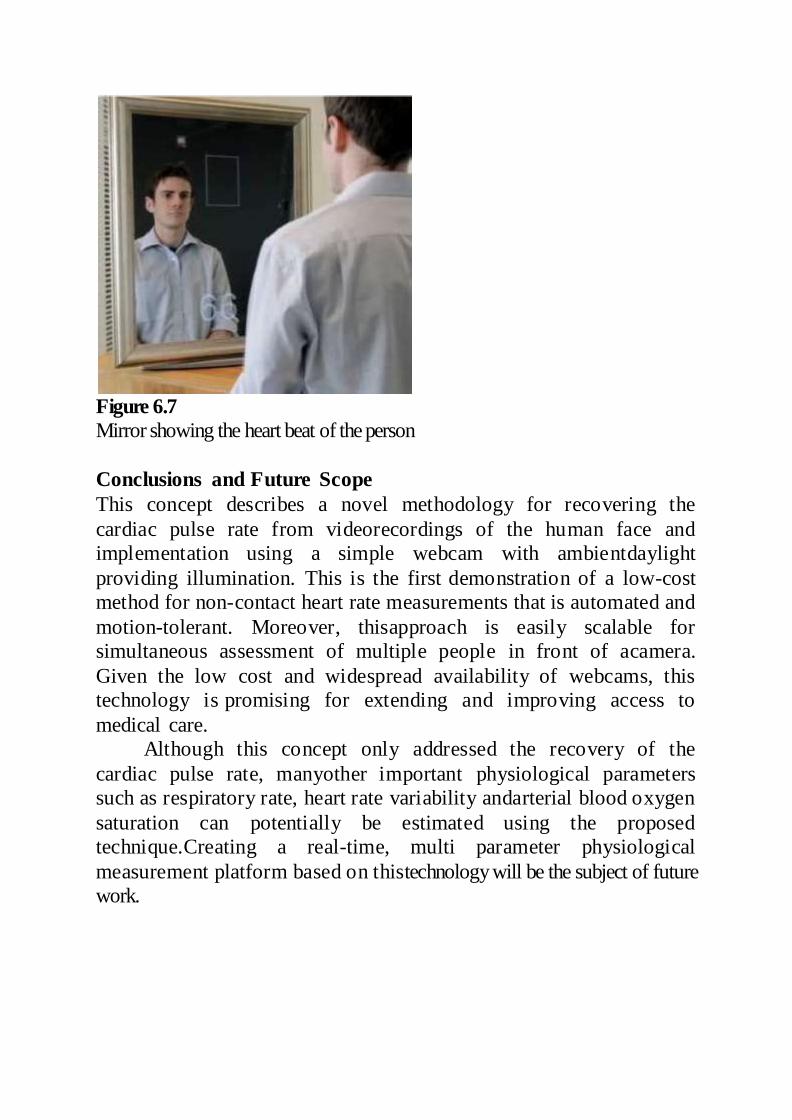
Figure 6.7 Mirror showing the heart beat of the person
Conclusions and Future Scope
This concept describes a novel methodology for recovering the
cardiac pulse rate from videorecordings of the human face and
implementation using a simple webcam with ambientdaylight
providing illumination. This is the first demonstration of a low-cost
method for non-contact heart rate measurements that is automated and
motion-tolerant. Moreover, thisapproach is easily scalable for
simultaneous assessment of multiple people in front of acamera.
Given the low cost and widespread availability of webcams, this
technology is promising for extending and improving access to
medical care.
Although this concept only addressed the recovery of the
cardiac pulse rate, manyother important physiological parameters
such as respiratory rate, heart rate variability andarterial blood oxygen
saturation can potentially be estimated using the proposed
technique.Creating a real-time, multi parameter physiological
measurement platform based on thistechnology will be the subject of future
work.