Embed Size (px)
Citation preview

Learning from the Care Quality Commission
Lisa Annaly, Head of Provider Analytics, Care Quality
Commission
Chair: Chris Sherlaw-Johnson, Senior Research Analyst,
Nuffield Trust

CQC’s learning from using data for monitoring quality
Lisa Annaly
Head of Provider Analytics (Hospitals)
Care Quality Commission
1 November 2016
Outline
1. About CQC and its approach to using intelligence in its work
2. CQC’s experience of using data for monitoring
a. Outliers programme for mortality
b. Quality and risk profiles
c. Intelligent monitoring
3. Developing the new Insight model
4 4
Our purpose
We make sure health and social care services provide people with safe, effective,
compassionate, high-quality care and we encourage care services to improve
Our role
We monitor, inspect and regulate services to make sure they meet fundamental
standards of quality and safety and we publish what we find, including
performance ratings to help people choose care
Intelligence Driven
Making better use of knowledge and information to support our purpose of
improving care and protecting the public
CQC’s Purpose and Role

CQC’s use of data for monitoring - timeline
Healthcare Commission
Developed a screening model mapping indicators to standards
Developed outliers programme for mortality – 2007
Quality & Risk Profiles (2010 – 2013) Brought together wide range of indicators mapped to 16 essential standards
Outliers programme continued – expanded to maternity
Intelligent Monitoring (2013 – 2016) Priority Tier 1 indicators based around key questions
Good for scheduling but less so for ongoing monitoring
Outliers built into Intelligent Monitoring outputs
CQC Insight
(2016- Bring together all information CQC holds in one risk model. Combining quantitative and qualitative data. Identifying sentinel indicators (outliers) to follow up directly as well as those that need routine monitoring as a theme.
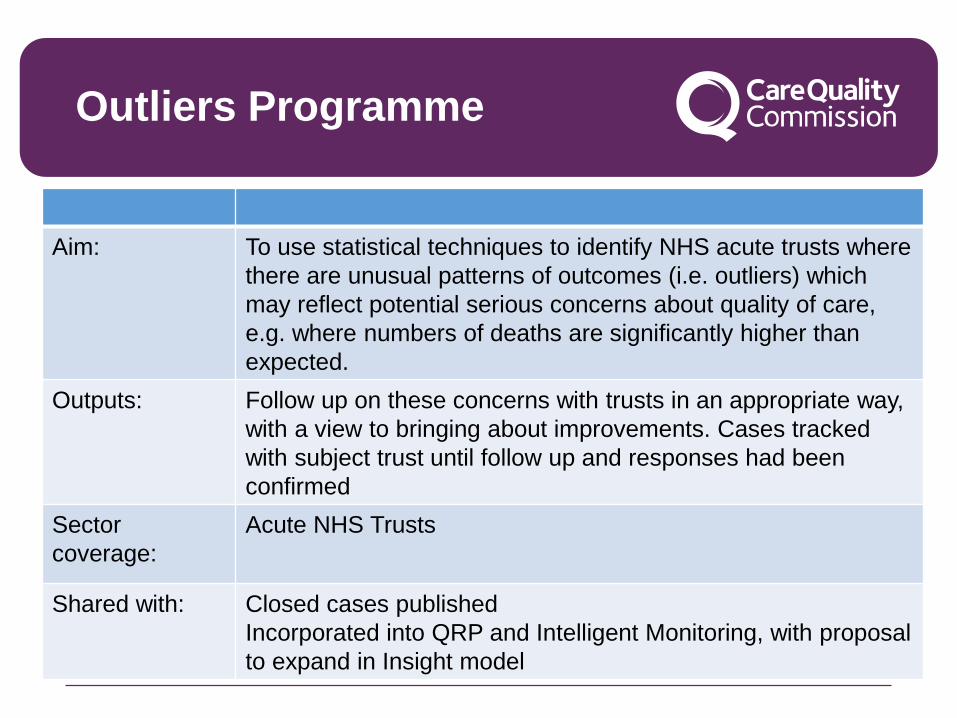
Outliers Programme
Aim: To use statistical techniques to identify NHS acute trusts where
there are unusual patterns of outcomes (i.e. outliers) which
may reflect potential serious concerns about quality of care,
e.g. where numbers of deaths are significantly higher than
expected.
Outputs: Follow up on these concerns with trusts in an appropriate way,
with a view to bringing about improvements. Cases tracked
with subject trust until follow up and responses had been
confirmed
Sector
coverage:
Acute NHS Trusts
Shared with: Closed cases published
Incorporated into QRP and Intelligent Monitoring, with proposal
to expand in Insight model

Example output
Cross-sectional analysis (funnel plot)
7

Quality and Risk Profiles
Aim: To bring together information about care providers so as to
estimate risk and prompt front line regulatory activity.
Prompts not judgments – that to be determined by inspection
evidence.
Intended to provoke questions not answers.
Iterative, used national data sources only to avoid any
information collection requirements on providers
Outputs: 16 ‘dials’ – constructed through a z-scoring model that enabled
comparison of a wide range of data sources – including
categorical and qualitative sources
Sector coverage NHS secondary services, Adult Social Care, Independent
Healthcare
Shared with NHS Trusts, central ALBs and PCTs/CCGs
Not published
9
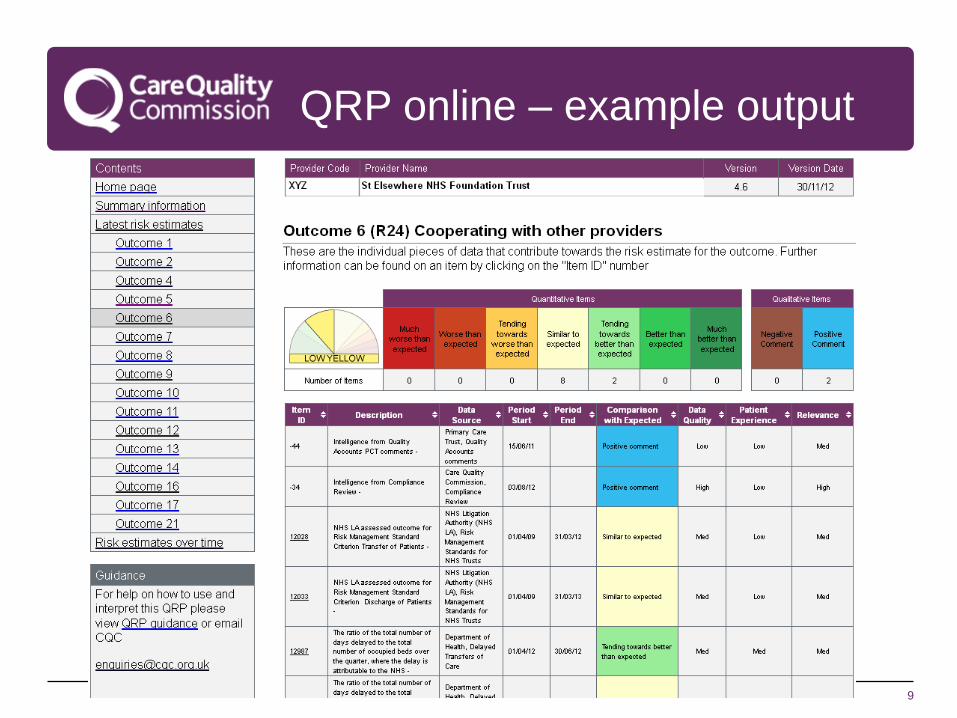
QRP online – example output

10
QRP – learning points (1)
1. Built on learning from Healthcare Commission, with a strong underpinning analytical method which enabled combinations of wide range of data
2. Provided comparative analysis for NHS Trusts and supported sharing of intelligence with national ALBs monitoring quality
3. Enabled direct contributions from inspection teams to ‘adjust’ risk levels
4. Positive support for QRPs from inspection teams for the data rich sectors (NHS trusts)
5. Good engagement from NHS Trusts with the acute QRP

11
QRP – learning points – (2)
1. Not enough focus within the tool- didn’t prioritise key information sources, despite a scoring methodology
2. 16 dials - not meaningful as a regulatory planning tool, over compartmentalised data
3. Older data sets only available for sectors with little national dataset development
4. Often viewed as an ‘analyst tool’ so didn’t get widespread engagement with inspection teams
5. Difficult to summarise overall concerns by sector
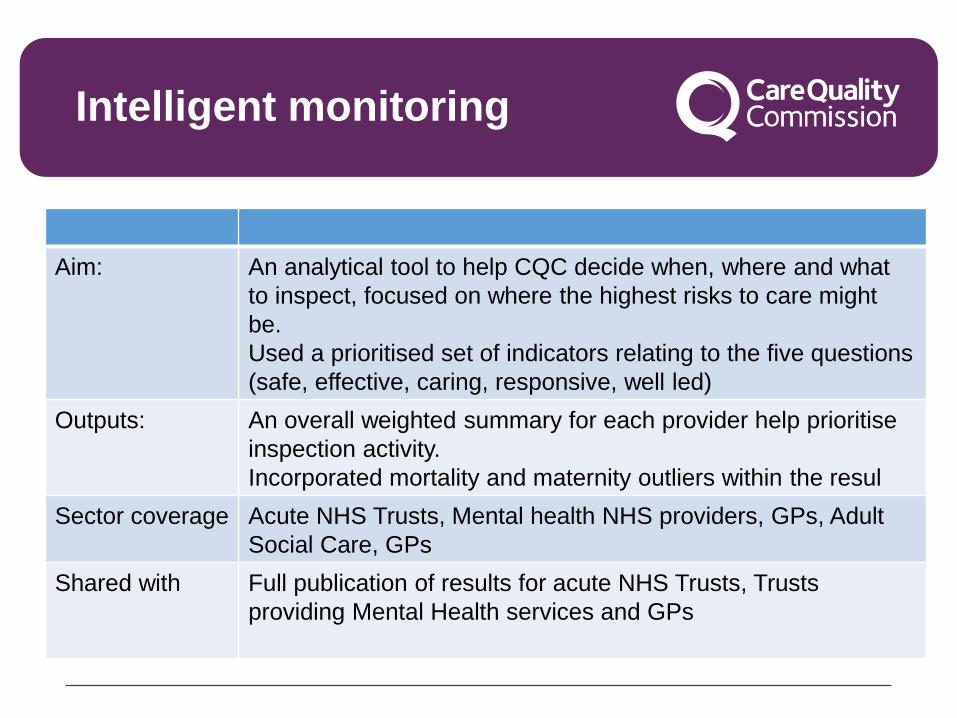
Intelligent monitoring
Aim: An analytical tool to help CQC decide when, where and what
to inspect, focused on where the highest risks to care might
be.
Used a prioritised set of indicators relating to the five questions
(safe, effective, caring, responsive, well led)
Outputs: An overall weighted summary for each provider help prioritise
inspection activity.
Incorporated mortality and maternity outliers within the resul
Sector coverage Acute NHS Trusts, Mental health NHS providers, GPs, Adult
Social Care, GPs
Shared with Full publication of results for acute NHS Trusts, Trusts
providing Mental Health services and GPs
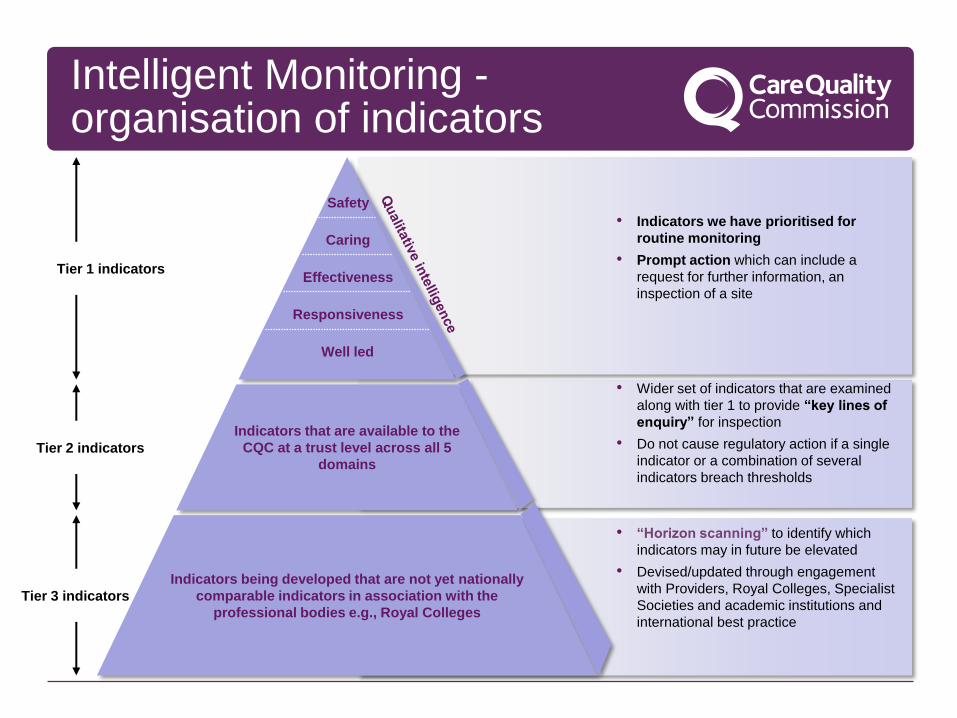
Intelligent Monitoring - organisation of indicators
• Indicators we have prioritised for
routine monitoring
• Prompt action which can include a
request for further information, an
inspection of a site
• Wider set of indicators that are examined
along with tier 1 to provide “key lines of
enquiry” for inspection
• Do not cause regulatory action if a single
indicator or a combination of several
indicators breach thresholds
• “Horizon scanning” to identify which
indicators may in future be elevated
• Devised/updated through engagement
with Providers, Royal Colleges, Specialist
Societies and academic institutions and
international best practice
Tier 1 indicators
Tier 2 indicators
Tier 3 indicators
Safety
Caring
Effectiveness
Well led
Responsiveness
Indicators that are available to the
CQC at a trust level across all 5
domains
Indicators being developed that are not yet nationally
comparable indicators in association with the
professional bodies e.g., Royal Colleges

14
Intelligent Monitoring – example output

Intelligent Monitoring – learning (Acute NHS Trusts) (1)
• Evaluation for all sectors is underway, but focusing on acute NHS trusts:
• Trusts which were in high risk bands (1 and 2) on Intelligent Monitoring almost all had very significant problems and were generally rated at the lower end of RI or Inadequate.
• However, some trusts in medium or low risk bands were found to have very significant problems
• Mortality indicators were prioritised for IM - high mortality (HSMR or SHMI) has almost always indicated significant problems.
• However, we haven’t observed the reverse, mortality that is within normal limits (or low) is not an indicator of ‘good’ quality. CQC has recommended special measures for around 15 trusts which did not have high mortality.
• Overall, a “high volume” IM indicator approach less successful in predicting ratings, than a subset of IM indicators which have a stronger correlation with ratings outcomes (10/90 indicators correlated)
15

Intelligent Monitoring – learning (Acute NHS Trusts) (2)
• IM and outliers outputs communicate a clear message: easy to understand, apply to scheduling decisions and to internal and external communications
• Presenting outlying indicators (IM and outliers) has prompted NHS trusts to investigate and address related quality issues
• Intelligence is more likely to be followed up where explicit processes and prompts are defined (e.g. outliers process)
• IM promoted common measurement with partners for some key questions (e.g. safety domain)
• Analyst resources have been high – particularly focused on the publication of IM

Where are we now…. New Insight model
Development of an Insight model to support how CQC monitors quality
• Builds on learning from previous use of information to monitor quality
• Purpose of insight - changes in measures of quality since CQC’s
inspection and rating
• Brings together information from different sources – including an
planned information collection from providers
• Presents information mapped to the key questions and by core services
and featured indicators
• Continues to work with some well known data challenges
• Being tested internally before determining external outputs, but will be
shared with providers where possible

Trust level rating:
Activity Previous Latest National comparison
Inpatient admissions 127,000 mm/yy-mm/yy
125,000 mm/yy-mm/yy
(-2%)
Outpatient attendances
533,000 mm/yy-mm/yy
534,000 mm/yy-mm/yy
(1%)
A&E attendances 135,000 mm/yy-mm/yy
135,500 mm/yy-mm/yy
(0%)
Number of deliveries - mm/yy-mm/yy
- mm/yy-mm/yy
(+/- %)
Number of deaths 800 mm/yy-mm/yy
860 mm/yy-mm/yy
(+/- %)
Date of inspection: <date> Date of publication: <date>
FACTS & FIGURES > TRUST LEVEL
ST ELSEWHERE NHS FOUNDATION TRUST
G O O RI O O
Responsive Caring Effective Safe Well-led Overall
Trust organisation history
Registered locations
• Location 1 • Location 2 • Location 3 • Location 4 • …………….. • …………….. • ……………… • ………………
• Formed <insert date>Gained foundation trust status on <insert date>.
• Covered by local authorities of <LA1, LA2,…,LA…>.
Source(s):
Population estimate: 450,000
Finance and governance Previous Latest National comparison
Projected surplus (deficit) in 16/17 n/a £9.1m
Turnover (£000s) n/a 687,657
NHSI financial special measures n/a No evident concerns
NHSI historical governance/escalation score n/a Intervention
Capacity Previous Latest National comparison
Number of beds (total): General and acute Maternity Critical care
953 844
77 32
mm/yy-mm/yy
940 844
77 32
mm/yy-mm/yy
(+3%) (0%) (0%) (+1%)
Number of bed days - mm/yy-mm/yy
- mm/yy-mm/yy
-
Number of staff (WTE ): Medical Nurses and health visitors Other(s)
5627 723
1637 3267
mm/yy-mm/yy
5627 723
1637 3267
mm/yy-mm/yy
(+/-%) (+/-%) (+/-%) (+/-%)
Care hours (Under development) - - -
• •
TRUST LOCATIONURGENT &
EMERGENCYMEDICAL CARE SURGERY CRITICAL CARE
MATERNITY &
GYNAECOLOGY
CHILDREN &
YOUNG PEOPLE
END OF LIFE
CARE
OUTPATIENTS &
DIAGNOSTIC IMAGINGRATINGS
FACTS, FIGURES & RATINGS INTELLIGENCE DEFINITIONS
Text from JS on estimation
<Date of publication>
18

Identifying key indicators….
• A “high volume” indicator approach was less successful in
demonstrating a relationship with ratings than a subset of indicators
which has a stronger correlation with quality ratings
• Inpatient and staff survey questions are among the strongest
• A composite of 12 indicators will be tested for monitoring potential
changes in quality
• Additional evaluation work is underway where quality ratings were
better or worse than the available intelligence to help improve the
use of information in our processes 19
• A&E wait time
• Ambulance wait time
• Cancelled operations
• Infectious disease in-hospital mortality
• Health worker flu vaccination
• Advice and support from midwife
• Treatment with respect and dignity
• Privacy, dignity, and well being
• Confidence and trust in doctors
• Good staff communication
• Open reporting culture
• Support from managers
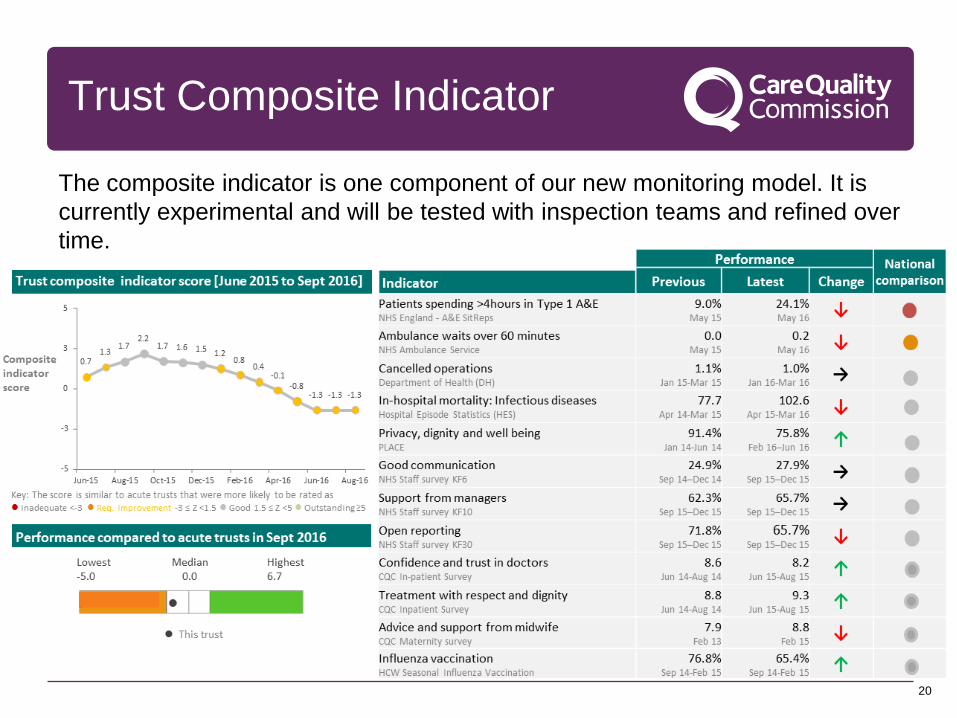
Trust Composite Indicator
20
The composite indicator is one component of our new monitoring model. It is
currently experimental and will be tested with inspection teams and refined over
time.

Recap
• CQC remains committed to being an intelligence driven
regulator
• Its new Insight model builds on learning from QRP and
intelligent monitoring experiences, with continuing
evaluation planned
• Outliers continue to be an important programme of work for
CQC
• Sharing outputs with the service is an important part of this
process to help drive improvement
• Publication of monitoring data from the regulator continues
to be complex

Questions?