Embed Size (px)
Citation preview

GLYCAN STRUCTURAL ANALYSIS THROUGHOUTBIOTHERAPEUTIC DEVELOPMENT
Dr Richard EastonTeam Leader Carbohydrate AnalysisTeam Leader, Carbohydrate Analysis
SGS Life Science ServicesWokingham, UK

What is glycosylation? What is glycosylation?
What aspects of glycosylation are key? What aspects of glycosylation are key?
H th b i ti t d? How can these be investigated?
2

N GLYCOSYLATIONN-GLYCOSYLATION
Attached to Asn in the consensus Attached to Asn in the consensus sequence …Asn-X-Ser/Thr…where X is any AA except Pro
Initiated in ER by en bloc transfer of a pre-formed lipid-anchored conserved glycan
Mature glycans formed by trimming (in ER and Golgi) and elongation (Golgi)
Found on mammalian, insect, fungal, bacterial and plant cell proteins
3

O GLYCOSYLATIONO-GLYCOSYLATION
Occurs on Ser and ThrOccurs on Ser and Thr
No consensus sequence but some “rules” eg nearby proline, tandem repeats of Ser/Thr
Initiated in Golgi by addition of a single sugar - usually GalNAc in mammals
Additi l dd d ti ll t f th Additional sugars are added sequentially to form the core sequence and then the antennae
Cores 1 & 2 are very common in many glycoproteinsy y g y p
Other monosaccharides may act as linkers depending on the protein structure eg O-linked Fucose in EGF domains
Cores 1 & 2 are very common in many glycoproteins
Found on mammalian, insect, fungal, bacterial and plant cells
4

MONOSACCHARIDE STRUCTURESMONOSACCHARIDE STRUCTURES
5

EUKARYOTIC N GLYCAN BIOSYNTHESISEUKARYOTIC N-GLYCAN BIOSYNTHESIS
6

IN YEAST HIGH MANNOSE GLYCANS ARE MADE LARGER BY POLYMANNOSYLATIONLARGER BY POLYMANNOSYLATION
7

PLANTS AND INVERTEBRATES DECORATE THEN-GLYCAN CORE IN MORE DIVERSE WAYS THAN MAMMALS
8

N-GLYCOSYLATION IN FISH AND BIRDSN-GLYCOSYLATION IN FISH AND BIRDS
some fish glycans are the mostdecorated of all known glycans
9
decorated of all known glycans

SELECTED MAMMALIAN N GLYCAN STRUCTURESSELECTED MAMMALIAN N-GLYCAN STRUCTURES
(i)(iii)
(ii)
ErythropoietinGlycodelin S
Gl d li A
(iv)
(v)+/-
(vi)
Glycodelin A
+/-
Tamm-Horsfall glycoprotein
M kidNeutrophil
10
Mouse kidney

O LINKED OLIGOSACCHARIDES CORES 1 AND 2O-LINKED OLIGOSACCHARIDES CORES 1 AND 2
11

ANALYSIS OF GLYCOPROTEINSANALYSIS OF GLYCOPROTEINS
12

ANALYSIS OF GLYCOPROTEINSANALYSIS OF GLYCOPROTEINS
13

ANALYSIS OF GLYCOPROTEINSANALYSIS OF GLYCOPROTEINS
14

ANALYSIS OF GLYCOPROTEINSANALYSIS OF GLYCOPROTEINS
15

ANALYSIS OF GLYCOPROTEINSANALYSIS OF GLYCOPROTEINS
16

ANALYSIS OF GLYCOPROTEINSANALYSIS OF GLYCOPROTEINS
17

ANALYSIS OF GLYCOPROTEINSANALYSIS OF GLYCOPROTEINS
18

ANALYSIS OF GLYCOPROTEINSANALYSIS OF GLYCOPROTEINS
19

ANALYSIS OF GLYCOPROTEINSANALYSIS OF GLYCOPROTEINS
20

MONOSACCHARIDE ANALYSIS – BOVINE FETUINO OS CC S S O U
Is my molecule glycosylated?
• Is the glycosylation N linked and if so what type (complex high mannose)?M-Scan Ltd.Sample: Fetuin standard
Job: 12849 Sample No: Acquired on: 29-Sep-2000 at 13:37:38 by:
100
%
FETST299 Scan EI+ 298
6.30e421.83
N-Acetylneuraminic acid
• Is the glycosylation N-linked and if so what type (complex, high mannose)?• Is there evidence of O-glycosylation?
Is there evidence of carbohydrate contamination coming through the process?
• High levels of glucose may indicate breakdown of, for example, gel filtration beads
100
0
%
FETST299 Scan EI+ 173
1.56e516.98
N-Acetyl
g g y , p , g
100
0
%
16.38 21.8317.13
FETST299 Scan EI+ 20411.32 Galactose
N-Acetylgalactosamine
yglucosamine
0
100
%
3.69e512.08
12.65 13.12
13.48 16.98 21.83
FETST299 Scan EI+
MannoseGalactose
Glucose
100
%
FETST299 Scan EI+ TIC
3.99e610.28
7.727.00
21.8311.32 12.08
11.4716.98
13.1212.65 13.50
Arabitol (IS)
21
8.00 10.00 12.00 14.00 16.00 18.00 20.00 22.00Time0
7.72

DMB SIALIC ACID ANALYSISDMB SIALIC ACID ANALYSIS
Neu5Ac Neu5Gc
Sialic acid reference panel
Neu5,9Ac2
Neu5,7Ac2
Neu5Gc9Ac
KDNReagentpeak
Neu5,7(8),9Ac3Gc
ReagentReagentpeak
22

PERMETHYLATIONPERMETHYLATION
Population analysis by MALDI MS Population analysis by MALDI-MS
Identification of glycan compositions and an initial assessment of the types of structures presentassessment of the types of structures present
Electrospray analysis
A determination of glycan antennae present in the sample through fragmentation of the glycans.
Identification of unwanted epitopes eg GalαGalp p g
GC-MS
Identification of monosaccharide linkages in the population
23

MALDI MS ANALYSIS OF N GLYCANSMALDI-MS ANALYSIS OF N-GLYCANS
Secretory glycoprotein
Antibody
24

FRAGMENTATION IN ELECTROSPRAY IONISATIONFRAGMENTATION IN ELECTROSPRAY IONISATION
O
OO O
CH2ORO
CH2OR
+OO O
OR OR OR ORH
H NA
A-type oxonium ion cleavage
HexNAcorSialic Acid
OCH2OR
+
O
OR OR
25
OR OR

NANOSPRAY MS/MS ANALYSIS (Q-TOF)NANOSPRAY MS/MS ANALYSIS (Q-TOF)
Fetuin permethylated N-glycansMS/MS 1791 ([M+2H]2+)
Consistent with the compositionNeuAc Hex HexNAc
NeuAc+ - methanol NeuAcHexHexNAc+ - methanol
344 2
MS/MS 1791 ([M+2H]2 ) NeuAc3Hex6HexNAc5
NeuAcHexHexNAc+100344.2
825.5
NeuAc+
%%376.2
793.5 1792.0
200 400 600 800 1000 1200 1400 1600 1800m/z0
26
200 400 600 800 1000 1200 1400 1600 1800

MS/MS OF THE SIGNAL AT M/Z 895 5MS/MS OF THE SIGNAL AT M/Z 895.5
298.2
CH2OMeCH2OMeMeOCH2
CH
CHNMeAc
CHOMe
CHOMe
OHC
CC
MeOCHH
H
C OH
OMeOC
MeOCH
H
COOMe
AcNMeC
CH
O
MeOCH
CHOMe
CH2OMe
OMeOCH
H
H
CHC
OMe
AcNMeC
620.3
520.3
376 2/398 2376.2/398.2
NeuAcHexHexNAcitol + Na+
27
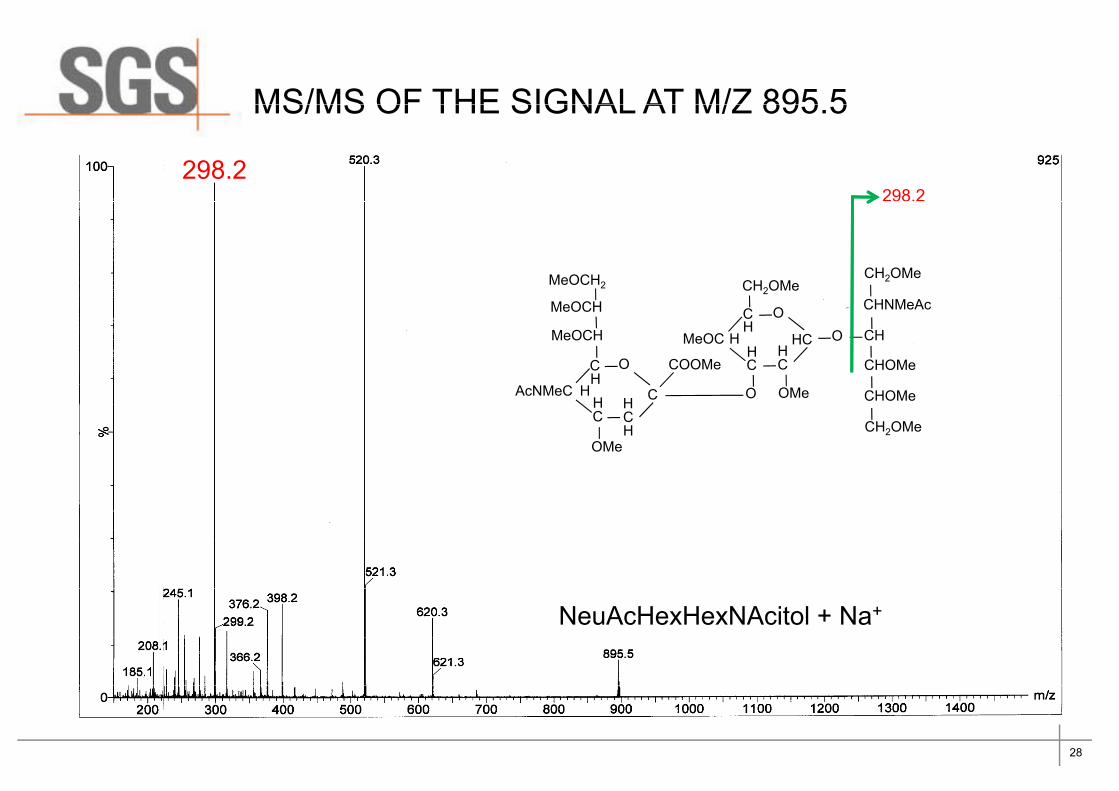
MS/MS OF THE SIGNAL AT M/Z 895 5MS/MS OF THE SIGNAL AT M/Z 895.5
298.2298.2
CH2OMeCH2OMeMeOCH2
CH
CHNMeAc
CHOMe
CHOMe
OHC
CC
MeOCHH
H
C OH
OMeOC
MeOCH
H
COOMe
AcNMeC
CH
O
MeOCH
CHOMe
CH2OMe
OMeOCH
H
H
CHC
OMe
AcNMeC
NeuAcHexHexNAcitol + Na+
28

MS/MS OF THE SIGNAL AT M/Z 1256.6
CH2OMe
CH
CHNMeAc
OC OH
CH2OMe
M OCH
MeOCH
MeOCH2
620.3
CH
CHOMe
CHOMe
CH
OHC
CC
MeOCHH
HH
OMeOC
MeOCH
H
H
H
COOMe
CHC
AcNMeC
CH
O
CH2HOMe
MeOCH
MeOCH2
881.5659.3376.2/398.2
OC
MeOCH
H
H
H
COOMe
CHC
AcNMeC
CH
O
284.2H
OMe 506.3
376.2/398.2
NeuAcHexHexNAcitol + Na+
29

MS/MS OF THE SIGNAL AT M/Z 1256.6
CH2OMe
CH
CHNMeAc
OC OH
CH2OMe
M OCH
MeOCH
MeOCH2
CH
CHOMe
CHOMe
CH
OHC
CC
MeOCHH
HH
OMeOC
MeOCH
H
H
H
COOMe
CHC
AcNMeC
CH
O
CH2HOMe
MeOCH
MeOCH2659.3
OC
MeOCH
H
H
H
COOMe
CHC
AcNMeC
CH
O
659.3 HOMe
659.3
NeuAcHexHexNAcitol + Na+
30

LINKAGE ANALYSIS
45 GC/EI-MS analysis – Spectrum of 1,2-linked Mannose
LINKAGE ANALYSIS
OAc
OAc
CH3O
CH2OCH3
H
45
H OAc
CH2OCH3
117
161306
129OAc
OCH3 OAc
D
H OCH3
H OCH3161
205190
234129
130
129
130
CHDOAc
H OAc 277
74
146
161 74
190
161
190
31

LINKAGE ANALYSIS
73 GC/EI-MS analysis – spectrum of 1,3,6-linked Mannose
LINKAGE ANALYSIS
OA
CH2OAc
73
H OAc
CH2OAc
145
189306
129
OAc
OAc
CH3OH
D H OAc
H OCH3189
261190
234118 129
OAc OCH3
CHDOAc
H OCH3305
74
118129
74
234
189
32

LINKAGE ANALYSIS
45 GC/EI-MS analysis – spectrum of 1,4-linked N-Acetylglucosamine
LINKAGE ANALYSIS
OAc
OAc
AcO
CH2OCH3
H
45
H OAc
CH2OCH3
117
189347
OAc
OCH3 NCH3Ac
D
OCH3H
H OAc 189
233203
275117
CHDOAc
H NCH3Ac305
74
159117
74
159
233
33

LINKAGE ANALYSISLINKAGE ANALYSIS
10016.752 117+118+129+159
3.33e6RT
4-GlcNAc
%
6 G l14.001
t-Gal
2-Man3-Gal
6-Gal
2,4-Man4,6-GlcNAc
10.000 11.000 12.000 13.000 14.000 15.000 16.000 17.000 18.000 19.000 20.000rt0
13.171
13.471 14.941
t-Gal3,6-Man
,
34

STEREOSPECIFICITY OF LINKAGE
3363.3
90
100
Voyager Spec #1=>SM3=>AdvBC(32,0.5,0.1)[BP = 2041.4, 4588]
681.5
Mixture of Gal1-3Gal1-4Gal1-3Gal (Mass 885Da)and Gal1-4GlcNAc1-3Gal1-4Glc (Mass 926 Da)Incubated with -Galactosidase
681.5
50
60
70
80
% In
tens
ity
926.7926.7
00
10
20
30
40
%
599.0 719.2 839.4 959.6 1079.8 1200.0Mass (m/z)
00
2728 6100
Voyager Spec #1=>SM3=>AdvBC(32,0.5,0.1)[BP = 1836.2, 4445]
885.5722 4
Mixture of Gal1-3Gal1-4Gal1-3Gal (Mass 885 Da)and Gal1-4GlcNAc1-3Gal1-4Glc (Mass 926 Da)885.5722 5 2728.6
60
70
80
90
100 722.4 and Gal1 4GlcNAc1 3Gal1 4Glc (Mass 926 Da)Incubated with -Galactosidase
885.5722.5
20
30
40
50
% In
tens
ity
35
599.0 719.2 839.4 959.6 1079.8 1200.0Mass (m/z)
00
10

2 AB STACKED CHROMATOGRAMS2-AB STACKED CHROMATOGRAMS
Five separate Mab N glycan preparationsFive separate Mab N-glycan preparations
G0F G1F G2FRun 1 0.59 0.32 0.09Run 2 0.58 0.32 0.09Run 3 0.59 0.32 0.09Run 4 0.58 0.33 0.09Run 5 0 58 0 32 0 09Run 5 0.58 0.32 0.09Average 0.584 0.322 0.09SD 0.0055 0.0045 0.00%CV 0.94 1.40 0.00
36

2 AB STACKED CHROMATOGRAMS2-AB STACKED CHROMATOGRAMS
Diff i t f M b tiDiffering amounts of Mab preparations
100μg
10μg
50μg
37

TAKE HOME MESSAGESTAKE HOME MESSAGES
Mass spectrometric analysis provides detailed structural information on composition, antennal structures and linkage.
Chromatography provides a unique glycan profile due to the precise structure and associated interactions of the glycans with the column
t i Thi fil b d f i t hi h thmatrix. This profile can be used as a reference against which other batches can be compared. Useful for characterisation, stability, forced degradation studies.
The use of LC/ES-MS of proteolytic digests allows sites of glycosylationto be isolated and identified. These sites can then be analysed using the b t h i t d t i th t f th l t h itabove techniques to determine the nature of the glycans at each site.
38

CARBOHYDRATES MAKE IT ON TV!CARBOHYDRATES MAKE IT ON TV!
39

THANK YOU FOR YOUR ATTENTIONTHANK YOU FOR YOUR ATTENTION
Life Science Services Dr Andrew J ReasonGroup Manager SGS M-Scan Europe
SGS M Scan Ltd Phone: +44 (0) 118 989 6940
Life Science Services Dr Richard EastonTeam Leader, Carbohydrate Analysis
SGS M S Ltd Ph 44 (0) 118 912 1190
+ 41 22 739 9548 SGS M-Scan Ltd Phone: +44 (0) 118 989 69402-3 Millars Business Centre, Fax: +44 (0) 118 989 6941Fishponds Close, E-mail : [email protected], RG41 2TZ, UK Web : www.sgs.com/biopharma
SGS M-Scan Ltd Phone: +44 (0) 118 912 11902-3 Millars Business Centre, Fax: +44 (0) 118 912 1191Fishponds Close, E-mail : [email protected] E-mail : [email protected], RG41 2TZ, UK Web : www.sgs.com/biopharma
+ 1 866 SGS 5003+ 65 637 90 111
+ 33 1 41 24 87 87 + 1 877 677 2667
40
1 877 677 2667

QUESTIONS ?QUESTIONS ?
41