Embed Size (px)
Citation preview

The £ for lb. Challenge: A lose – win – win scenario.
Results from a novel workplace-based, peer-led weight management programme in 2016
Dr Damien Bennett, Dr Declan Bradley, Angela McComb, Amy Kiernan, Dr Tracey Owen
IPH Conference

Obesity - public health priority Excess weight increases risk
- Early death
- Disability
- Diabetes
- Heart disease
- Stroke
- Osteoarthritis
- Cancer
- Depression and social isolation
Workplace – health promoting setting
Programmes targeting diet + physical activity - change behaviours + improve outcomes (e.g. BMI, blood pressure etc.)
Organization benefits
- ↓absenteeism
- ↑ productivity
- corporate image

Intervention • Peer (not professional) led – Work champions
• Workplace based
• Incentivised - £1 pledge to charity for every lb. weight loss
Foundation – NHS Choices 12-week guide, Losing weight: Getting Started
Training of Champions – Two workshops (start and mid-point) - BHSCT dietitian + physical activity professional

Programme Who? - Adults, BMI >25 kg/m2, not pregnant
How?
• Healthy eating, physical activity + behaviour change advice
• Recommended daily 600 kcal deficit diet - most participants
• Practical strategies - ↓calorie intake and ↑ physical activity
• Weekly weigh ins

Organisations • 35 organisations
• Across NI
• Private, public, third sector
• Wide variety of industries - Manufacturing, IT, Construction, Tourism, Academic, Public sector, Voluntary sector

Analysis Department of Health recommendations - Developing a specification for lifestyle weight management services: Best practice guidance for tier 2 services
Categories
Enrolled at baseline
Engaged - attended more than one session
Completed - attended any of last three sessions
Variables
Weight, BMI, Waist circumference, % bodyweight
Tests
Categorical – chi squared
Continuous – t-tests, Multivariate and logistical regression analysis

Results – participation + engagement
-
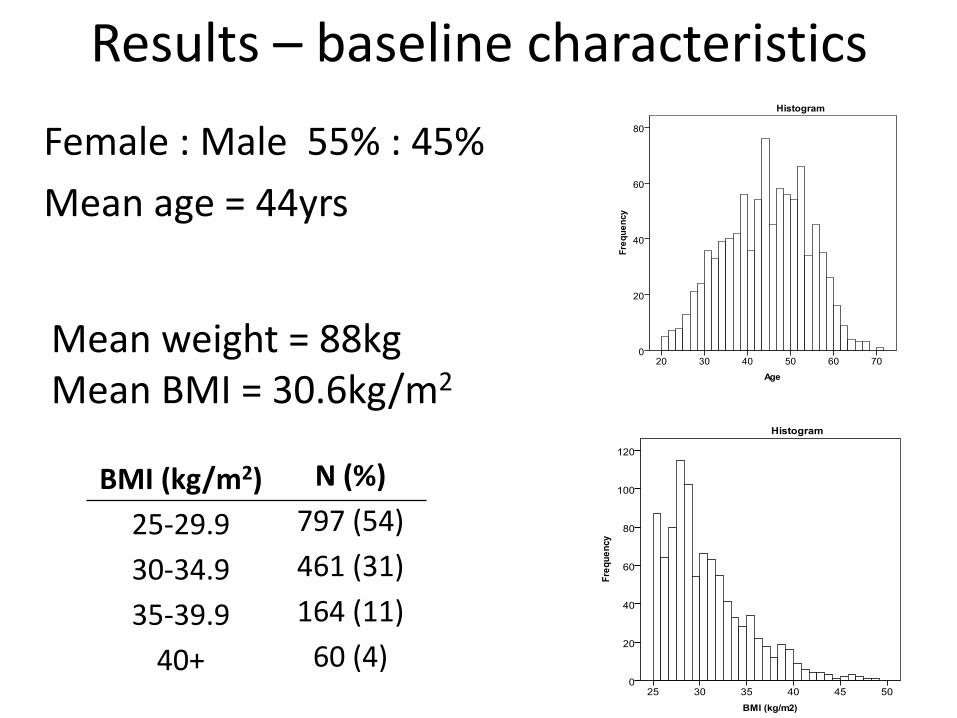
Results – baseline characteristics
Female : Male 55% : 45%
Mean age = 44yrs
Mean weight = 88kg Mean BMI = 30.6kg/m2
BMI (kg/m2) N (%)
25-29.9 797 (54)
30-34.9 461 (31)
35-39.9 164 (11)
40+ 60 (4)

Results - effectiveness 65% attended last session • Mean weight loss = 2.4kg (2.7%) • Mean BMI loss = 0.8 kg/m2 () • 24% lost ≥ 5% baseline weight
75% completed (i.e. attended at lease one of last 3 sessions) • Mean weight loss = 3.4kg (3.9%) • Mean BMI loss = 1.2 kg/m2 (3.9%) • 33% lost ≥ 5% baseline weight
Recommended targets (DoH “Developing a specification for lifestyle weight management service) • Average weight loss = 3% • 30% achieve ≥ 5% weight loss

Results - Weight change over programme duration
Highest in first week
Greater in first half
Slower in second half
-4
-3.5
-3
-2.5
-2
-1.5
-1
-0.5
0
0 1 2 3 4 5 6 7 8 9 10 11 12
Wei
ght
loss
(kg
)Week

Results - Weekly attendance
Declined uniformly until week 9 – 37%
Increased to finish at 65%
0
200
400
600
800
1000
1200
1400
1600
0 1 2 3 4 5 6 7 8 9 10 11 12
Att
end
ance
Week
65%
37%

Results – factors associated with weight loss
Gender
Men lost significantly more weight than women
(Average 3.3kg v 1.6kg, 3.4% v 1.9% bodyweight)
Gender Participants Mean Weight Change (kg)
Mean Bodyweight Change (%)
Female 707 -1.6 -1.9
Male 579 -3.3 -3.4
Gender unknown
227 -2.5 -2.8
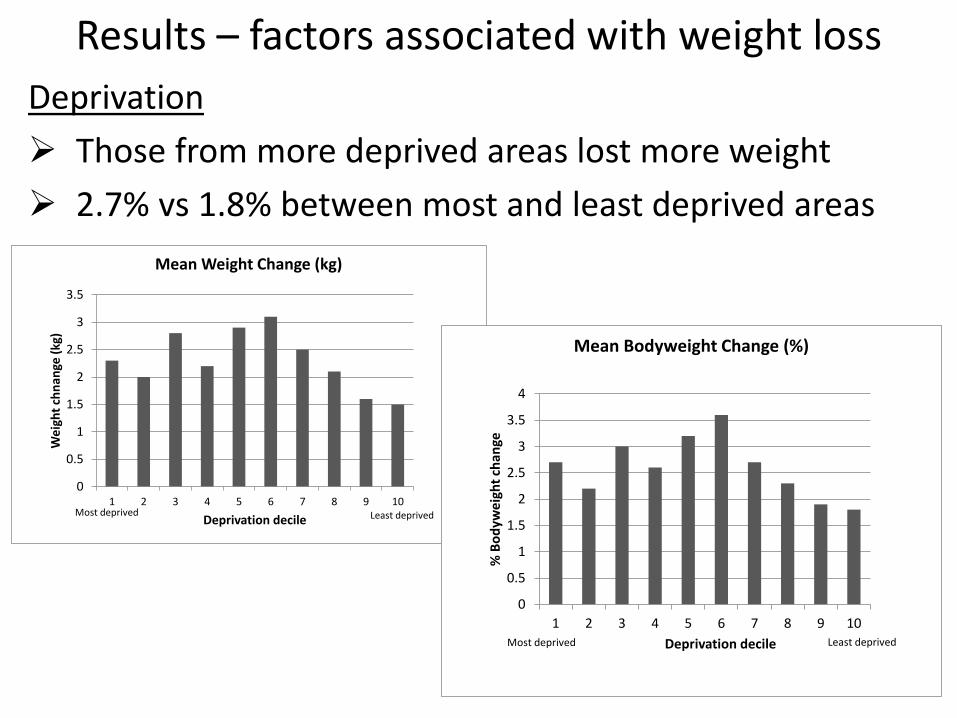
Results – factors associated with weight loss
Deprivation
Those from more deprived areas lost more weight
2.7% vs 1.8% between most and least deprived areas
0
0.5
1
1.5
2
2.5
3
3.5
1 2 3 4 5 6 7 8 9 10
We
igh
t ch
nan
ge (
kg)
Deprivation decile
Mean Weight Change (kg)
Most deprived Least deprived
0
0.5
1
1.5
2
2.5
3
3.5
4
1 2 3 4 5 6 7 8 9 10
% B
od
ywe
igh
t ch
ange
Deprivation decile
Mean Bodyweight Change (%)
Most deprived Least deprived
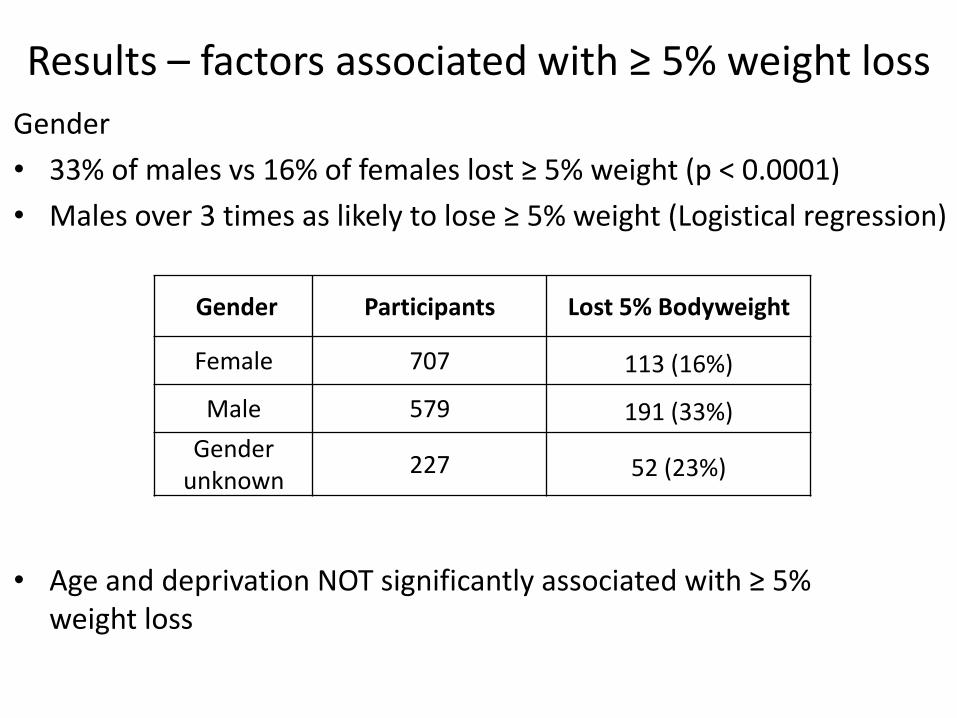
Results – factors associated with ≥ 5% weight loss
• Age and deprivation NOT significantly associated with ≥ 5% weight loss
Gender Participants Lost 5% Bodyweight
Female 707 113 (16%)
Male 579 191 (33%)
Gender unknown
227 52 (23%)
Gender
• 33% of males vs 16% of females lost ≥ 5% weight (p < 0.0001)
• Males over 3 times as likely to lose ≥ 5% weight (Logistical regression)

Lose – win – win • LOSE – Av 2.4kg loss,
24% > 5% weight loss • WIN – physical + mental
health benefits • WIN – productivity boost • WIN – positive corporate
image • WIN - £17,000 - NI
charities
BOUNS
Male participants:
- over twice as likely to complete
- three times more likely to lose ≥ 5% weight
Participants from more deprived areas lost greater % weight
The End