Embed Size (px)
Citation preview

Biomarkers activity and the effect of NT-proBNP guided therapy in high risk patients with chronic heart failure after
acute decompensation
D. Koshkina, A. Skvortsov, V. Protasov, O. Narusov, V. Masenko, S.
Tereschenko
Russian Cardiology Research and Production Complex, Moscow, Russian Federation
Sevilla-2015


Purpose of the study
to evaluate the change of the biomarkers concentration in the group of heart failure (HF) therapy guided by NT-proBNP versus standard treatment of CHF patients at high risk after acute decompensation

103 hospitalized pts with ADHF III-IV FC NYHA and LV EF < 40% due to coronary artery disease, arterial hypertension and dilated cardiomyopathy.
NT-proBNP-guided group
(n=35)
Group of standard therapy
(n=35)
• The goal of treatment was to reduce NT-proBNP concentration < 1000 pg/ml, or at least 50% of the initial Active therapy (up-titration) – 6 months, mean follow-up - 10±2,5 months
• Blood sampling to determine the biomarkers concentrations (NT-proBNP, soluble ST2 receptor, copeptin, galectin-3, high sensitive Troponin T and NGAL) were collected at discharge from the hospital, and 3 and 6
months after.
• Filling pressure was assessed by E/E’
• The primary end point - total cardiovascular events: cardiovascular (CV) death, hospitalization due to HF, and episodes of HF deterioration needed additional i/v diuretics
“High risk” group, at discharge NT-proBNP >1400pg/ml, n=70 (randomized 1:1)
“Low risk”, at discharge NT-proBNP <1400pg/ml, n=33
*Uncomplaining group (protocol demands)
(n=10)
2 8

Baseline characteristics for “high risk” HF patients
CharacteristicsNT-proBNP-guided
group (n=31) Standard therapy
group(n=26)Uncomplaining group (protocol demands)(n=10)
P*
Male, n (%) 20 (64,5) 22 (84,6) 8(80%) 0,063Age (years) 63,3±8,7 64,1±12,7 60,1±8,7 0,64Cause of HF: CAD, n (%) 21 (67,7) 18 (69,2) 8(80,0%) 0,76 DCMP, n (%) 4 (11,4) 6 (23,1) 1(10,0%) 0,49 Hypertension, n (%) 6 (19,4) 2 (7,7) 1(10,0%) 0,41DM type 2, n (%) 8 (25,8) 8 (30,8) 4(40,0) 0,69
Post MI, n (%) 21 (67,7) 17 (65,4) 8(80,0) 0,69
CRT-D, n (%) 4 (12,9) 4 (15,4) 1(10,0) 0,9
AF, n (%) 14 (45,2) 15 (57,7) 3(30,0) 0,3
LV EF (%) 29,4±5,9 29,6±6,2 33,9±5,8 0,84
Creatinine (µmol/L) 101,54±28,02 104,2±33,1 100,7±30,3 0,16
Systolic BP (mmHg) 114,6±5,4 111,4±8,0 111,5±6,4 0,34
NT-proBNP (discharge) (pg/ml) 3651,0 (2196,0; 6613,0)
2801,0 (2108,0; 4833,0)
3158,0 (1847,0;8154,0)
0,32

Baseline concentration of biomarkers in patients with CHF in «high risk» group and «low risk» group at discharge
801
NT-proBNP
0
500
1000
1500
2000
2500
3000
3500
80
12.1
28.4 31.3
39.5
67
12.5
21.414.1
22.3
NGAL Galectin-3 hsTpT Copeptin sST2
0
10
20
30
40
50
60
70
80
90
High risk group Low risk group 0
3000
2500
2000
1500
1000
100
3208(ng/ml) (pg/ml)
p < 0.05 for all biomarkers except Galectin-3

Medication mean dosages at baseline (mg)
6,48,0
2.9
32.7
64.4
15.6
0.135.2 7,0 3.3
29.5
51.4
16.7
0.145 4 3.1
35
90
17.9
0.08
ACE-i ARB Beta-blocker MRA Torasemide Furosemide Digoxin
0
20
40
60
80
100
NT-proBNP-guided group Standard therapy group Uncomplaining group
(mg)
ACE-i- Enalapril, Perindopril, Fosinopril ARB- Candesartan, Valsartan, Losartan Beta-blocker- Bisoprolol, Metoprolola succinate, Carvedilol MRA- Spironolactone, Eplerenone
(n=31) (n=26) (n=10)

Medication mean dosages after 6 months of treatment (mg)
19.223.5
8.5
44.6
55.6
11.2
0.09
15.4 18
7,0
35.3
72,0
18.5
0.13
7.90
4.1
35.7
80
18.6
0.13
ACE-i ARB Beta-blocker MRA Furosemide Torasemide Digoxin0
10
20
30
40
50
60
70
80
90
NT-proBNP-guided group (n=31) Standard therapy group (n=26) Uncomplaining group (n=10)
mg
р=0,0001р=0,0001 р=0,017

NT-proBNP values changes after 6 months of treatment
Δ% NT-proBNP
NT-proBNP-guided group (n=31)Standard therapy group(n=26)Uncomplaining group(n=10)
-53.1
-11.1
17.3
-60
-50-40
-30
-20-10
0
1020
30
р=0.001
NT-proBNP, pg/ml
Baseline 6 month
р=0,001
р=0,036
р=0,018
p=0,0001
Uncomplaining group(n=10)
NT-proBNP-guided group
(n=31)
Standard therapy group(n=26)
3651
1585
NT-proBNP value after 6 months of treatment
≥ 50% = 78% and < 1000 pg/ml = 30%
in NT-proBNP-guided group pts

Change of copeptin concentration in high risk patients with CHF during follow-up
Copeptinpmol/l
p=0,0001
23,5
34,632,1
30,7
53,7
34,3
Uncomplaining group(n=10)
NT-proBNP-guided group (n=31)
Standard therapy group(n=26)
Baseline6 month

sST2Galectin-3
Change of concentration of fibrosis and inflammation biomarkers in high risk patients with CHF during follow-up
Ng/
ml
11,8
9,2
12,211,6 12,2
14,2
p=0,0001
Uncomplaining group(n=10)
NT-proBNP-guided group
(n=31)
Standard therapy group(n=26)
Исходно 6 месяцев
Baseline 6 month
Uncomplaining group(n=10)
NT-proBNP-guided group
(n=31)
Standard therapy group(n=26)
Baseline 6 month
Ng/
ml
38,4
22,9
39,730,9
45,3
70,8p=0,0001 p=0,023
p=0,043p=0,0001

Change of concentration of cellular damage biomarkers in high risk patients with CHF during follow-up
Pg/m
l
NGALhsTroponin T
p=0,003
Ng/
ml
29,3
21,8 24,9 22,331,5
49,5
Uncomplaining group(n=10)
NT-proBNP-guided group
(n=31)
Standard therapy group(n=26)
Baseline 6 month
NT-proBNP-guided group
(n=31)
p=0,001
85,277,1 75,6
77,1
83,0
132,0
Uncomplaining group(n=10)
Standard therapy group(n=26)
Baseline 6 month

Correlations between sST2 and Copeptin concentration changes and changes of LV EF and LV filling pressure during follow-up
(n=103)r=-0.552; p<0,001
r=-0.722p<0,001
∆% S
T2
∆% LV EF
∆% C
opep
tin
∆% LV EF
r=0.573p<0,001
∆% ST2
∆% Е
/Е’
r=0.692p<0,001
∆% Copeptin
∆% Е
/Е’
r = 0,536p<0,001
∆% Е
/Е’
∆% NT-proBNP

Correlations between biomarkers concentration changes and changes of the main patients clinical and
functional parameters
Biomarkers (n=103) Δ% FC NYHA Δ% 6-minWT Δ% MLQHF Δ% LV EF Δ% Е/Е'
Δ% NT-proBNP ,517*** -0,672*** ,606*** -,630*** ,536***
Δ% sST2 ,518*** -,529*** ,579*** -,552*** ,573***
Δ% Copeptin ,475*** -,581*** ,717*** -,722*** ,692***
Δ% hsTnT ,252 -,318* ,552*** -,244 ,219
Δ %Galectin-3 ,470** -,392*** ,397*** -,392*** ,401*
Δ% NGAL ,278* -,283* ,355*** -,173 ,114

NT-proBNP group(n=31)
Standard therapy group (n=26)
“Low risk” group (n=32)
Uncomplaining group (n=10)
Total number and frequency (%) of CV events in HF patients during the study period (10,5±2,1months)
32
107
140
22
0
2040
6080
100
120140
160
p=0.01(%)
CV outcomes, %
10
28
14
7
0
5
10
15
20
25
30
p=0.016
Eve
nts n
umbe
r
CV outcomes

24 4
0
43
9
14
1
10
2
79
03
13 4
02
0
5
10
15
HF worsening without
hospitalization
1-st HF hospitalization
All HF hospitalizations
Successful resuscitation
CV death
р=0,001
р=0,018
р=0,025
7 13 130
1312
34
54
3
38.520
70
90
0
30
3 9 130 6
0
25
50
75
100 р=0,001р=0,018
р=0,025
Freq
uenc
y, %
Eve
nts n
umbe
r
NT-proBNP group(n=31) Standard therapy group (n=26) Uncomplaining group (n=10)“Low risk” group (n=32)
Cardiovascular outcomes
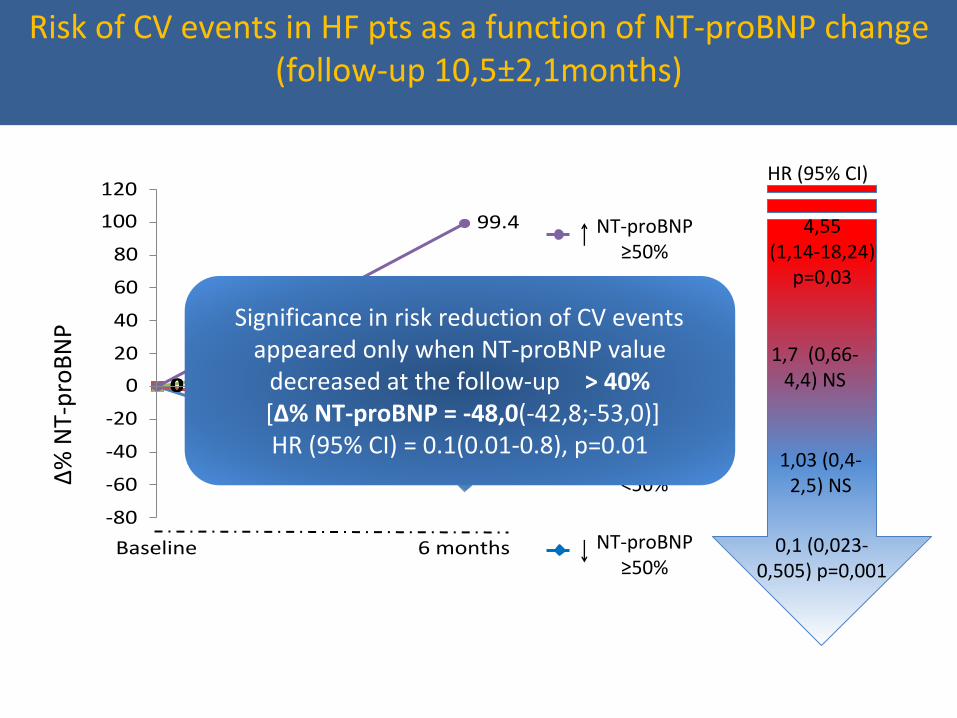
Risk of CV events in HF pts as a function of NT-proBNP change(follow-up 10,5±2,1months)
0000
99.4
Baseline 6 months-80
-60
-40
-20
0
20
40
60
80
100
120
NT-proBNP <50%
NT-proBNP <50%
NT-proBNP ≥50%
NT-proBNP ≥50%
4,55(1,14-18,24)
р=0,03
1,7 (0,66-4,4) NS
1,03 (0,4-2,5) NS
0,1 (0,023-0,505) р=0,001
HR (95% CI)
Δ% N
T-pr
oBN
P Significance in risk reduction of CV events appeared only when NT-proBNP value
decreased at the follow-up > 40% [∆% NT-proBNP = -48,0(-42,8;-53,0)]HR (95% CI) = 0.1(0.01-0.8), р=0.01

Risk of CV events in HF pts as a function of ST2 change (follow-up 10,5±2,1months)
0000
48.1
Baseline 6 months-50-40-30-20-10
0102030405060
ST2<25%
ST2<25%
ST2≥25%
ST2≥25%
1,13(0,95-1,35)
р=0,2
1,55 (1,1-2,2)
p=0,006
0.94 (0,24-3,65) p=1,0
0,1 (0,02-0,5) р=0,004
HR (95% CI)
Δ% S
T2

1.0
0.8
0.6
0.4
0.2
0.0
Sens
itivi
ty
1-Specificity0.0 0.2 0.4 0.6 0.8 1.0
∆%ST2 = - 24,9%
ST2 ≥ 25%HR (95% CI) = 0.1 (0.02-0.5), p=0.004
AUC= 0.8, р=0.002Sensitivity 82,4%Specificity 66,7%
Optimal value ST2 change for risk reduction of CV events in HF pts (follow-up 10,5±2,1months)

Conclusion
In NT-proBNP-guided therapy group was found more significant reduction of concentrations of biomarkers, especially sST2 and copeptin compared with standard HF therapy and change of these biomarkers were closely associated with the filling pressure decrease
NT-proBNP-guided therapy was superior to standard therapy in reduction of CV mortality and HF hospitalization
Declaration of interest-no