Embed Size (px)
Citation preview

Clinical Involvement
July 2015

Alfred Health
• 3 hospitals: The Alfred; Caulfield Hospital & Sandringham Hospital
• Located in central Melbourne
• $1B million per annum
• Around 900 beds; 100,000 ED presentations, 95,000 inpatient events; 162,000 outpatient attendances.
• Approximately 5000 equivalent-full-time staff made up by around 8600 people including 700 senior medical staff (200 FT and 500 PT), around 750 junior medical staff and approximately 300 nurses

• Tertiary and Quaternary provider of: – Heart and lung transplantation – cystic fibrosis – major trauma – burns – HIV/AIDS – Allogeneic bone marrow transplantation – Hemophilia – Sexual Health – Hyperbaric medicine – Psychiatric intensive care
• Home to one of the busiest emergency and trauma centres in the country,
The Alfred also has one of the largest and most advanced intensive care units in the region.
Service Profile

The Alfred

• https://www.youtube.com/watch?v=qt-OV2I7vzI
6
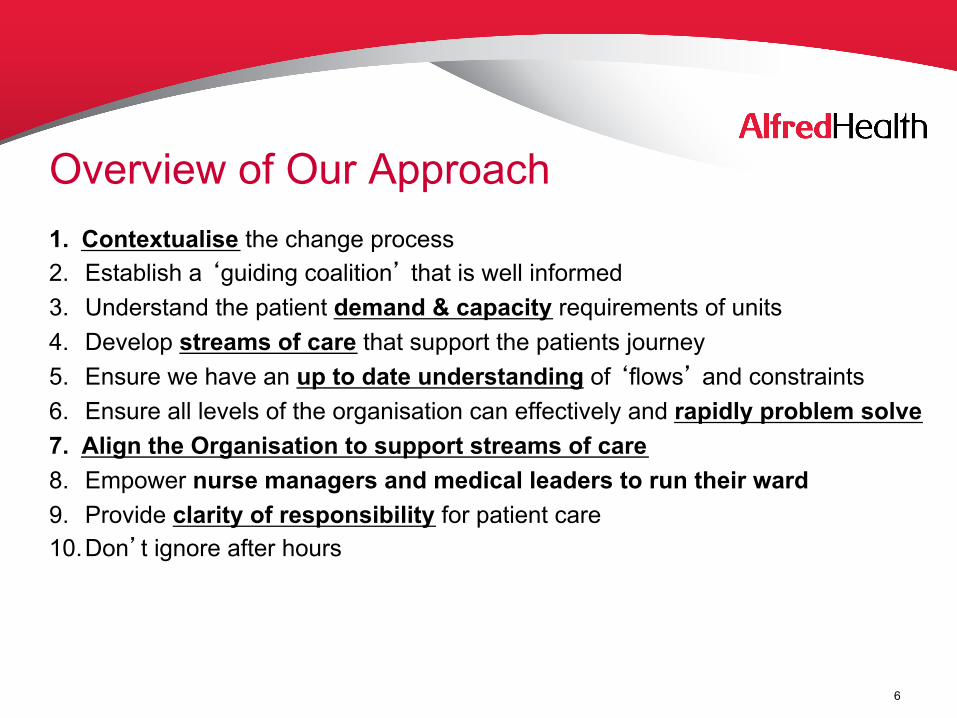
Overview of Our Approach 1. Contextualise the change process 2. Establish a ‘guiding coalition’ that is well informed 3. Understand the patient demand & capacity requirements of units 4. Develop streams of care that support the patients journey 5. Ensure we have an up to date understanding of ‘flows’ and constraints 6. Ensure all levels of the organisation can effectively and rapidly problem solve 7. Align the Organisation to support streams of care 8. Empower nurse managers and medical leaders to run their ward 9. Provide clarity of responsibility for patient care 10. Don’t ignore after hours

“Timely Quality Care” enhancing the patients experience
• Its about excellence in patient care - performance will follow • Its about a way of working not a project • Everything we do is guided by six simple principles that are owned
and understood by staff

Patients will be reviewed by the inpatient team within 2 hours of being
referred for admission.
October 2013
Patients will be discharged from E&TC or admitted to the hospital as decided
by the E&TC consultant staff.
Patients will be admitted to a bed in the most appropriate clinical place,
the first time.
Patients will have their investigations, consultations and interventions
completed as soon as possible, in order
of request and in no longer than 24 hours.
Patients will be actively managed to ensure they are only in hospital
for as long as is clinically necessary.
Patients that present to the E&TC will be assessed, have treatment and investigations initiated and a
management plan in place within 60 minutes of arrival.

Whole of Hospital Changes ! Inpatient engagement & acceptance of ED’s authority ! Roster re-profiling across the in-patient units ! Bed model changes in all wards
(admission beds, SAAU’s, MAAU's & Flex beds) ! Treat in turn principle for all investigative & interventional areas ! New after-hours models ensuring safer care in this vulnerable period
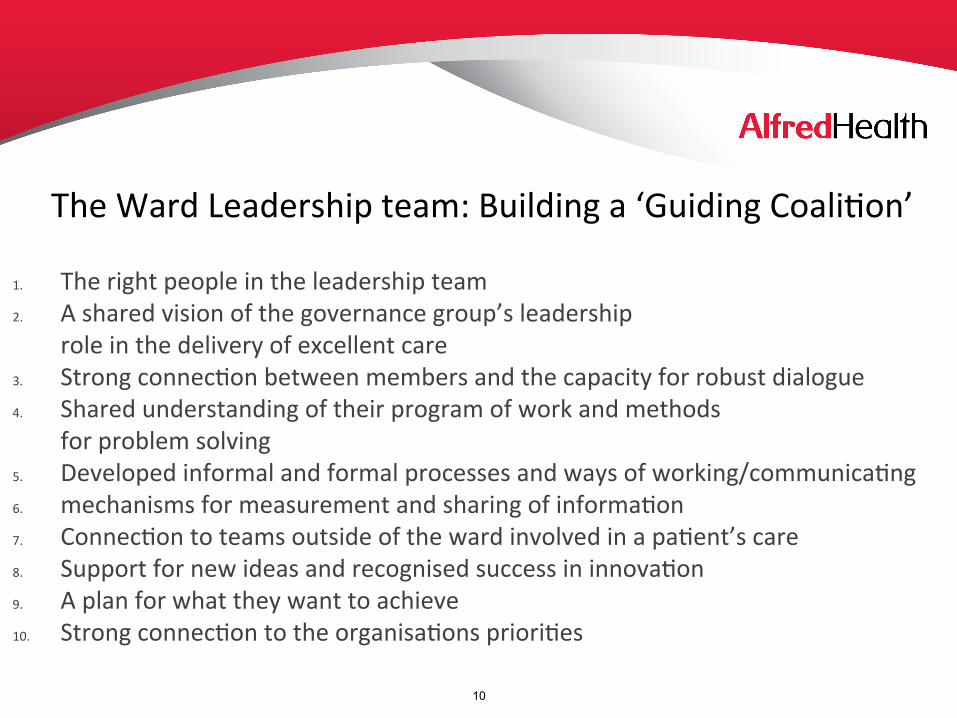
1. The right people in the leadership team 2. A shared vision of the governance group’s leadership
role in the delivery of excellent care 3. Strong connec>on between members and the capacity for robust dialogue 4. Shared understanding of their program of work and methods
for problem solving 5. Developed informal and formal processes and ways of working/communica>ng 6. mechanisms for measurement and sharing of informa>on 7. Connec>on to teams outside of the ward involved in a pa>ent’s care 8. Support for new ideas and recognised success in innova>on 9. A plan for what they want to achieve 10. Strong connec>on to the organisa>ons priori>es
The Ward Leadership team: Building a ‘Guiding Coali>on’
10

1. Patients will be actively involved in their treatment and have opportunity to influence the wards operations
2. Patients will be reviewed twice daily by their treating team(s) 3. Patients will have an up to date treatment plan at the time of admission including an
expected date of discharge with any deviation from that plan brought to the attention of the primary consultant
4. There will be a monthly management meeting, chaired by a head of unit (or designated consultant) and interdisciplinary in nature
5. Ward level metrics will be regularly reviewed by the interdisciplinary ward management team (per 4 above) to ensure timely quality care, that is safe for staff and patients alike & be within existing resources. These will be made available to ward visitors
6. There will be a clear mechanism to communicate with all staff 7. There will be a clear process for escalation of patient safety and ward management
issues 8. All staff (including visiting staff) will know where to access patient and management
information as it will be consistent across all wards 9. There will be a clear process for welcoming & managing visitors to a ward
Excellence in Ward Governance

These ward governance groups will; 1. Deliver on strategic priori>es 2. Manage their wards well and deliver on the TQC ward governance principles 3. Connect the various opera>onal teams & staff that u>lise the ward 4. Meet the expecta>ons set by the Na>onal Standards 5. Effec>vely communicate and consult with pa>ents 6. Sponsor innova>on at the ‘point of care’, and spread innova>on to other areas 7. Consider and evaluate ward prac>ce 8. Build an improvement culture and ward leadership capability 9. Engage in interdisciplinary research and translate research into prac>ce
Wards are governed by an interdisciplinary team which take responsibility for improving the pa8ent experience and consistency of prac8ce on the ward. They are the point of connec8on for the organiza8on to the wards and for the ward staff to the organisa8on
12

Ward Teams Radiology Pathology Pharmacy
Community and
Ambulatory Services
Outpatients
13
Business Services
Building Leadership Capability across Alfred Health
Theatres E&TC, ED & HITH

Developing our Leaders • Role Based programs- 2013-2015 • Outline role expectations and links to strategic directions
– Unit Heads first - greatest need – Nurse Managers- shared framework and empower – Lead (business services)-often ignored – Associate Nurse Managers –our daily leaders and future
leaders Next step – Allied Health – and system transformation Shift to Team/Interdisciplinary focus ( integrated with ward
governance project)
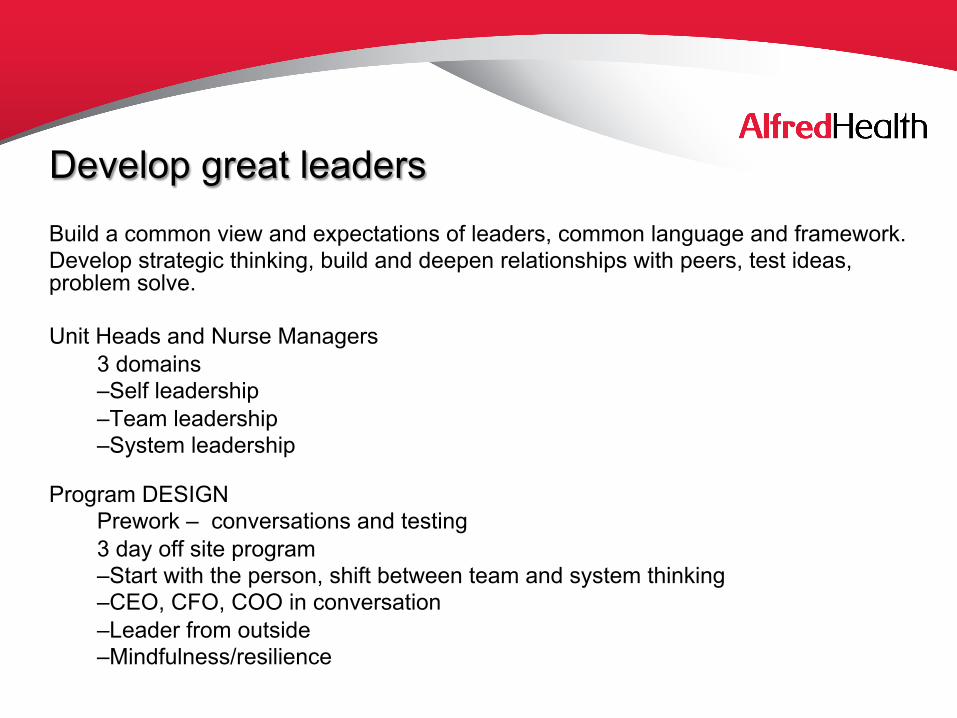
Develop great leaders Build a common view and expectations of leaders, common language and framework. Develop strategic thinking, build and deepen relationships with peers, test ideas, problem solve. Unit Heads and Nurse Managers
3 domains – Self leadership – Team leadership – System leadership
Program DESIGN Prework – conversations and testing 3 day off site program – Start with the person, shift between team and system thinking – CEO, CFO, COO in conversation – Leader from outside – Mindfulness/resilience

Title Unit of measure
Legend Legend Legend Legend
Legend Legend Legend
PRELIMINARY Legend Legend Legend Legend Legend
1 Footnote
Source: Source 16
Alfred Health’s Theatre Optimisation
Utilisation Reduce the proportion of time when lists are staffed, but not being used. Consolidated across sites. 1
Eliminating first case delay. A late start means a first case’s surgical start after 8:40am for an AM list or after 1:40pm for a PM list
Reduce the time required for each surgical case, by improving faster set-up, parallel processes? Target turnaround time.
On time starts 3
Clinical productivity 4
List construction - lists that are start late or finish early. Creating all day lists vs half day sessions - same unit. Identifying complex cases/overruns
Most cases should turnaround in 15 minutes or less – any turnaround results in unused theatre time
Turnaround
Scheduling 2
5
Scorecards - Utilisation, On time starts, Time out. Block mapping.
Visual Management 6
About us...... 19 OR'S + 2 PR- 3 sites Most Specialities Site 1 - 10 OR's 60:40 Emerg Site 2 - 6+2 Dedicated Elective Site 3 - 3 Community Hospital

Title Unit of measure
Legend Legend Legend Legend
Legend Legend Legend
PRELIMINARY Legend Legend Legend Legend Legend
1 Footnote
Source: Source 17
How are we doing?
Utilisation Target utilisation 85% - May 91% 1
May 76 % of cases commenced on time
Surgeon Preference Card / Surgical Tray and Set up redesign project. Reduction in CSS EFT
On time starts 3
Clinical productivity 4
Reduced 21 sessions inc staff. 13% increase in throughput within scheduled hours across AH Cancellation rate <4%
Turnaround Target achieved for standard cases ICU transfers still need work Turnaround
Scheduling 2
5
Ongoing........ keeping it interesting......maintaining the impact. Visual Management 6
Junior medical Staff involvement - crucial
• Weekly meeting with Advanced Trainees • Moving to open meeting with Adv Trainees and all other JMO’s • Improve the training experience • Identify issues • Some Project leadership

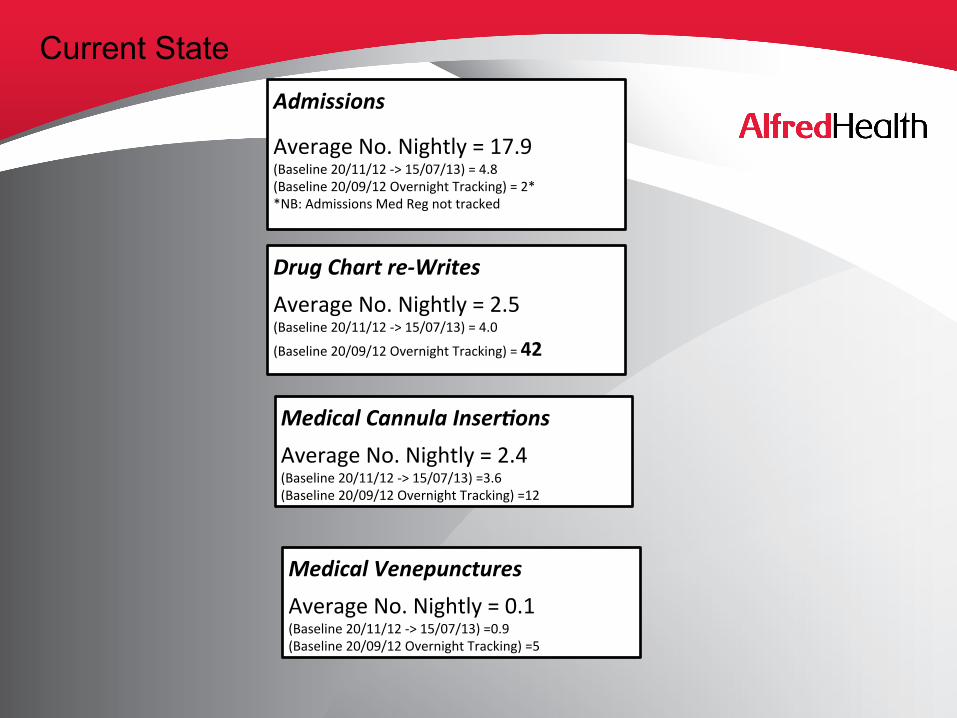
Current State
Drug Chart re-‐Writes Average No. Nightly = 2.5 (Baseline 20/11/12 -‐> 15/07/13) = 4.0
(Baseline 20/09/12 Overnight Tracking) = 42
Medical Cannula Inser5ons Average No. Nightly = 2.4 (Baseline 20/11/12 -‐> 15/07/13) =3.6 (Baseline 20/09/12 Overnight Tracking) =12
Medical Venepunctures Average No. Nightly = 0.1 (Baseline 20/11/12 -‐> 15/07/13) =0.9 (Baseline 20/09/12 Overnight Tracking) =5
Admissions Average No. Nightly = 17.9 (Baseline 20/11/12 -‐> 15/07/13) = 4.8 (Baseline 20/09/12 Overnight Tracking) = 2* *NB: Admissions Med Reg not tracked

0%
2%
4%
6%
8%
10%
12%
14%
16%
18%
0 1 2 3 4 5 6 7 8 9 10 11 12 13 14 15 16 17 18 19 20 21 22 23
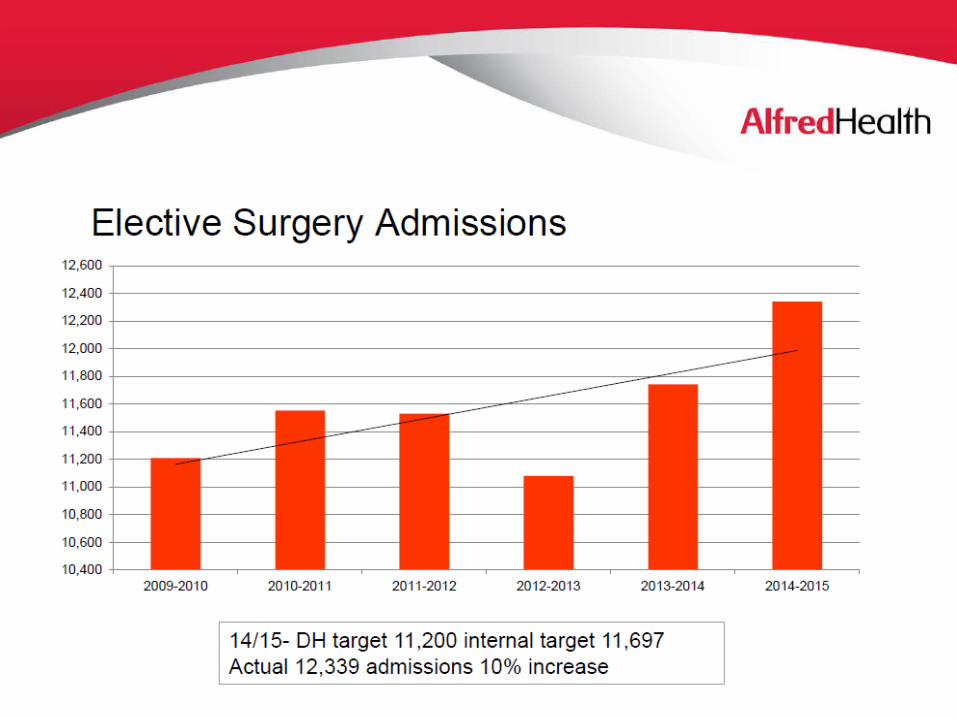
2009-2010 2010-2011 2011-2012 2012-2013 2013-2014
ICU discharge mortality by time of day

How are we doing ?

Time within the Emergency & Trauma Centre
50%
55%
60%
65%
70%
75%
80%
85%
90%
95%
Nov
-11
Dec
-11
Jan-
12
Feb-
12
Mar
-12
Apr
-12
May
-12
Jun-
12
Jul-1
2
Aug
-12
Sep
-12
Oct
-12
Nov
-12
Dec
-12
Jan-
13
Feb-
13
Mar
-13
Apr
-13
May
-13
Jun-
13
Jul-1
3
Aug
-13
Sep
-13
Oct
-13
Nov
-13
Dec
-13
Jan-
14
Feb-
14
Mar
-14
Apr
-14
May
-14
Jun-
14
Jul-1
4
Aug
-14
Sep
-14
% E
D P
rese
ntat
ions
< 4
Hou
rs
% ED Patients < 4 Hours Average Lower Control Limit Upper Control Limit

Relative length of Stay
50
55
60
65
70
75
80
85
90
95
Nov
-11
Dec
-11
Jan-
12
Feb-
12
Mar
-12
Apr
-12
May
-12
Jun-
12
Jul-1
2
Aug
-12
Sep
-12
Oct
-12
Nov
-12
Dec
-12
Jan-
13
Feb-
13
Mar
-13
Apr
-13
May
-13
Jun-
13
Jul-1
3
Aug
-13
Sep
-13
Oct
-13
Nov
-13
Dec
-13
Jan-
14
Feb-
14
Mar
-14
Apr
-14
May
-14
Jun-
14
Jul-1
4
Rel
ativ
e St
ay In
dex
Relative Stay Index (Source: Health Round Table HED)
Relative Stay Index Average Lower Control Limit Upper Control Limit

Safety
0
20
40
60
80
100
120
Nov
-11
Dec
-11
Jan-
12
Feb-
12
Mar
-12
Apr
-12
May
-12
Jun-
12
Jul-1
2
Aug
-12
Sep
-12
Oct
-12
Nov
-12
Dec
-12
Jan-
13
Feb-
13
Mar
-13
Apr
-13
May
-13
Jun-
13
Jul-1
3
Aug
-13
Sep
-13
Oct
-13
Nov
-13
Dec
-13
Jan-
14
Feb-
14
Mar
-14
Apr
-14
May
-14
Jun-
14
Jul-1
4
Stan
dard
ised
Mor
talit
y R
ate
Standardised Mortality Rate (Source: Health Round Table HED)
Standardised Mortality Rate Average Lower Control Limit Upper Control Limit