Embed Size (px)
Citation preview

The Mayor’s Management Report
Fiscal 2009
Eight Year Review
September 29, 2009
2
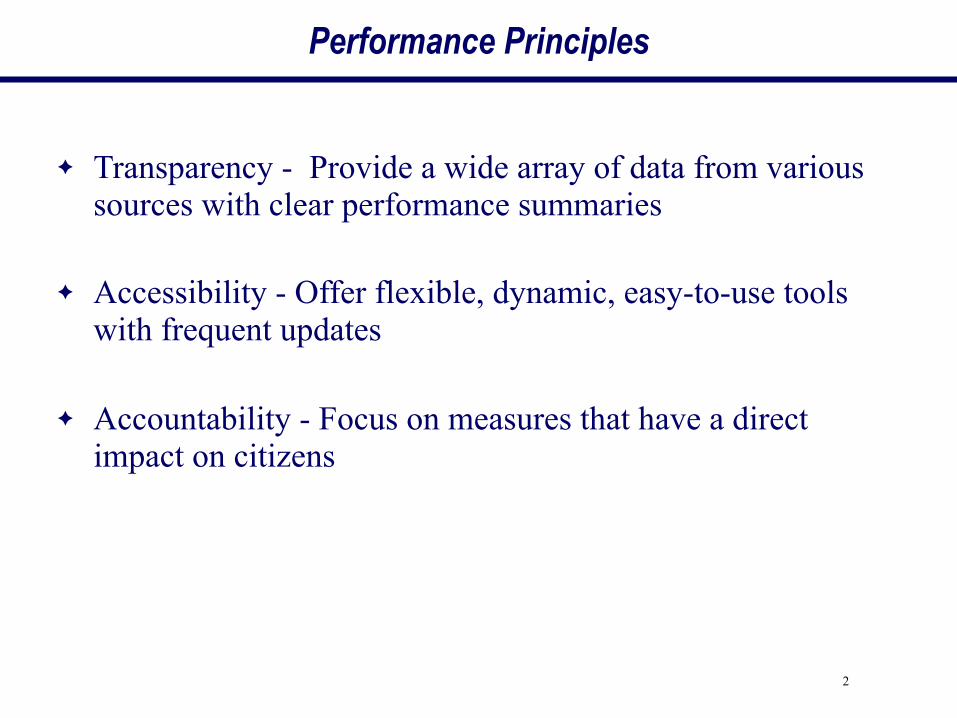
Performance Principles
✦ Transparency - Provide a wide array of data from various sources with clear performance summaries
✦ Accessibility - Offer flexible, dynamic, easy-to-use tools with frequent updates
✦ Accountability - Focus on measures that have a direct impact on citizens
3
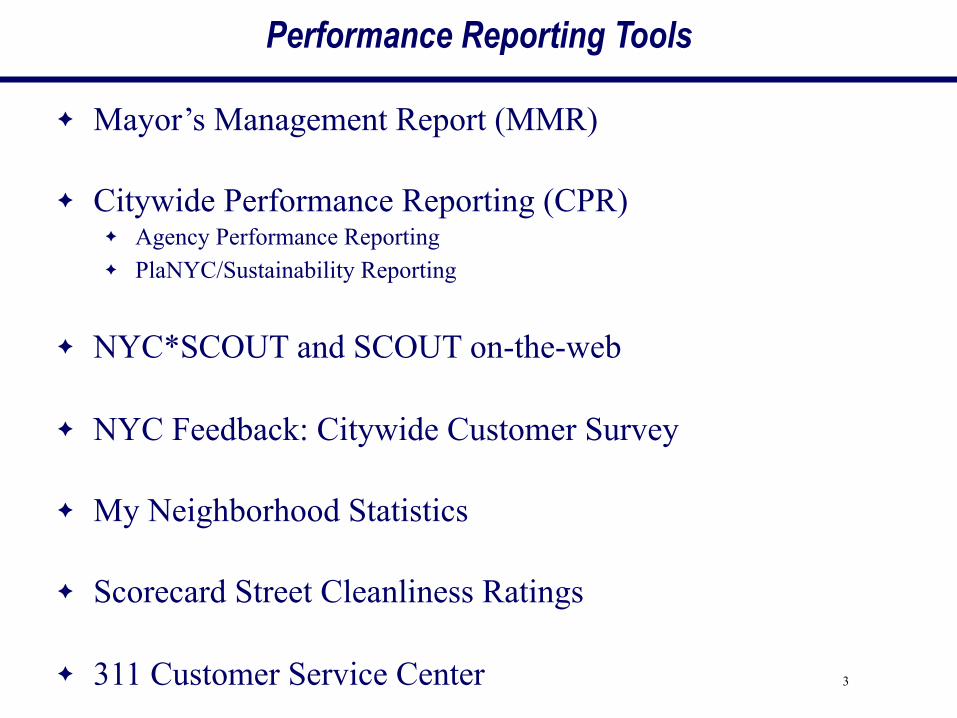
Performance Reporting Tools
✦ Mayor’s Management Report (MMR)
✦ Citywide Performance Reporting (CPR)✦ Agency Performance Reporting✦ PlaNYC/Sustainability Reporting
✦ NYC*SCOUT and SCOUT on-the-web
✦ NYC Feedback: Citywide Customer Survey
✦ My Neighborhood Statistics
✦ Scorecard Street Cleanliness Ratings
✦ 311 Customer Service Center
• or insert animated timeline slide from Austin to show the introduction of each performance related innovation
4
5
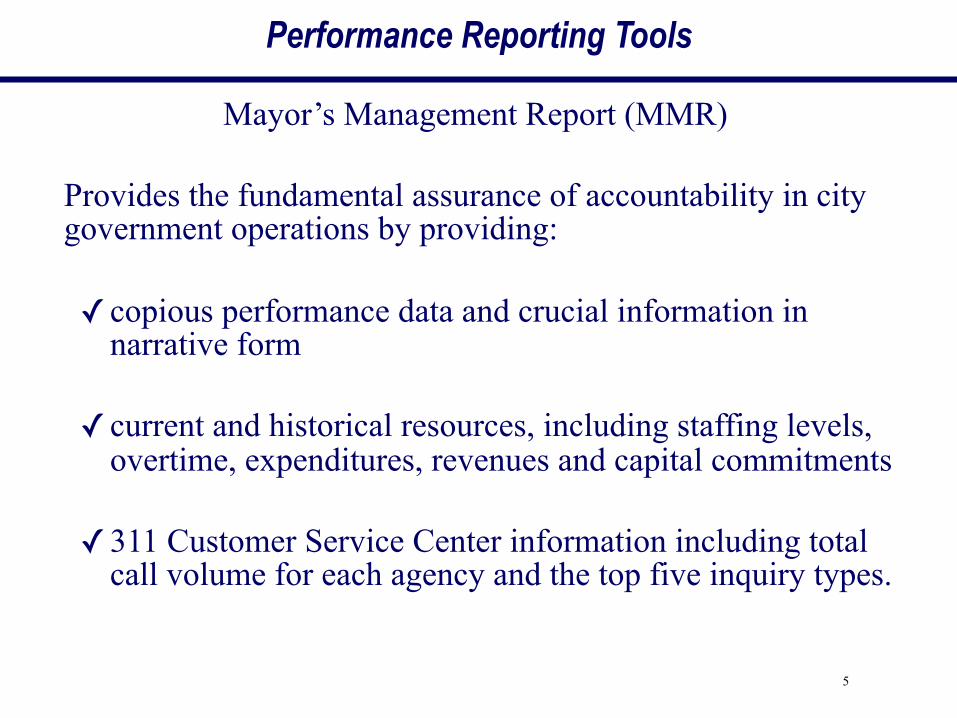
Mayor’s Management Report (MMR)
Provides the fundamental assurance of accountability in city government operations by providing:
✓ copious performance data and crucial information in narrative form
✓ current and historical resources, including staffing levels, overtime, expenditures, revenues and capital commitments
✓311 Customer Service Center information including total call volume for each agency and the top five inquiry types.
Performance Reporting Tools
6
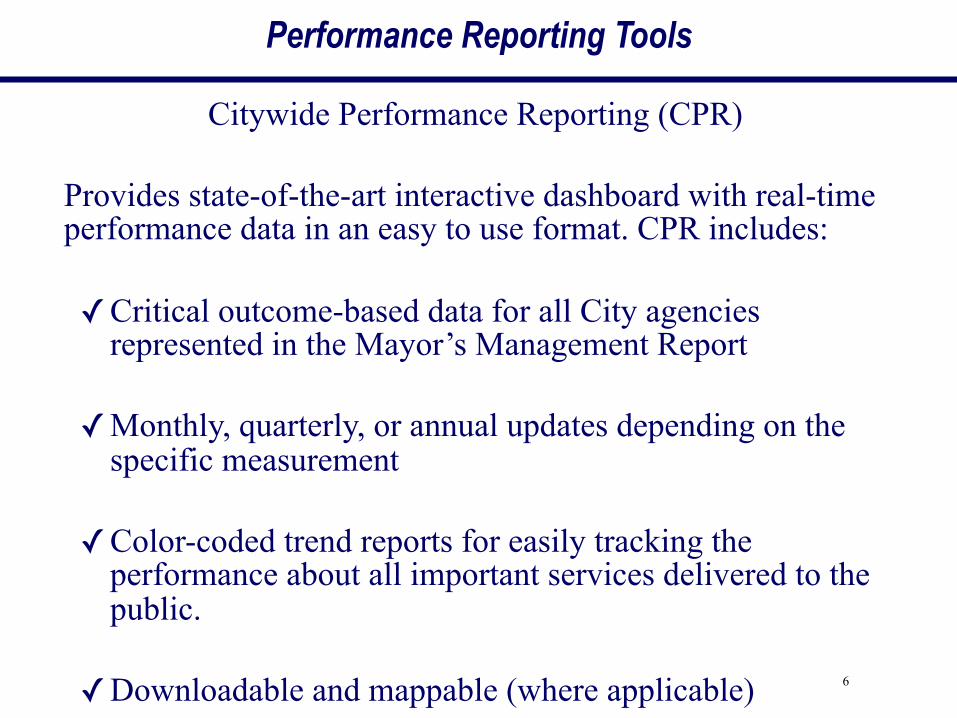
Citywide Performance Reporting (CPR)
Provides state-of-the-art interactive dashboard with real-time performance data in an easy to use format. CPR includes:
✓Critical outcome-based data for all City agencies represented in the Mayor’s Management Report
✓Monthly, quarterly, or annual updates depending on the specific measurement
✓Color-coded trend reports for easily tracking the performance about all important services delivered to the public.
✓Downloadable and mappable (where applicable)
Performance Reporting Tools

7
NYC Feedback: Citywide Customer Survey
The Citywide Customer Survey provides an added dimension to performance evaluation by reflecting the opinions of thousands of New Yorkers about how the City is doing in key service areas. The results provide:
✓Summary and detailed findings from more than resident 20,000 surveys representing all 59 community boards
✓Assessments of City performance in key areas such as public safety, social services, education and quality of life
✓Critical data at the neighborhood level neighborhood level.
Performance Reporting Tools
8
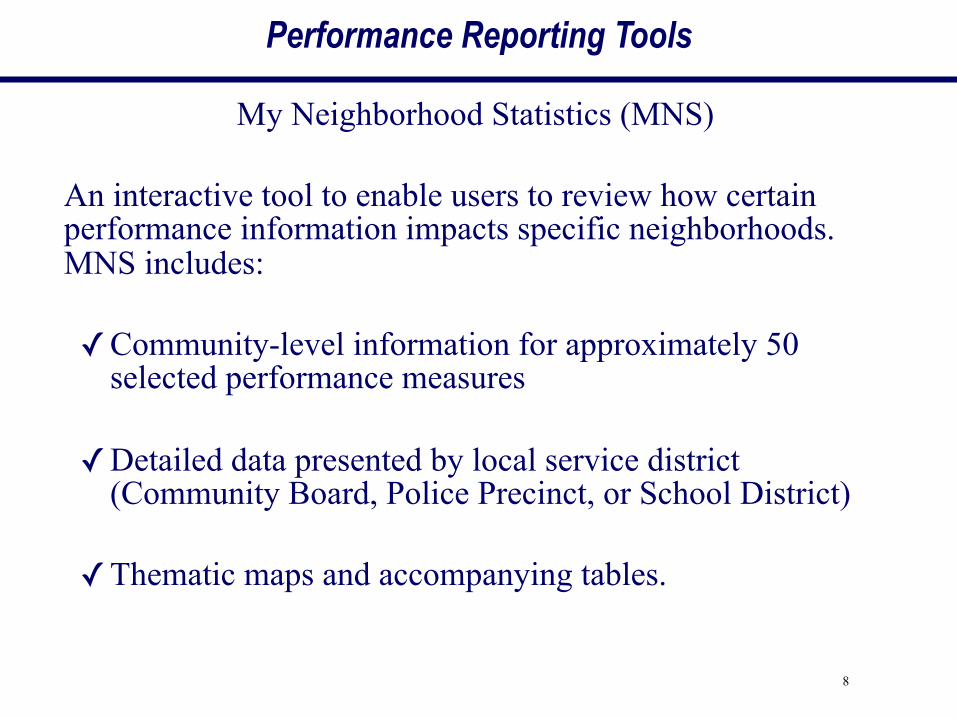
My Neighborhood Statistics (MNS)
An interactive tool to enable users to review how certain performance information impacts specific neighborhoods. MNS includes:
✓Community-level information for approximately 50 selected performance measures
✓Detailed data presented by local service district (Community Board, Police Precinct, or School District)
✓Thematic maps and accompanying tables.
Performance Reporting Tools

9
Public Safety Scorecard
*Fiscal 2002 data.
New Yorkers Are Safer
10
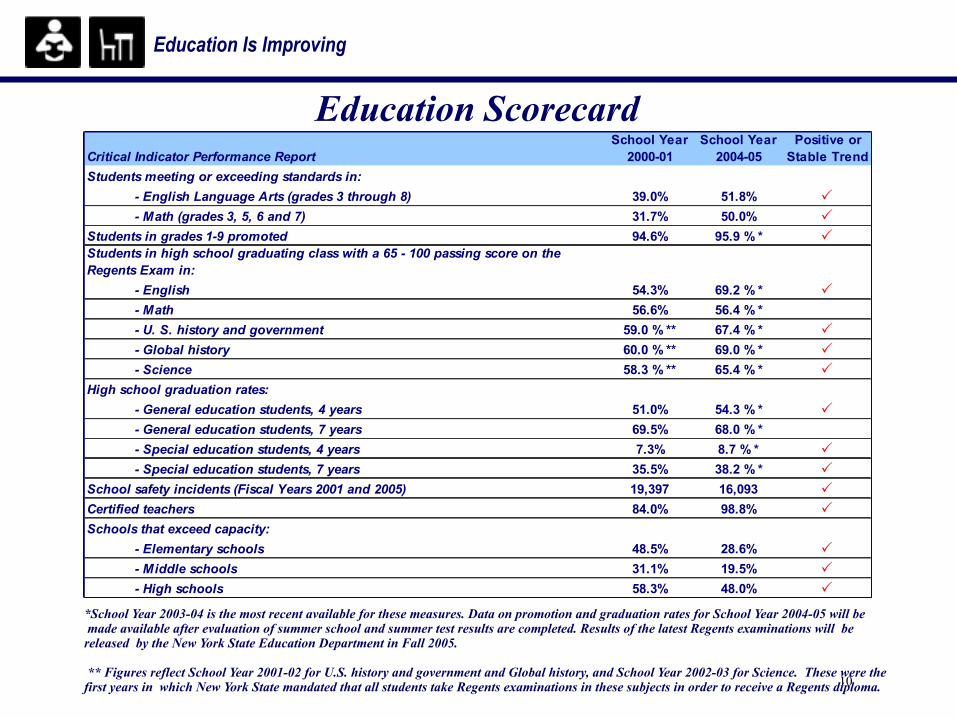
*School Year 2003-04 is the most recent available for these measures. Data on promotion and graduation rates for School Year 2004-05 will be made available after evaluation of summer school and summer test results are completed. Results of the latest Regents examinations will be released by the New York State Education Department in Fall 2005.
** Figures reflect School Year 2001-02 for U.S. history and government and Global history, and School Year 2002-03 for Science. These were the first years in which New York State mandated that all students take Regents examinations in these subjects in order to receive a Regents diploma.
Education Scorecard
Education Is Improving

11
Public Health Scorecard
New Yorkers Are Healthier
Indicators with the notation “(CY)” compare data for Calendar 2001 and Calendar 2004.*Three-year average for CY99-01.
12
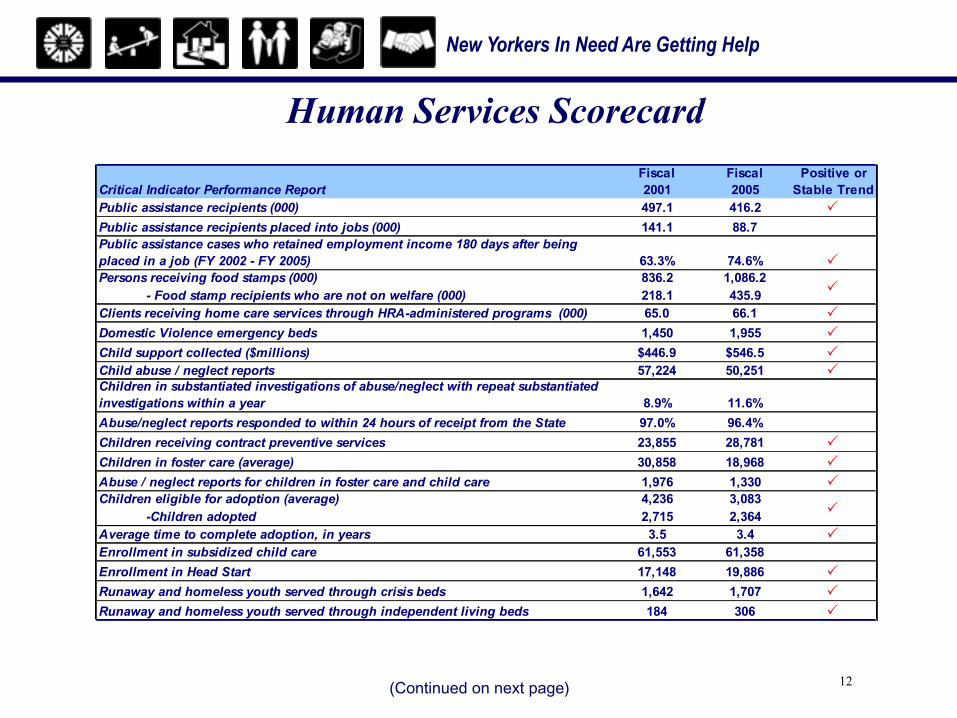
Human Services Scorecard
New Yorkers In Need Are Getting Help
(Continuedonnextpage)
13
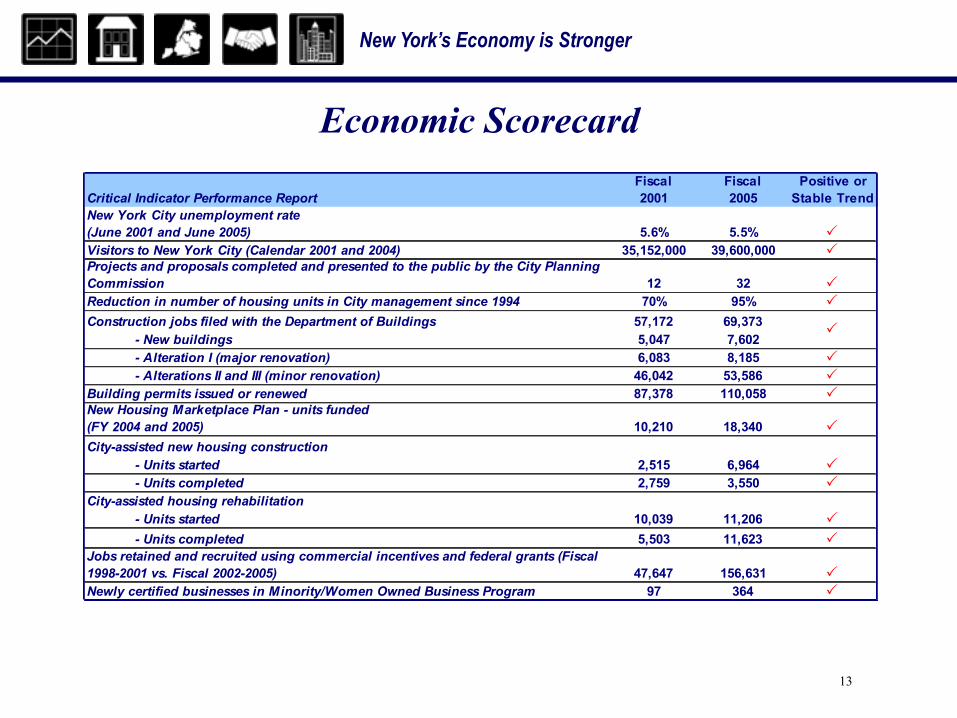
Economic Scorecard
New York’s Economy is Stronger
14
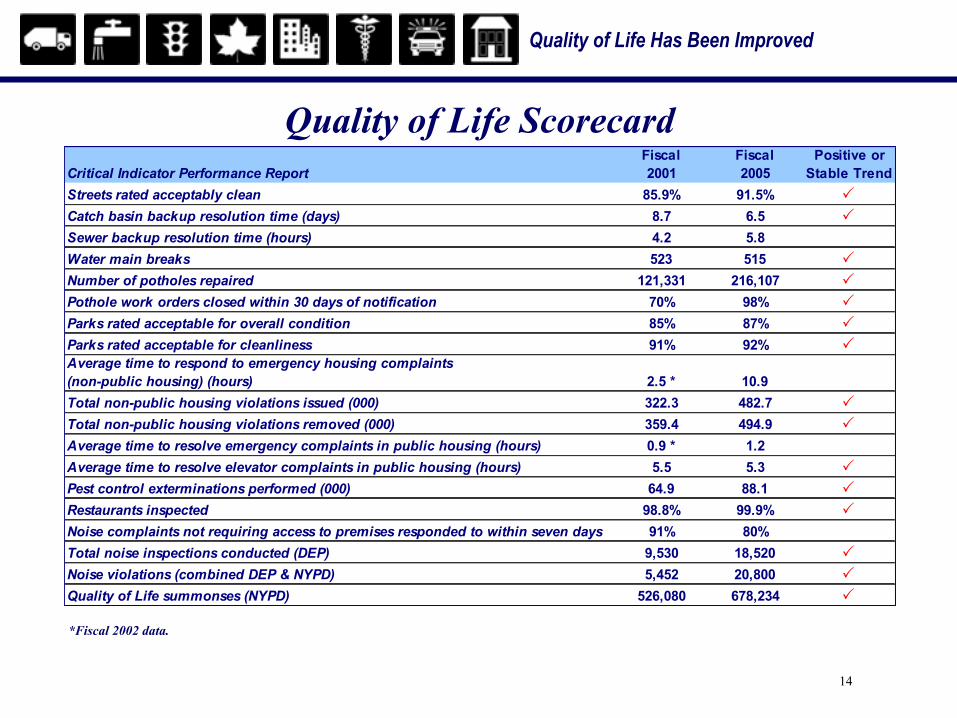
Quality of Life Scorecard
Quality of Life Has Been Improved
*Fiscal 2002 data.

15
Government Is More Accessible, And Accountable
311 Has Improved Service Delivery
Eliminates Wasteful Service Duplication
Identifies Gaps in Service Delivery
Widely Disseminates Information Serves as a Catalyst to Improve Efficiency and Service Delivery Leads to Fewer Abandoned Calls Sparked an Increase in Agency Response Relative to the Surge in Calls