Embed Size (px)
Citation preview
Novo Nordisk Capital Markets Day 5 May 2011
The
global diabetes care
market
Kåre SchultzCOO

Novo Nordisk Capital Markets Day Slide no 25 May 2011
Forward-looking statementsNovo Nordisk’s reports filed with or furnished to the US Securities and Exchange Commission (SEC), including the company’s Annual Report 2010 and Form 20-F, both expected to be filed with the SEC in February 2011 as well as this document and written information released, or oral statements
made, to the public in the future by or on behalf of Novo Nordisk, may contain forward-looking statements. Words such as ‘believe’, ‘expect’, ‘may’, ‘will’, ‘plan’, ’strategy’, ’prospect’, ’foresee’, ’estimate’, ’project’, ’anticipate’, ’can’, ’intend’, ‘target’
and other words and terms of similar meaning in connection with
any discussion of future operating or financial performance identify forward-looking statements. Examples of such forward-looking statements include, but are not limited to:-
statements of plans, objectives or goals for future operations,
including those related to Novo Nordisk’s products, product research, product development, product introductions and product approvals as well as cooperations
in relation thereto, -
statements containing projections of or targets for revenues, income (or loss), earnings per share, capital expenditures, dividends, capital structure or other net financials, -
statements regarding future economic performance, future actions and outcome of contingencies such as legal proceedings, and-
statements regarding the assumptions underlying or relating to such statements.
These statements are based on current plans, estimates and projections. By their very nature, forward-looking statements involve inherent risks and uncertainties, both general and specific. Novo Nordisk cautions that a number of important factors, including those described in this document, could cause actual results to differ materially from those contemplated in any forward-looking statements.
Factors that may affect future results include, but are not limited to, global as well as local political and economic conditions, including interest rate and currency exchange rate fluctuations, delay or failure of projects related
to research and/or development, unplanned loss of patents, interruptions of supplies and production, product recall, unexpected contract breaches or terminations, government-mandated or market-driven price decreases for Novo Nordisk’s products, introduction of competing products, reliance on information technology, Novo Nordisk’s ability to successfully market current and new products, exposure to product liability and legal proceedings and investigations, changes in governmental laws and
interpretation thereof, including on reimbursement, intellectual property protection and regulatory controls on testing, approval, manufacturing and marketing, perceived or actual failure to adhere to ethical marketing practices, investments in and divestitures of domestic and foreign companies, unexpected growth in costs and expenses, failure to recruit and retain the right employees and failure to maintain a culture of compliance.
Please also refer to the overview of risk factors in ‘Risk management’
of the Annual Report 2010 available as of 4 February 2011
on the company’s website (novonordisk.com).
Unless required by law Novo Nordisk is under no duty and undertakes no obligation to update or revise any forward-looking statement after the distribution of this document, whether as a result of new information, future events or otherwise.

Novo Nordisk Capital Markets Day Slide no 35 May 2011
Capital markets expect diabetes care to continue to outgrow the general pharmaceutical industry
Growth in global pr
escription sale
s versus di
abetes care sales (CAGR)
Source: EvaluatePharma, data retrieved January 21, 2011
Diabetes Care salesTotal Prescription sales
2000-2005 2005-2010 2010-2015
Insulin and GLP-1 sales
10.7%
12.3%
18.4%
6.4%
12.0%
15.9%
3.6%
7.8%9.2%

Novo Nordisk Capital Markets Day Slide no 45 May 2011
Diabetes market development
20
40
60
80
100
120
140
160
180
200
Global diabetes care market by treatment class
Global insulin market by segments
Note: *in DKK. Monthly
MAT, volume figuresSource: IMS
0
50
100
150
200
250
300
350
400
Feb
2006Feb
2011
Long acting
Premix
Fast acting
CAGR volume: 7.1%CAGR value*: 14.3%
tMU
34%
35%
31%
36%
30%
34%
Note: Monthly MAT, value figuresSource: IMS
OAD Insulin GLP-1
Feb
2006Feb
2011
DKK
billion
Total market: CAGR 11.4%
CAGR 7.8%
CAGR 14.3%
Injectables: CAGR 15.6%

Novo Nordisk Capital Markets Day Slide no 55 May 2011
Sustained double-digit insulin market growth
Global insulin market growth 2006-2011
The fundamental growth drivers of the insulin market
Volume
•
Prevalence of diabetes
•
Diagnosis rates and treatment rates
•
Intensification of insulin regimens
•
Growing BMI
•
Life-length
Value
•
Conversion to new generations of insulin
•
Device penetration
•
Price changes
Source: IMS, Monthly MAT, value figures
0
20
40
60
80
100
MAT Feb 2006 Volumecontribution
Mix/pricecontribution
MAT Feb 2011
44.4
bDKK86.7
bDKK
DKK
billion
21.6
bDKK
20.7
bDKK

Novo Nordisk Capital Markets Day Slide no 65 May 2011
Globally, diabetes has become an epidemic -
driven by lifestyle changes and demographics
Diagnosis and optimal treatment
remains a challenge –
the rule of halves
All people with diabetes
50% are diagnosed
50% have access to care
50% get decent care
100%
50%
25%
12%
50% reach target
Source: International Diabetes Foundation: Diabetes Atlas, 2000 and 2009Note: Data covers the 20-79 age-group. IO: International Operations, Japan includes Korea
Estimated number of people with diabetes –
projections appear conservative
JP, KoreaEurope
N. America0
50
100
150
200
250
300
350
400
450
2000 2010 2030
151
285
439
Million people
International Operations
China
Japan
Europe
North
America
CAGR:6.6%
CAGR:2.2%
//

Novo Nordisk Capital Markets Day Slide no 75 May 2011
The world is growing unhealthier
Prevalence of overweight and obesity in selected countries
Adapted from: Sassi, F. et al. 2009 “The Obesity Epidemic: Analysis of Past and Projected Future Trends in Selected OECD Countries”, OECD Health Working Papers, No. 45, OECD Publishing. Available
at: http://www.ecoclimax.com/2010/10/past-and-projected-future-overweight.html
0%
10%
20%
30%
40%
50%
60%
70%
80%
90%
1970 1980 1990 2000 2010 2020
Pro
port
ion o
fove
rwei
ght
and o
bes
eofpopula
tion (
%)
United
States
Canada
England
France
Italy

Novo Nordisk Capital Markets Day Slide no 85 May 2011
Life expectancy
has on
average
risen by 4 months
each
year
since
1970
Source: www.nationmaster.com, CIA world fact book
Life expectancy at birth (weighted average)
1970 2010
69 years
56 years
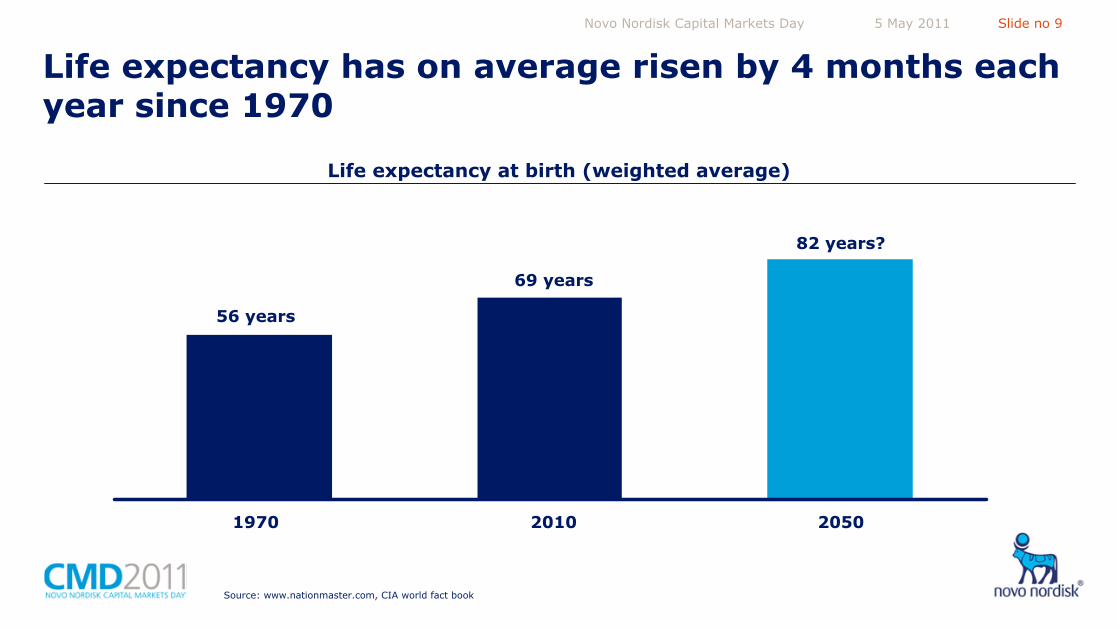
Novo Nordisk Capital Markets Day Slide no 95 May 2011
Life expectancy
has on
average
risen by 4 months
each
year
since
1970
Source: www.nationmaster.com, CIA world fact book
Life expectancy at birth (weighted average)
69 years
56 years
82 years?
1970 2010 2050

Novo Nordisk Capital Markets Day Slide no 105 May 2011
Implied
development
in insulin consumption
Insulin co
nsumption i
n selected
countries –
a
verage
insulin units per inhabitant
Sources: Calculation based on IMS volume figures and United Nations Population Division demography data
2000 2010
238
165
264
53
1
349
293
426
99
14
United
States Germany United
Kingdom ChinaJapan

Novo Nordisk Capital Markets Day Slide no 115 May 2011
Modern insulin is replacing human insulin –
as human insulin replaced animal insulin
0%
20%
40%
60%
80%
100%
1994 1995 1996 1997 1998 1999 2000 2001 2002 2003 2004 2005 2006 2007 2008 2009 2010
Share of total insulin volume
Source: IMS, annual volume figures
Modern
insulin
Human insulin
Animal
insulin

Novo Nordisk Capital Markets Day Slide no 125 May 2011
Modern insulin constitute more than 80% of the total insulin value marketShare of total insulin value
Source: IMS, monthly MAT value figures
Modern
insulin
Human insulin
Animal
insulin0%
20%
40%
60%
80%
100%
1994 1995 1996 1997 1998 1999 2000 2001 2002 2003 2004 2005 2006 2007 2008 2009 2010
Modern
insulin
Human insulin
Animal
insulin

Novo Nordisk Capital Markets Day Slide no 135 May 2011
Two-thirds of insulin volume is injected via a modern pen device
Source: IMS, annual volume figures
0%
20%
40%
60%
80%
100%
1994 1995 1996 1997 1998 1999 2000 2001 2002 2003 2004 2005 2006 2007 2008 2009 2010
Share of total insulin volume
Prefilled
device
Durable device
Vial
and syringe

Novo Nordisk Capital Markets Day Slide no 145 May 2011
Characteristics of the insulin industry
•
Chronic
disease leading to life-long patient-drug relationship•
Significant and
growing patient population•
Continuous upgrade
of insulin treatment
•
Significant usage of modern pen devices•
Strong brand loyalty and
limited switching
between therapies•
Many prescribers requiring significant commercial operations•
High volume production with significant capital investment required•
Limited abbreviated regulatory pathways
for approval of biosimilar insulin
Significant
growth
Complex
to be
competitive

Novo Nordisk Capital Markets Day Slide no 155 May 2011
Novo Nordisk device development for improved insulin treatment
1923 -
1985 1985 -
2010

Novo Nordisk Capital Markets Day Slide no 165 May 2011
Diabetes is chronic disease leading to long patient-drug relationship
Insulin treatment is ge
nerally char
acterised by strong brand loyalty and limited sw
itching betwee
n therapies
54 years Average
life
expectancy
with
type 2 diabetes
Diagnosis
of
type 2 diabetes
OAD treatment
Insulin treatment
8 years
12 years 74 years
Sources: Calvert MJ, McManus RJ, Freemantle N (2007) Management of type 2
diabetes with multiple oral hypoglycaemic agents or insulin in primary care retrospective cohort study Br J Gen Pract
57: 455-60. The British Journal of Diabetes & Vascular Disease 2008 8:92. 2005 -2008 National Health and Nutrition Examination Survey. http://www.newsobserver.com/2011/03/03/1025677/type-2-diabetes-linked-to-shorter.html#storylink=misearch. Life-
expectancy in Individuals with type 2 Diabetes, Diabetes (2007);
56: (supp1): A596

Novo Nordisk Capital Markets Day Slide no 175 May 2011
Novo Nordisk has significant operations across the world to remain competitive
China: ~2,100 FTEs
Japan & Korea: ~900 FTEs
International Operations: ~2,700 FTEs
North America: ~4,000 FTEs Europe: ~3,100 FTEs
FTEs represent full-time employee equivalents in Novo Nordisk’s sales regions (excludes a.o. employees in headquarter and manufacturing)

Novo Nordisk Capital Markets Day Slide no 185 May 2011
Insulin manufacturing process
Fermentation Recovery Purification Formulation Filling Assembly Packaging
API: insulin crystals F&F: liquid form Device & packaging

Novo Nordisk Capital Markets Day Slide no 195 May 2011
Novo Nordisk’s global manufacturing setup
Montes Claros
ClaytonChartres
Denmark
Tianjin•
Device manufacturing•
Packaging•
Filling plant project
•
Formulation & filling•
Assembly•
Packaging
•
Formulation & filling•
Assembly•
Packaging•
Formulation & filling•
Assembly•
Packaging
•
API production•
Formulation & filling•
Assembly•
Packaging•
Device & needle manufacturing
•
Packaging
Koriyama

Novo Nordisk Capital Markets Day Slide no 205 May 2011
0%
10%
20%
30%
40%
50%
60%
70%
Novo Nordisk has sustained
a global insulin market
leadership
position…Insulin value market share
worldwideInsulin volume market share
worldwide
Source: IMS Monthly MAT, value figures
0%
10%
20%
30%
40%
50%
60%
70%
Feb
2006Feb
2011Feb
2006Feb
2011
Novo Nordisk Sanofi-Aventis Eli Lilly Others
44%
33%
22%
1%
51%
23%
22%
4%
Novo Nordisk Sanofi-Aventis Eli Lilly Others
Source: IMS Monthly MAT, volume figures

Novo Nordisk Capital Markets Day Slide no 215 May 2011
0%
10%
20%
30%
40%
50%
60%
70%
…through
focus
on
improvements
for patients…
Modern insulin global volume market share
Prefilled device global insulin volume market share
Source: IMS Monthly MAT, value figures
0%
10%
20%
30%
Feb
2006Feb
2011Feb
2006Feb
2011
Novo Nordisk Sanofi-Aventis Eli Lilly Others
46%
34%
19%
1%
19%
10%
3%
FlexPen® SoloStar® KwikPen®
Source: IMS Monthly MAT, volume figures

Novo Nordisk Capital Markets Day Slide no 225 May 2011
…with
a strong
portfolio
of
modern
insulins
Strong current portfolioNovo Nordisk’s modern insulins’
global insulin volume market share
0%
10%
20%
Feb
2006Feb
2011
14%
9%
6%
NovoMix® NovoRapid® Levemir®
Source: IMS Monthly MAT, volume figures

Novo Nordisk Capital Markets Day Slide no 235 May 2011
0%
1%
2%
3%
4%
5%
0
1
2
3
4
5
6
7
Novo Nordisk is now also expanding into earlier treatment and growing the GLP-1 class
Victoza®
is driving the expansion of the global GLP-1 market
North America constitutes the majority of the GLP-1 value market*
Source: IMS Monthly MAT, value figures (DKK)
GLP-1 sales in bDKK
(right axis)
Dia
bete
s m
ark
et
share
(valu
e)
Feb
2006Feb
2011
26%
72%
*Annual value of diabetes market MAT February 2011
Source: IMS, Monthly value data (DKK)
DKK
billion
North America
Europe
Rest of
world
Victoza®
exenatide

Novo Nordisk Capital Markets Day 5 May 2011
The
diabetes care
market
in the
US
Jurek
GruhnSVP Region North America

Novo Nordisk Capital Markets Day Slide no 255 May 2011
•
The diabetes challenge
•
Treatment of diabetes today
•
Victoza®
performance
•
Insulin market performance
•
Focus areas and priorities
Outline
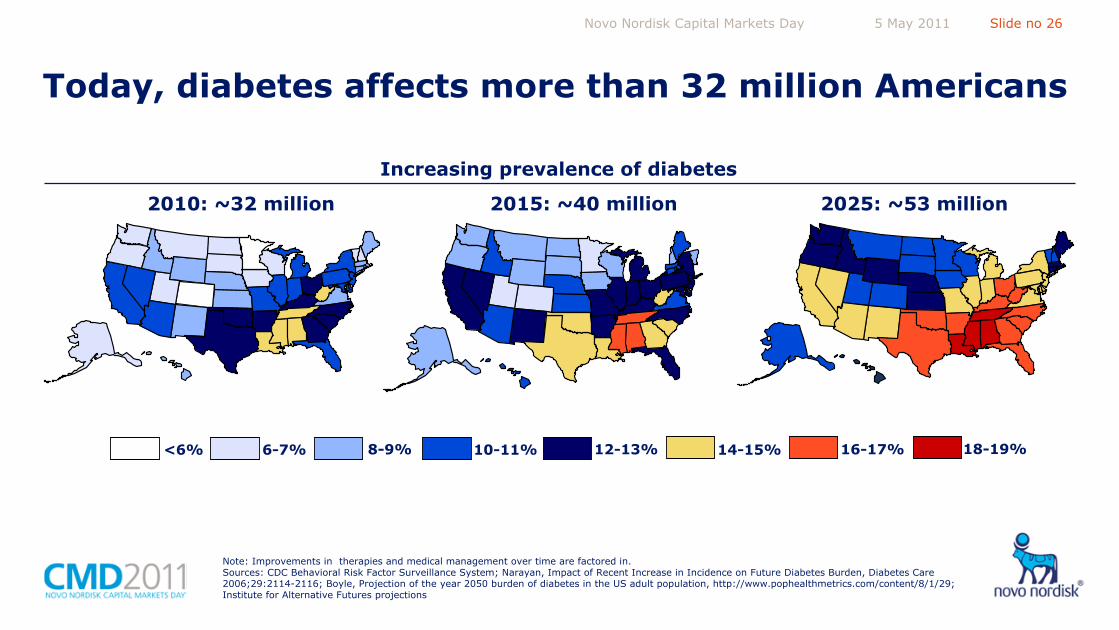
Novo Nordisk Capital Markets Day Slide no 265 May 2011
2010: ~32 million
6-7% 10-11% 18-19%12-13%<6% 16-17%8-9% 14-15%
Note: Improvements in therapies and medical management over time are factored in.Sources: CDC Behavioral Risk Factor Surveillance System; Narayan, Impact of Recent Increase in Incidence on Future Diabetes Burden, Diabetes Care 2006;29:2114-2116; Boyle, Projection of the year 2050 burden of diabetes in the US adult population, http://www.pophealthmetrics.com/content/8/1/29; Institute for Alternative Futures projections
Today, diabetes affects more than 32 million Americans
Increasing prevalence of diabetes
2015: ~40 million 2025: ~53 million

Novo Nordisk Capital Markets Day Slide no 275 May 2011
Sources: CDC Behavioral Risk Factor Surveillance System; Narayan, Impact of Recent Increase in Incidence on Future Diabetes Burden, Diabetes Care 2006;29:2114-2116; CDC, 2010 National Diabetes Fact Sheet; Boyle, Projection
of the year 2050 burden of diabetes in the US adult population,
http://www.pophealthmetrics.com/content/8/1/29; Institute for Alternative Futures projections
64 bUSD
52 bUSD40 bUSD
37 bUSD27 bUSD
46 bUSD
30 bUSD
36 bUSD
2010: 299 bUSD
Total annual direct medical and indirect societal costs of diabetes (billion USD)
2015: 374 bUSD 2025: 514 bUSD
1-2.9b 5-9.9b >25b<1b 15-24.9b3-4.9b 10-14.9b
Associated costs of diabetes represent a significant and increasing economic burden for society
21 bUSD

Novo Nordisk Capital Markets Day Slide no 285 May 2011
Note: Insulin data include treatment with concomitant non-insulin productsSource: IMS LRx
Monthly Regime, 12/10 PROJECTED to
Mattson Jack, NHANES IV and Ropers 2010
Treatment of diabetes in the US today
Diet & Exercise11%
OAD -
Met/SU/TZD55%
Incretin10%
Insulin24%
Share of patients by treatment class
Basal-only40%
Basal-Bolus29%
Premix-only14%
Rapid-only14%
GLP-1 -
20%
DPP-4s 80%

Novo Nordisk Capital Markets Day Slide no 295 May 2011
In the US, the insulin market is outgrowing the overall diabetes care market
Note: Monthly MAT, value figuresSource: IMS
US diabetes care market by treatment class US insulin volume market by segmen
ts
Note: * in DKK. Monthly
MAT, volume figuresSource: IMS
DKK billion tMU
0
20
40
60
80
100
120OAD Insulin GLP-1
Feb
2006Feb
2011
Total market: CAGR 12.0%
CAGR 5.6%
CAGR 18.9%
0
20
40
60
80
100
120
Feb
2006Feb
2011
Long acting
Premix
Fast acting
CAGR volume: 5.8%CAGR value*: 18.9%

Novo Nordisk Capital Markets Day Slide no 305 May 2011
Victoza®
continues to drive GLP-1 growth
Expansion of the GLP-1 market
Source: IMS, NPA Monthly data; IMS LRx
Weekly Data
Victoza®
source of patients
0
1
2
3
4
5
Naïve
Metformin
SU ±
met
Insulin
TZD ±
metDPP-IV
exenatide
Mar
2010Mar
2011
64%
Note: Naïve is defined as all patients who have not filled a prescription
in 12 months Source: IMS, NPA Monthly data; IMS LRx
4 week average Naive and Switch/Add Script Counts
Number
of
patients (thousands)
0
50
100
150
200
250
300
0%
1%
2%
3%
4%
5%
6%
Mar
2010Mar
2011
GLP-1 % of of
diabetes market value (right axis)
GLP-1 TRx
scripts (thousands)
Victoza®
exenatide

Novo Nordisk Capital Markets Day Slide no 315 May 2011
Volume growth and value upgrade drive insulin market value expansion
US insulin value market growth
0
10
20
30
40
50
60
February 2006 Volume growth Mix/pricegrowth
February 2011
DKK billion
9.0
bDKK
18.5 bDKK
Note: Monthly MAT, value figuresSource: IMS
19.9
bDKK47.4
bDKK
Value upgrade
Note: Monthly
MAT, volume figuresSource: IMS
0%
10%
20%
30%
40%
50%
60%
70%
80%
Penetration of total market
Feb
2006Feb
2011
Device penetration
Modern insulin penetration73%
27%

Novo Nordisk Capital Markets Day Slide no 325 May 2011
Novo Nordisk has increased overall insulin market share in the US
Note: Monthly MAT, value figures (DKK)Source: IMS
US total insulin value market share
0%
10%
20%
30%
40%
50%
60%
70%
Feb
2006
37%
37%
26%
Feb
2011
Novo Nordisk Sanofi-Aventis Eli Lilly
US total insulin volume market share
Note: Monthly MAT, volume figuresSource: IMS
0%
10%
20%
30%
40%
50%
60%
70%
Feb
2006
42%
32%
26%
Novo Nordisk Sanofi-Aventis Eli Lilly
Feb
2011

Novo Nordisk Capital Markets Day Slide no 335 May 2011
Novo Nordisk has increased modern insulin market share in the US
US modern insulin volume market share US modern insulin value market share
Note: Monthly MAT, value figures (DKK)Source: IMS
0%
10%
20%
30%
40%
50%
60%
70%
Feb
2006Feb
2011
Novo Nordisk Sanofi-Aventis Eli Lilly
37%
42%
21%
0%
10%
20%
30%
40%
50%
60%
70%
Feb
2006
Novo Nordisk Sanofi-Aventis Eli Lilly
37%
44%
19%
Note: Monthly MAT, volume figuresSource: IMS
Feb
2011

Novo Nordisk Capital Markets Day Slide no 345 May 2011
0%
20%
40%
60%
80%
100%
0%
20%
40%
60%
80%
100%
0%
20%
40%
60%
80%
100%
Insulin market shares and dynamics
US total insulin market shares by segment
Source: IMS, Monthly MAT volume figures
Novo Nordisk Sanofi-Aventis Eli Lilly Conversion rate to modern insulin
Insu
lin
mark
et
share
(vo
lum
e)
Short acting segment Premix segment Long acting segment
Feb
2006Feb
2011Feb
2006Feb
2011Feb
2006Feb
2011

Novo Nordisk Capital Markets Day Slide no 355 May 2011
Focus
areas
for the
US
•
Expand Victoza®
prescribing base and access
•
Continue modern insulin strategy of value creation by balancing profitability and access
•
Preparing for a successful launch of Degludec and DegludecPlus

Novo Nordisk Capital Markets Day 5 May 2011
The diabetes care market in China
Ron ChristieSVP Region China

Novo Nordisk Capital Markets Day Slide no 375 May 2011
China is evolving as the world’s #3 pharma
market
201918171615141312
11
10987654321
Netherlands PolandGreeceTurkeyAustraliaMexicoVenezuelaSouth KoreaIndia
Russia
CanadaUnited KingdomBrazilSpainItalyFranceGermanyChinaJapanUnited States
2011 Rank
201918171615141312
11
10987654321 United StatesUnited States1
VenezuelaTurkey12
RussiaRussia11
United KingdomCanada10CanadaBrazil9BrazilUnited Kingdom8SpainSpain7ItalyItaly6FranceChina5
TurkeySouth Korea15South KoreaMexico14IndiaIndia13
GermanyGermany4ChinaFrance3
AustraliaGreece17MexicoAustralia16
JapanJapan 2
BelgiumPoland20PolandNetherlands19GreeceVenezuela18
2013 Rank2009 Rank
201918171615141312
11
10987654321
Netherlands PolandGreeceTurkeyAustraliaMexicoVenezuelaSouth KoreaIndia
Russia
CanadaUnited KingdomBrazilSpainItalyFranceGermanyChinaJapanUnited States
2011 Rank
201918171615141312
11
10987654321 United StatesUnited States1
VenezuelaTurkey12
RussiaRussia11
United KingdomCanada10CanadaBrazil9BrazilUnited Kingdom8SpainSpain7ItalyItaly6FranceChina5
TurkeySouth Korea15South KoreaMexico14IndiaIndia13
GermanyGermany4ChinaFrance3
AustraliaGreece17MexicoAustralia16
JapanJapan 2
BelgiumPoland20PolandNetherlands19GreeceVenezuela18
2013 Rank2009 Rank
Source: IMS Health MIDAS, Market Prognosis October 2009. Market size ranking in constant USD

Novo Nordisk Capital Markets Day Slide no 385 May 2011
This growth has been driven by five major factors
Source: IMS RDPAC presentation March 2011
China’s pharmaceutical market is estimated to grow 20% per annum 2010-2015
Robust economic growth• World #2 economy in 2010• 8% GDP growth for the next 5 years (government target 7.5%)
Ageing population• 2006-2010: +46 million >50 years old• 2010-2020: +180 million more
Increasing incidence of chronic diseases • Latest study estimates 92 million people with diabetes• Obese population tripled from 2002 to 2010
Sweeping healthcare reforms • Broaden coverage and benefits• Strengthen primary care and rural healthcare services• Improve disease prevention and early diagnosis
Increased investment from all players • Increasing M&A activity

Novo Nordisk Capital Markets Day Slide no 395 May 2011
Substantial growth in diabetes prevalence expected in the BRIC countries
8 10
5144
13 10
87
64
0
20
40
60
80
100
Brazil Russia India China
20102030
Driven by prevalence growth in the BRIC countries
Million people
Source: International Diabetes Foundation: Diabetes Atlas, 2000 and 2009Note: Data covers the 20-79 age-group. IO: International Operations, Japan includes Korea
Diagnosis, treatment intensification and regional difference remains key challenges
0
20
40
60
80
100
People withdiabetes
Diagnoseddiabetics
Treateddiabetics
Patientsachieving
targets
% of people with diabetes
24%
3%
30%

Novo Nordisk Capital Markets Day Slide no 405 May 2011
Changing Diabetes®
in China
-
increasing awareness and diagnosis
• Insulin Patient Self-management Guideline, CDS-NN• Changing Diabetes®
bus: 3 years, 61 cities, 46,000 patients and ~200 media reports • 12 more cities will be covered in 2011
• Diabetes knowledge websites
for both patients and physicians• GDM program: 3-year, World Diabetes Foundation-Ministry of Health-Novo Nordisk programme:
• Establish 45 centres, train 4,725 physicians and screen 292,500
women• Localised “Barometer”
Programme
—
Diabetes Care Campaign: • Covered 90 hospitals + 200 CHC, 45,952 patients screened, 1,690
physicians and nurses educated• Social Network for Endocrinologists
in China & Medical Information Website: launched in Feb 2011• Leadership
foras• NNDU• NovoCare
–
serving
more than
600,000 members
since
2011• Provide comprehensive diabetes knowledge for patients and organise a variety of patient activities• 24-hour hotline service -
>9000 calls per month• Patients follow-up calls to ensure successful insulin initiation -
>66,000 calls per month

Novo Nordisk Capital Markets Day Slide no 415 May 2011
Novo Nordisk is the company with the largest focus on diabetes care in China
Branch Office
Frontiers
Heilongjiang
Jilin
Liaoning
Tianjing
Beijing
HebeiShanxi
ShandongJiangsu
Zhejiang
Fujian
JiangxiHunan
Guangxi
Anhui
HenanShanxi
Hubei
Xinjiang Gansu
Sichuan
ShanghaiTibet
Qinghai
Inner Mongolia
Yunnan
Guizhou
Chongqing
Ningxia
Hainan
TaiwanGuangdong
Shenyang
Guangzhou
Wuhan
Hong Kong
Jinan
Changchun
A total of 3,375 employees across•
Commercial operations in China•
Manufacturing•
R&D•
Hong Kong•
Taiwan

Novo Nordisk Capital Markets Day Slide no 425 May 2011
The Chinese insulin market is expanding significantly -
predominately driven by the premix segment
1
2
3
4
5
6
Chinese diabetes care market by treatment class by value Chinese insulin market by segments
0
4
8
12
16
20
24
Feb
2006Feb
2011
Long acting
Premix
Fast acting
CAGR volume: 26.8%CAGR value*: 38.8%
tMU
14%
53%
33%
13%
64%
23%
OAD Insulin GLP-1
Feb
2006Feb
2011
DKK
billion
Total market: CAGR 32.4%
CAGR 27.8%
CAGR 38.8%
Note: *in DKK. Monthly
MAT, volume figures. IMS projects the Chinese market based on hospital data from 14% of Chinese hospitalsSource: IMS
Note: Monthly MAT, value figures. IMS projects the Chinese market based on hospital data from 14% of Chinese hospitalsSource: IMS

Novo Nordisk Capital Markets Day Slide no 435 May 2011
0%
10%
20%
30%
40%
50%
60%
70%
Novo Nordisk is leading the total diabetes market in China…
Total diabetes care value market shares Total insulin volume market shares
0%
10%
20%
30%
40%
Feb
2006
37%
9%
6%
Novo Nordisk Sanofi-Aventis Eli Lilly
Feb
2011
15%
4%
Bayer-Schering Bristol Myers-Squibb
Source: IMS Monthly MAT, value figures. IMS projects the Chinese
market based on hospital data from 14% of Chinese hospitals
Novo Nordisk Sanofi-Aventis Eli LillyShanghai Fosun Tonghua
Dongbao
Feb
2006
Source: IMS Monthly MAT, volume figures. IMS projects the Chinese market based on hospital data from 14% of Chinese hospitals
63%
5%12%
4%
13%
Feb
2011

Novo Nordisk Capital Markets Day Slide no 445 May 2011
…and maintaining clear leadership in the significant human insulin market…
Human insulin value market share Human insulin volume market share
0%
10%
20%
30%
40%
50%
60%
70%
80%
90%
Feb
2006
76%
17%
Novo Nordisk Eli Lilly
Feb
2011
6%
Source: IMS Monthly MAT, value figures.
0%
10%
20%
30%
40%
50%
60%
70%
80%
90%
Feb
2006
Source: IMS Monthly MAT, volume figures
74%
17%
Feb
2011
Tonghua
Dongbao
8%
Novo Nordisk Eli LillyTonghua
Dongbao

Novo Nordisk Capital Markets Day Slide no 455 May 2011
…and maintaining a very solid leadership position in the modern insulin market
Modern insulin value market share Modern insulin volume market share
0%
10%
20%
30%
40%
50%
60%
70%
80%
90%
Feb
2006
53%
32%
8%
Novo Nordisk Sanofi-Aventis
Feb
2011
6%
BJ Ganli
Pharm
Source: IMS Monthly MAT, value figures
0%
10%
20%
30%
40%
50%
60%
70%
80%
90%
Feb
2006
Source: IMS Monthly MAT, volume figures
69%
Feb
2011
Eli Lilly
15%11%
4%
Novo Nordisk Sanofi-Aventis
BJ Ganli
PharmEli Lilly

Novo Nordisk Capital Markets Day Slide no 465 May 2011
Outlook for Novo Nordisk in China
•
Continue to collaborate with public authorities on diabetes awareness programmes
•
Continue to be the main source of information on diabetes to doctors
•
Continue to be the leading patient support company in the diabetes field
•
Expand operations further into smaller cities and rural areas
•
Launch of Victoza®
in second half of 2011

Novo Nordisk Capital Markets Day 5 May 2011
Closing
remarks
Kåre SchultzCOO

Novo Nordisk Capital Markets Day Slide no 485 May 2011
Innovation is the key to sustained growth
Diabetes Modern insulins
Victoza®Degludec*
DegludecPlus*IDegLira*
FIAsp*
Liraglutide in pre-diabetes and obesity
*Note: Degludec is the internal designation for insulin degludec. DegludecPlus is the internal designation for insulin degludec/insulin aspart. IDegLira
is the internal designation for insulin degludec/liraglutide. FIAsp
is the internal designation for fast acting insulin aspart.

Novo Nordisk Capital Markets Day Slide no 495 May 2011
Capital markets expect diabetes care to continue to outgrow the general pharmaceutical industry
Growth in global pr
escription sale
s versus di
abetes care sales (CAGR)
Source: EvaluatePharma, data retrieved January 21, 2011
Diabetes Care salesTotal Prescription sales
2000-2005 2005-2010 2010-2015
Insulin and GLP-1 sales
10.7%
12.3%
18.4%
6.4%
12.0%
15.9%
3.6%
7.8%9.2%