Embed Size (px)
Citation preview

18 April 20231 |
Forecasted demand for current and new ARV medicines in low and middle income countries,
2014-2025
Forecasted demand for current and new ARV medicines in low and middle income countries,
2014-2025
J Perriëns (WHO), S Juneja (MPP) and V Prabhu (CHAI) on behalf of the WHO ARV Forecasting Technical Working Group
(Avenir Health, CDC, CHAI, GFATM, MPP, PfSCM, UNAIDS, UNICEF, USAID, WHO)
18 April 20232 |
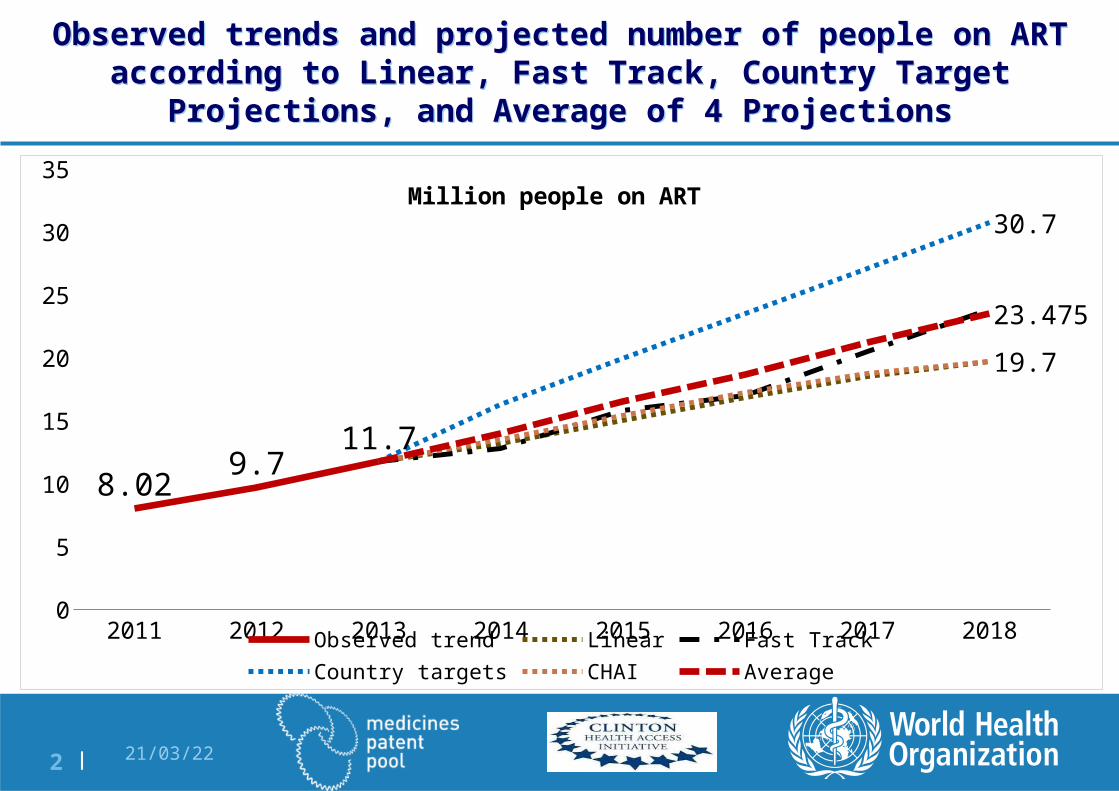
Observed trends and projected number of people on ART according to Linear, Fast Track, Country Target Projections, and Average of 4 Projections
Observed trends and projected number of people on ART according to Linear, Fast Track, Country Target Projections, and Average of 4 Projections
2011 2012 2013 2014 2015 2016 2017 20180
5
10
15
20
25
30
35
8.029.7
11.7
30.7
19.7
23.475
Million people on ART
Observed trend Linear Fast TrackCountry targets CHAI Average
18 April 20233 |
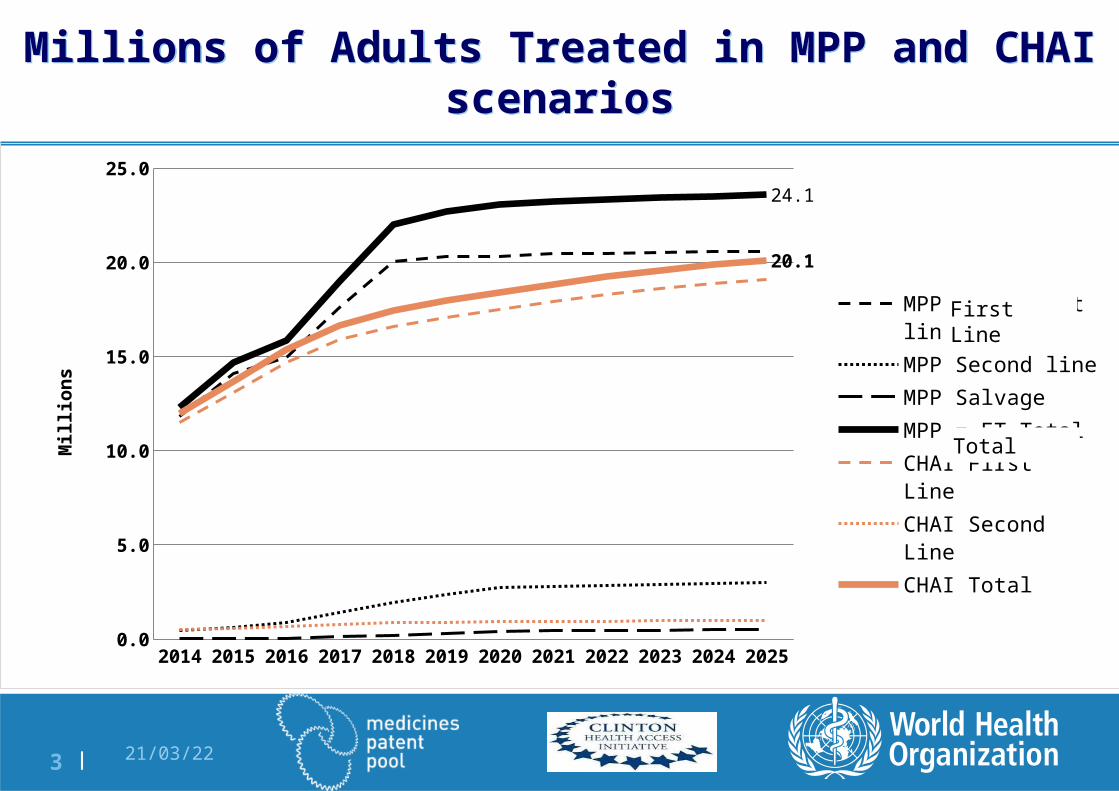
Millions of Adults Treated in MPP and CHAI scenariosMillions of Adults Treated in MPP and CHAI scenarios
2014 2015 2016 2017 2018 2019 2020 2021 2022 2023 2024 20250.0
5.0
10.0
15.0
20.0
25.0
24.1
20.1
MPP = FT First line
MPP Second line
MPP Salvage
MPP = FT Total
CHAI First Line
CHAI Second Line
CHAI Total
Mill
ion
s
First Line
Total
18 April 20234 |
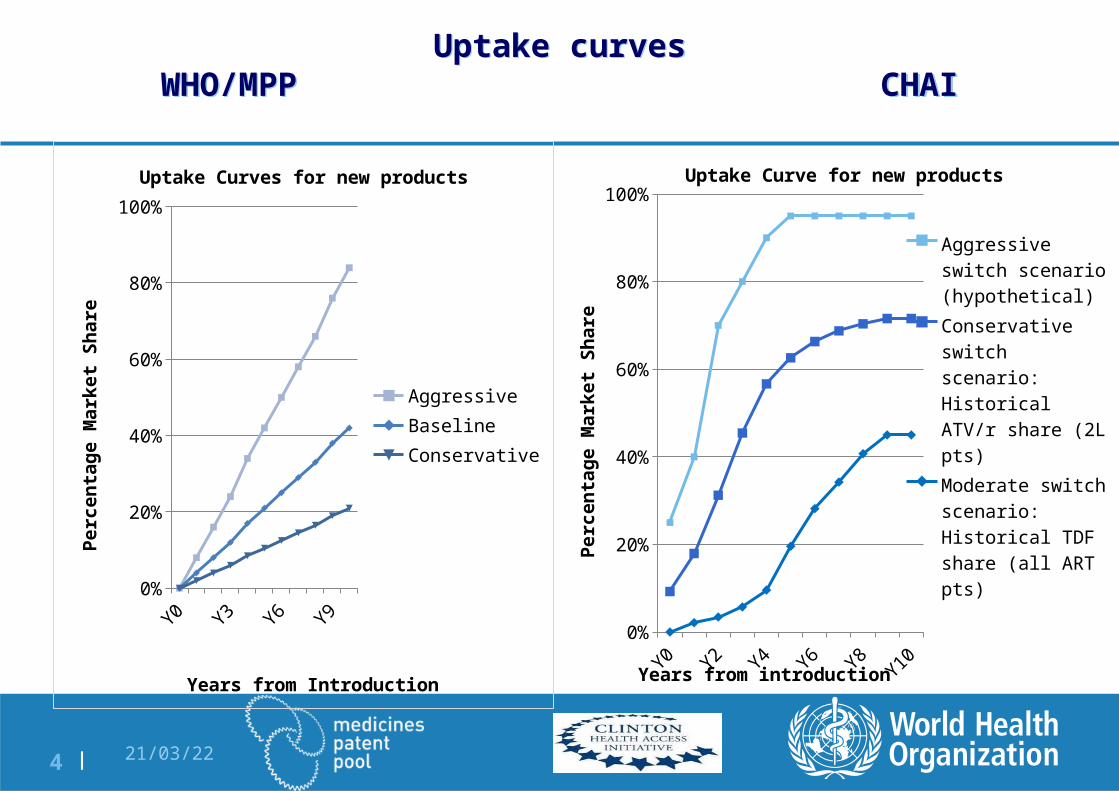
Uptake curvesWHO/MPP CHAI
Uptake curvesWHO/MPP CHAI
Y0 Y2 Y4 Y6 Y8 Y10
0%
20%
40%
60%
80%
100%
Uptake Curves for new products
AggressiveBaselineConservative
Years from Introduction
Perc
enta
ge M
arke
t Sha
re
Y0 Y2 Y4 Y6 Y8Y10
0%
20%
40%
60%
80%
100%Uptake Curve for new products
Aggressive switch scenario (hypothet-ical)Conservative switch scenario: Historical ATV/r share (2L pts)Moderate switch scenario: Historical TDF share (all ART pts)
Years from introduction
Pe
rce
nta
ge
Ma
rke
t S
ha
re
18 April 20235 |
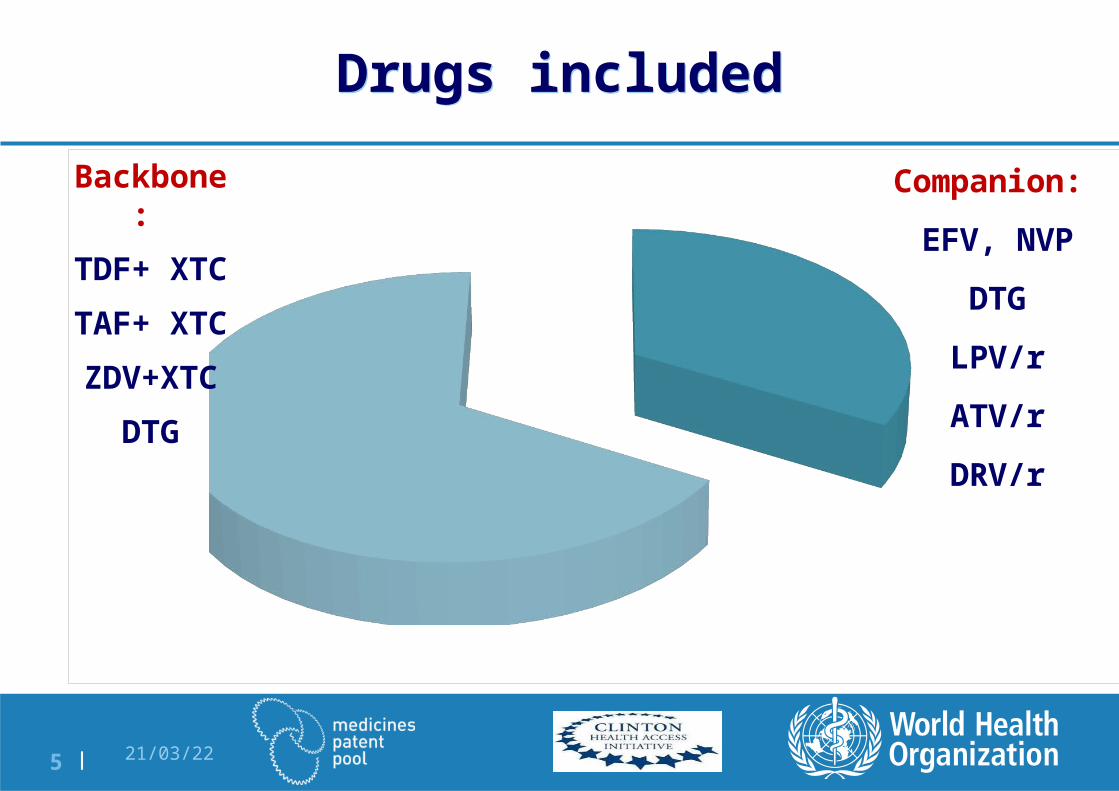
Drugs includedDrugs included
Companion:
EFV, NVP
DTG
LPV/r
ATV/r
DRV/r
Backbone:
TDF+ XTC
TAF+ XTC
ZDV+XTC
DTG
18 April 20236 |
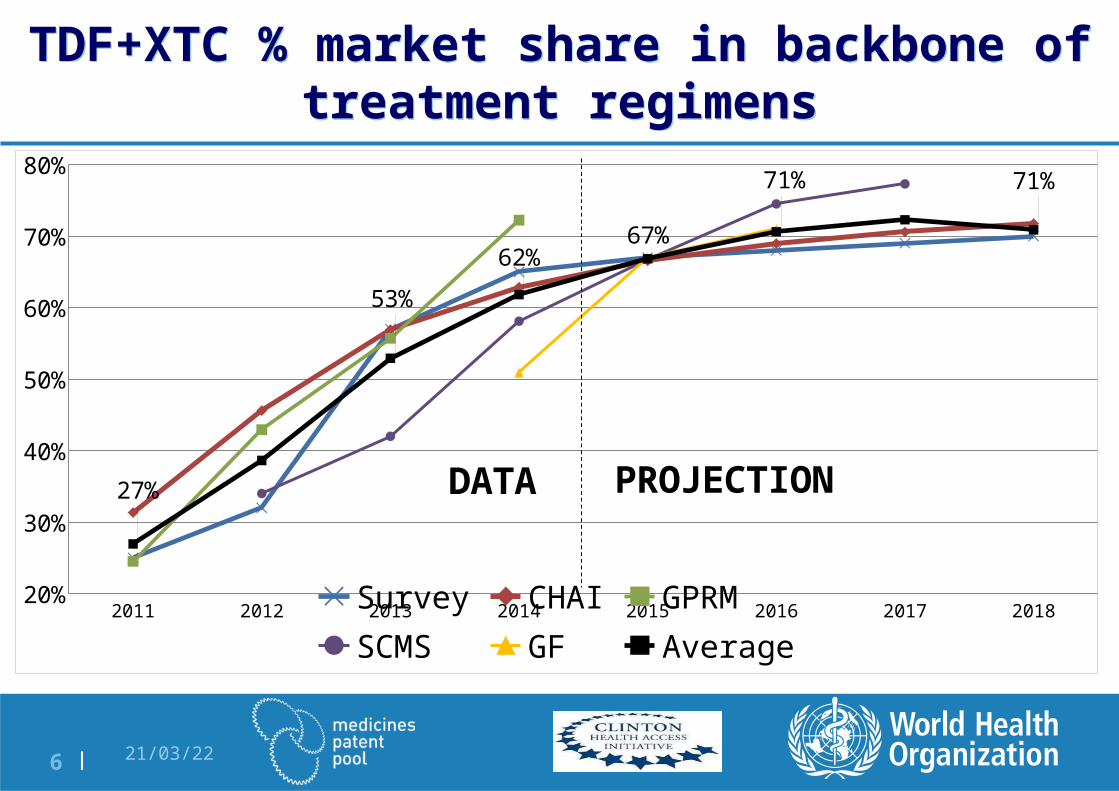
TDF+XTC % market share in backbone of treatment regimens
TDF+XTC % market share in backbone of treatment regimens
2011 2012 2013 2014 2015 2016 2017 201820%
30%
40%
50%
60%
70%
80%
27%
53%
62%67%
71% 71%
Survey CHAI GPRM SCMS GF Average
DATA PROJECTION

18 April 20237 |
Percent of people on first line treatment taking TAF, TDF and ZDV
Percent of people on first line treatment taking TAF, TDF and ZDV
201520162017201820192020202120222023202420250%
10%
20%
30%
40%
50%
60%
70%
80%
90%
100%
32%23%
15%8%
1% 0%
62%63%
66%
55%
44%
29%
13%
31%
49%
65%
MPP-WHO
AZT TDF TAF
201520162017201820192020202120222023202420250%
10%
20%
30%
40%
50%
60%
70%
80%
90%
100%
31% 26% 25% 25% 25% 25%
69% 74%
56%
22%
8% 4%
0.18562874251497
0.5257142857142860.67213114754098
40.71122994652406
4
CHAI
AZT TDF TAF
18 April 20238 |
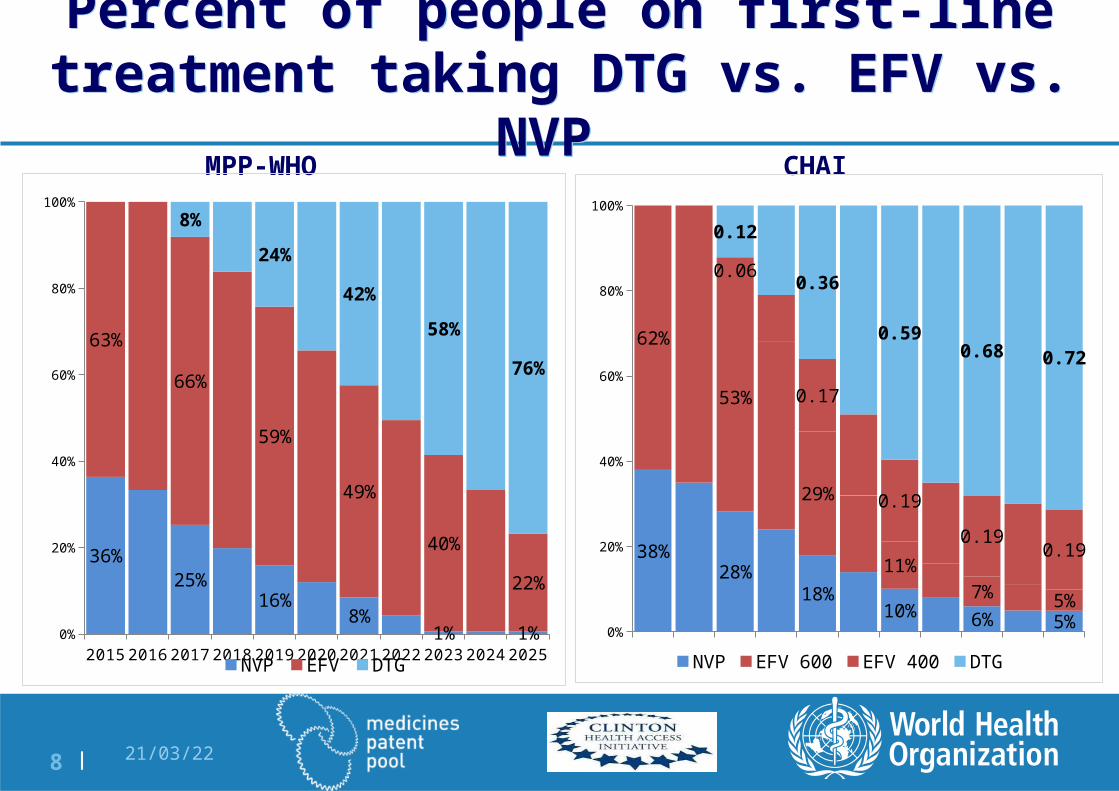
Percent of people on first-line treatment taking DTG vs. EFV vs. NVP
Percent of people on first-line treatment taking DTG vs. EFV vs. NVP
MPP-WHO CHAI
2015 2016 2017 2018 2019 2020 2021 2022 2023 2024 20250%
20%
40%
60%
80%
100%
36%25%
16%8%
1% 1%
63%
66%
59%
49%
40%
22%
8%
24%
42%
58%
76%
NVP EFV DTG2015 2016 2017 2018 2019 2020 2021 2022 2023 2024 2025
0%
20%
40%
60%
80%
100%
38%28%
18%10% 6% 5%
62%
53%
29%
11%
7% 5%
0.06
0.17
0.19
0.190.19
0.12
0.36
0.590.68 0.72
NVP EFV 600 EFV 400 DTG

18 April 20239 |
DTG, AZT, TDF, and TAF/XTC in backbone of second-line treatment
DTG, AZT, TDF, and TAF/XTC in backbone of second-line treatment
2015 2016 2017 2018 2019 2020 2021 2022 2023 2024 20250%
10%
20%
30%
40%
50%
60%
70%
80%
90%
100%
31% 32% 30%
44%38%
29%
61% 57%
43%21%
16%
12%
0.0360.0984 0.11975 0.152925 0.174150.04560.096
0.15535
0.233125
0.329075
MPP-WHO
AZT TDF TAF DTG
2015 2016 2017 2018 2019 2020 2021 2022 2023 2024 20250%
10%
20%
30%
40%
50%
60%
70%
80%
90%
100%
46% 42%
18%6% 3% 3%
54%
39%
25%
15%12% 11%
0.19
0.57
0.790.85 0.87
CHAI
AZT TDF DTG
18 April 202310 |
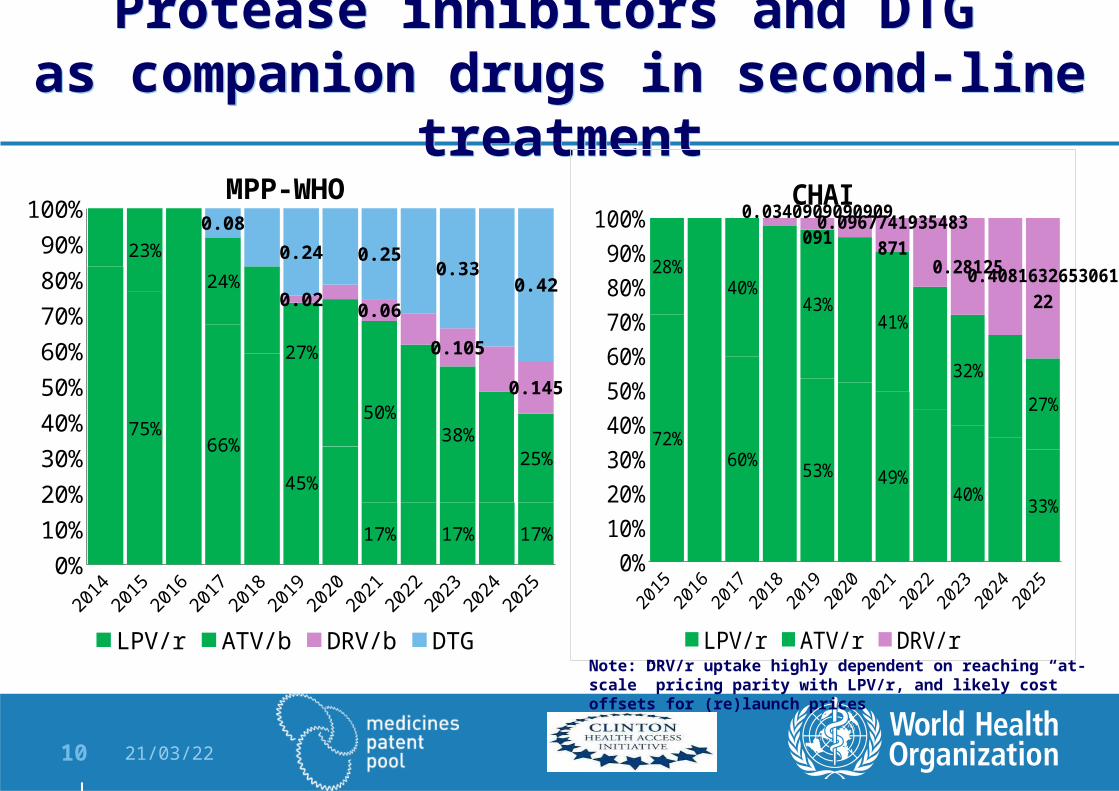
Protease inhibitors and DTG as companion drugs in second-line treatment
Protease inhibitors and DTG as companion drugs in second-line treatment
2014
2015
2016
2017
2018
2019
2020
2021
2022
2023
2024
2025
0%10%20%30%40%50%60%70%80%90%100%
75%66%
45%
17% 17% 17%
23%
24%
27%
50%38%
25%
0.08
0.24 0.250.33
0.420.02 0.06
0.105
0.145
MPP-WHO
LPV/r ATV/b DRV/b DTG
201520162017201820192020202120222023202420250%10%20%30%40%50%60%70%80%90%100%
72%60% 53% 49%
40%33%
28%40%
43%41%
32%
27%
0.03409090909090910.096774193548387
10.28125
0.408163265306122
CHAI
LPV/r ATV/r DRV/rNote: DRV/r uptake highly dependent on reaching “at-scale” pricing parity with LPV/r, and likely cost offsets for (re)launch prices
18 April 202311 |
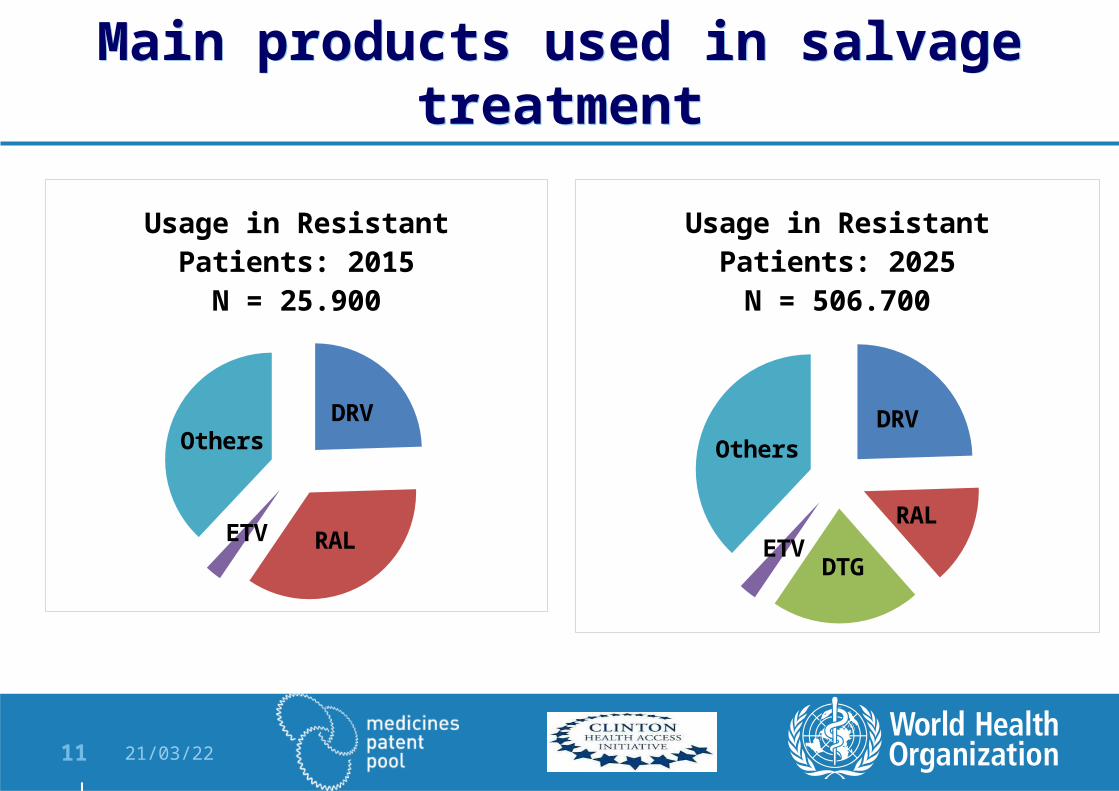
Main products used in salvage treatmentMain products used in salvage treatment
DRV
RALETV
Others
Usage in Resistant Patients: 2015
N = 25.900
DRV
RAL
DTGETV
Others
Usage in Resistant Patients: 2025N = 506.700

18 April 202312 |
TAF TDF AZT NVP EFV LPV ATV DRV DTG RAL0.0
2.0
4.0
6.0
8.0
10.0
12.0
14.0
16.0
18.0
9.8
4.8 5.1
8.9
0.4 0.1
8.8
3.95.0
8.1
0.4 0.2
ARV use in 2015 - Million People by Active Ingredient
2015 MPP/WHO 2015 CHAI
18 April 202313 |
TAF TDF AZT NVP EFV LPV ATV DRV DTG RAL0.0
2.0
4.0
6.0
8.0
10.0
12.0
14.0
16.0
18.0
5.1
13.5
2.6 2.2
11.0
0.9 1.10.3
7.9
0.2
5.1
7.7
4.3
2.4
6.6
0.5 0.4 0.1
9.1
<0.1
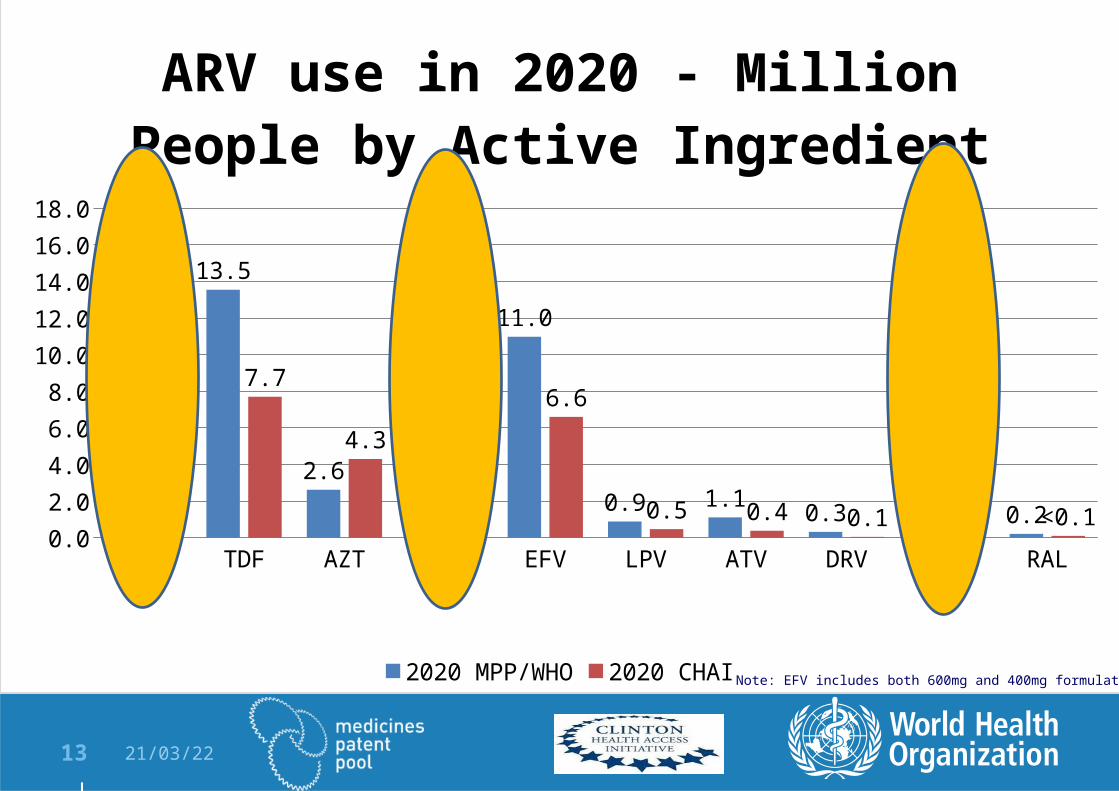
ARV use in 2020 - Million People by Active Ingredient
2020 MPP/WHO 2020 CHAI Note: EFV includes both 600mg and 400mg formulations

18 April 202314 |
TAF TDF AZT NVP EFV LPV ATV DRV DTG RAL0.0
2.0
4.0
6.0
8.0
10.0
12.0
14.0
16.0
18.0
13.5
5.9
1.90.6
4.1
0.5 0.7 0.7
17.6
0.1
13.3
0.7
4.7
0.9
4.5
0.3 0.3 0.4
14.6
<0.1
ARV use in 2025 - Million People by Active Ingredient
2025 MPP/WHO 2025 CHAI Note: EFV includes both 600mg and 400mg formulations
18 April 202315 |
ConclusionConclusion
Our forecasts include a mix of judgement and data
Areas of convergence are useful to inform action
Until more data become available, production of the current generation of ARVs needs to continue, and increase, to ensure that all necessary drugs will remain available.