Embed Size (px)
Citation preview
Dementia in Acute Hospitals
George Tadros
Consultant in Old Age Liaison Psychiatry, Clinical Director of
Urgent Care, Birmingham, UK
Professor of Liaison Psychiatry and Dementia, Aston
Medical School, Aston University
Visiting Professor of Dementia Care in Acute Hospitals,
Chester University

Current UK estimates for female life expectancy at birth are 83.0 years and 79.3 years for men.
But, estimates at the age of 65 are 86.1 for women and 83.6 for men.
People currently aged 75 can expect to live an average of 13.0 years (for women) and 11.2 years for men
By 2040, nearly one in four people in the UK will be aged 65 or over.
A baby born in 2011 is almost eight times more likely to reach 100 than one born in 1931.
Nearly one in five people currently in the UK will live to see their 100th birthday.
In 2011, 32% of people aged 65 and over who were admitted to hospital were found to be malnourished at the time of admission.
In 2010, 21% of adult inpatients in England said that they were not always treated with respect for their dignity. This result has not improved since the first survey in 2002 (!!!).
Population projections

16 million adults admitted to hospital last year, almost 8 million (47%) were aged 65+.
Up to 60% of older people in hospital have mental health problems or develop them during their stay
Older people occupy two third of NHS beds!!
48% for reasons other than the need for acute medical intervention
30-50% have dementia, delirium or other cognitive impairment.
National Audit Office; More people with dementia in acute hospital beds than in mental health beds,
Only 41% had received an assessment of mental state of any sort. 4
70% of older people referrals to liaison services are not under the care of mental health services. 5
Length of Stay in Acute Hospitals 2000-2010,
hospital stay for 60-74 increased by 50%, over 75 by 66%.
500beds hospital would have 5,000 admissions/annum, of whom 3,000 will have or will develop a mental disorders.
In a typical acute hospital (500 beds), failure to organize dementia liaison services leads to excess cost of
£6m/year
Of people aged over 70 admitted to an acute hospital
• 27% have previously diagnosed dementia
• 50% have cognitive impairment
• 27% have delirium
• 24% have possible major depression
• 8% have definite major depression
Hospital care

Dementia and Outcome
measures The majority of mental co-morbidity in acute hospital affecting older people is due
to three disorders: Dementia,
Depression
Delirium.
But, only 2-3% of older people admissions to acute hospitals are referred for a
psychiatric opinion; elderly are less likely to be referred to liaison psychiatry than younger people in
relation to the proportion of beds they occupy. 8
Mental disorder in older adults is a predictor of:
Increased LOS
Increased readmissions
Increased Institutionalism (impacting on performance and efficiency)
Increased mortality
Increased falls
Other poorer outcomes
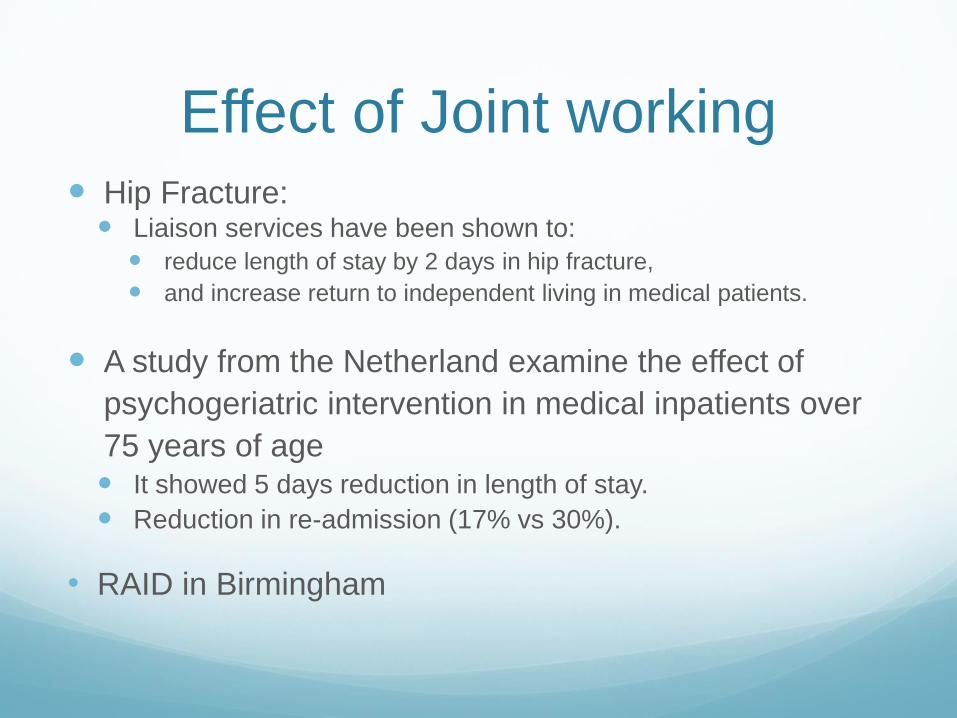
Effect of Joint working Hip Fracture: Liaison services have been shown to:
reduce length of stay by 2 days in hip fracture,
and increase return to independent living in medical patients.
A study from the Netherland examine the effect of
psychogeriatric intervention in medical inpatients over
75 years of age It showed 5 days reduction in length of stay.
Reduction in re-admission (17% vs 30%).
• RAID in Birmingham

Undiagnosed
Dementia in
Acute Hospitals
Age Group AMT< 8 %
75- < 80 49/192 26
80- <85 106/288 37
85- <90 178/369 48
90- <95 102/207 49
95- <100 32/48 67
100+ 2/3 67
Total 469/1107 42%
• Dr. A Michael, 2014
• Russell Hall Hospital, Dudley, West Midlands
• 1107 patients admitted to acute hospital
• No known history of dementia on admission.
• 42% screen positive for dementia
• Q Whether there is Delirium?
• Q Where is the link between community care and hospital care?

Hospitals on the
edge.
Can our hospitals or even NHS
survive without better and more
effective dementia care?
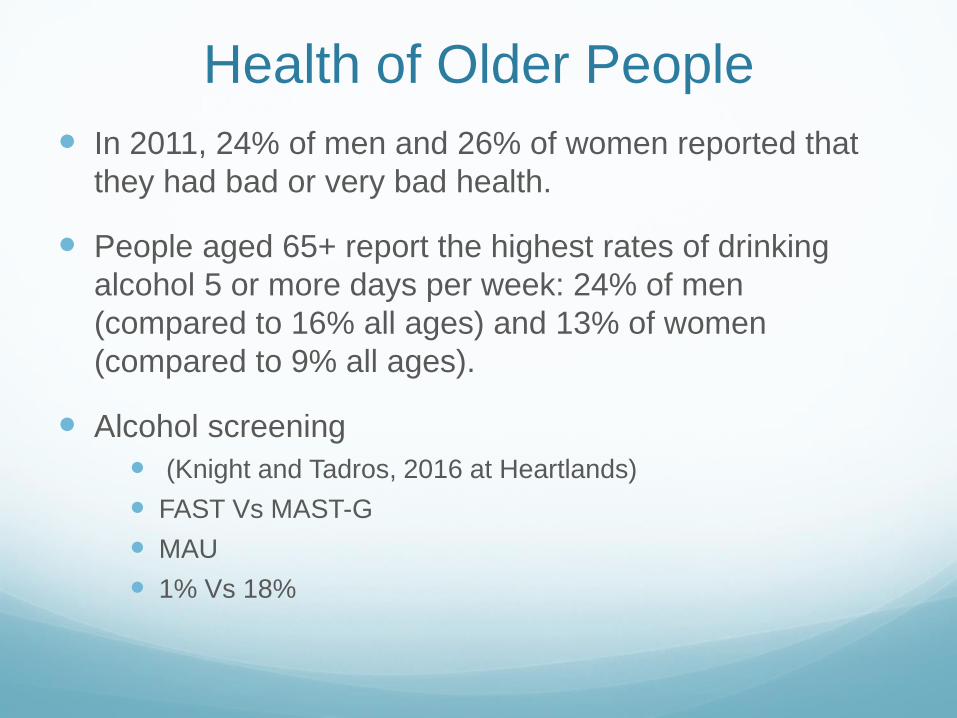
In 2011, 24% of men and 26% of women reported that
they had bad or very bad health.
People aged 65+ report the highest rates of drinking
alcohol 5 or more days per week: 24% of men
(compared to 16% all ages) and 13% of women
(compared to 9% all ages).
Alcohol screening
(Knight and Tadros, 2016 at Heartlands)
FAST Vs MAST-G
MAU
1% Vs 18%
Health of Older People
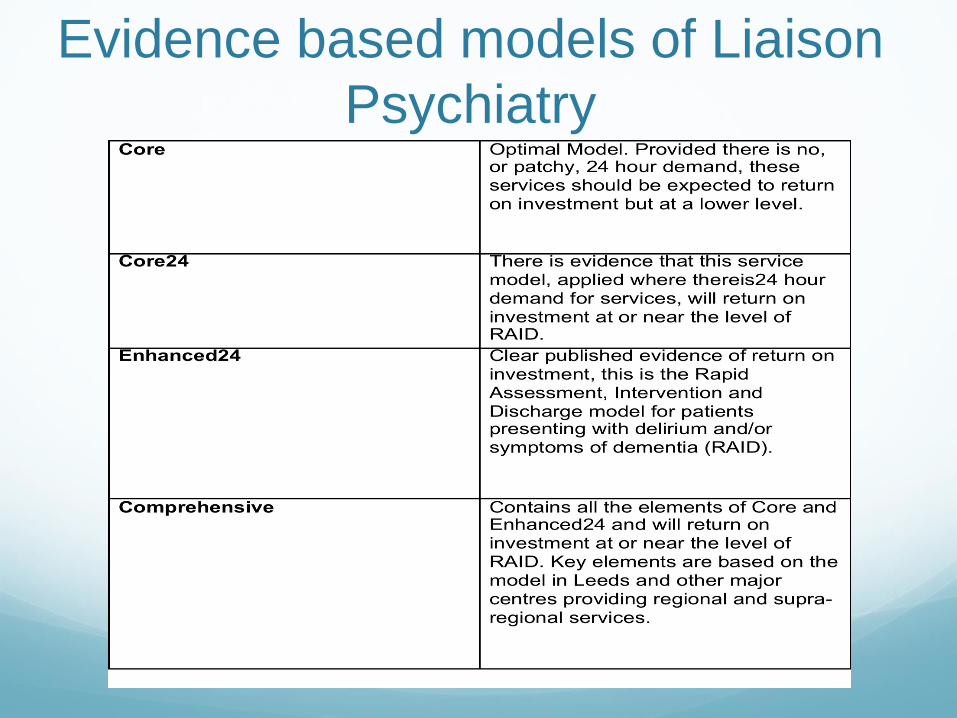
Evidence based models of Liaison
Psychiatry
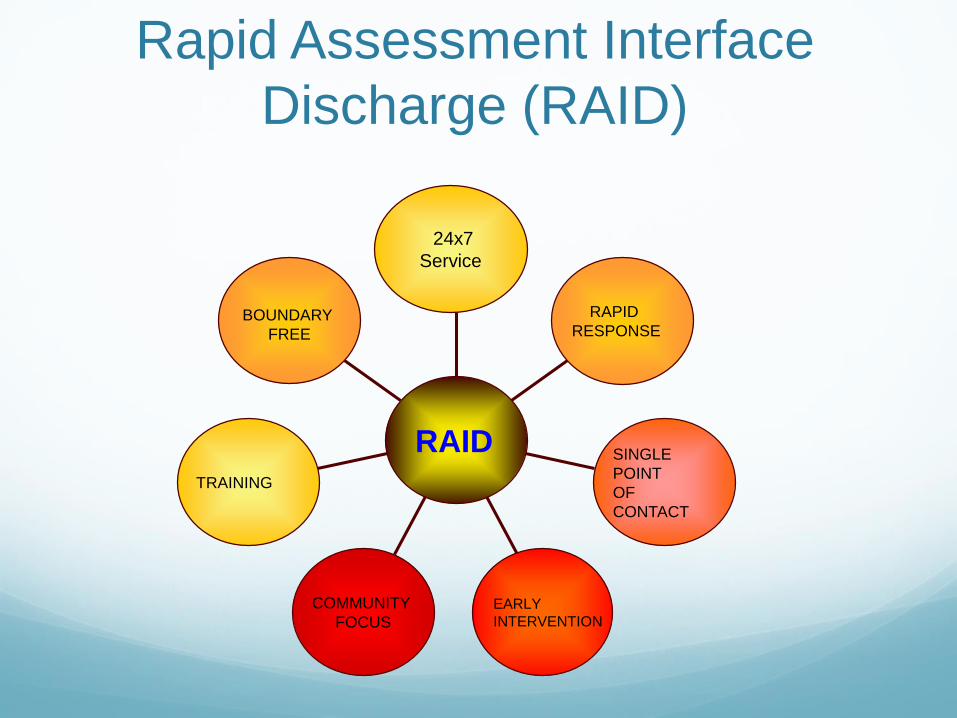
Rapid Assessment Interface
Discharge (RAID)
BOUNDARY
FREE
TRAINING
COMMUNITY
FOCUS
EARLY
INTERVENTION
SINGLE
POINT
OF
CONTACT
RAPID
RESPONSE
24x7
Service
RAID

Top 7 reasons for referral (all age
groups; 350 referrals/month)
Deliberate self harm32%
Depression18%
Alcohol misuse13%
Psychosis9%
Dementia/ Confusion
18%
Drug misuse4%
Anxiety6%
Deliberate self harm
Depression
Alcohol misuse
Psychosis
Dementia/ Confusion
Drug misuse
Anxiety

A&E Response
Targets Met; 73%
Targets Not Met; 7%
Not Assessed; 3%
Not Recorded; 17%
Targets Met
Targets Not Met
Not Assessed
Not Recorded

Ward Response
Target Met;
83%
Target Not Met; 10%
Not Assessed;
1% Not Recorded;
6%
Target Met
Target Not Met
Not Assessed
Not Recorded

Teaching and
evaluation
Very poor; 0%
Poor; 0% Neutral; 3%
Good; 36%
Excellent; 61%
Very poor
Poor
Neutral
Good
Excellent
4Ds (Dementia, Depression,
Delirium and Dignity).
2 days training with a month
gap for theory application.
Day 1; theory and scales for
measuring.
Day 2: Management including
BPSD
Feedback and evaluation.
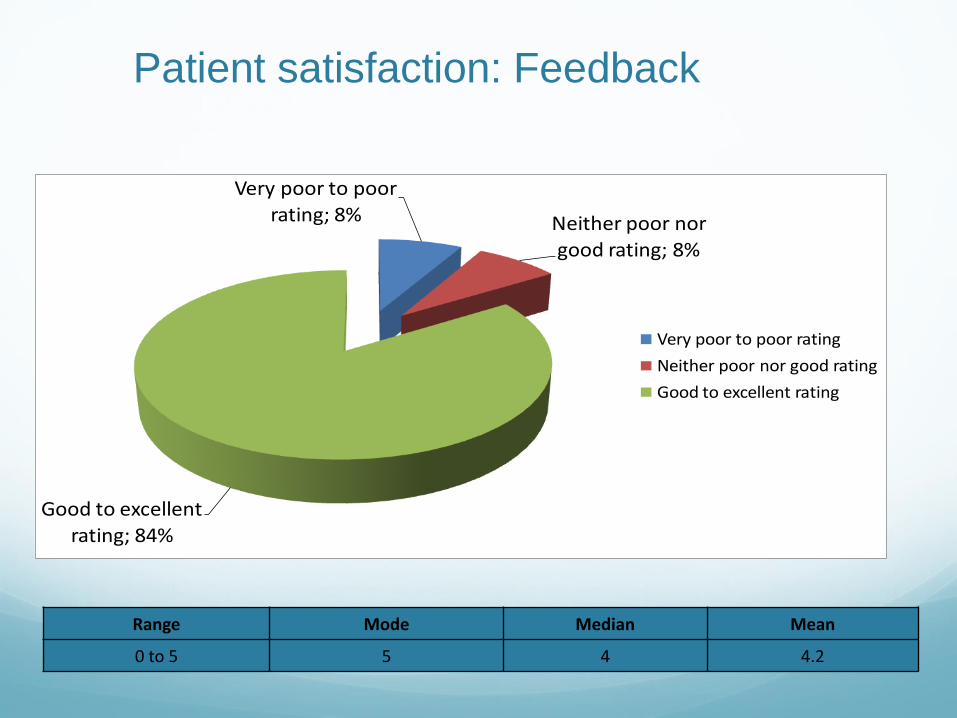
Patient satisfaction: Feedback
Very poor to poor
rating; 8% Neither poor nor
good rating; 8%
Good to excellent
rating; 84%
Very poor to poor rating
Neither poor nor good rating
Good to excellent rating
Range Mode Median Mean
0 to 5 5 4 4.2

Staff satisfaction: Feedback
Range Mode Median Mean
2.5 to 5 5 4 4.2
Liaison with other services; 7%
Providing information to patient; 10%
Advice on medication; 11%
Support to patient; 10%
Signposting; 4%Information sharing; 7%
Education; 7%
Support of staff; 11%
Support tofamily/carers; 17;
8.17%
Advice on managing patients; 12%
Referral to other services; 8%
Other; 5%

Savings and wider financial Benefits
Outcomes
Considered in this Study
1. Inpatient LoS
2. Readmission rates
3. Admission avoidance
Potential Benefits of RAID
Security
Social care £
Complaints
Patient satisfaction
Acute staff confidence in
dealing with MH conditions
Staff satisfaction
Staff sickness
Demand for community MH services
Discharge destination
Acute staff trainingQuality
Referring / Signposting to
community MH services
SUIs
MH outcomes
A&E savings
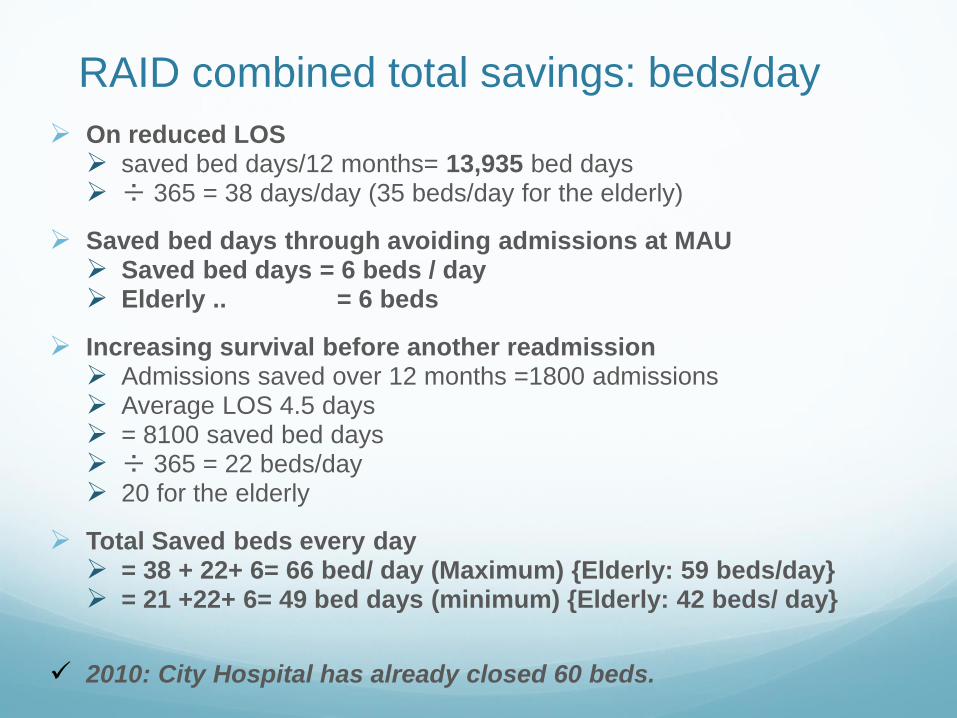
RAID combined total savings: beds/day
On reduced LOS saved bed days/12 months= 13,935 bed days ÷ 365 = 38 days/day (35 beds/day for the elderly)
Saved bed days through avoiding admissions at MAU Saved bed days = 6 beds / day Elderly .. = 6 beds
Increasing survival before another readmission Admissions saved over 12 months =1800 admissions Average LOS 4.5 days = 8100 saved bed days ÷ 365 = 22 beds/day 20 for the elderly
Total Saved beds every day = 38 + 22+ 6= 66 bed/ day (Maximum) {Elderly: 59 beds/day} = 21 +22+ 6= 49 bed days (minimum) {Elderly: 42 beds/ day}
2010: City Hospital has already closed 60 beds.
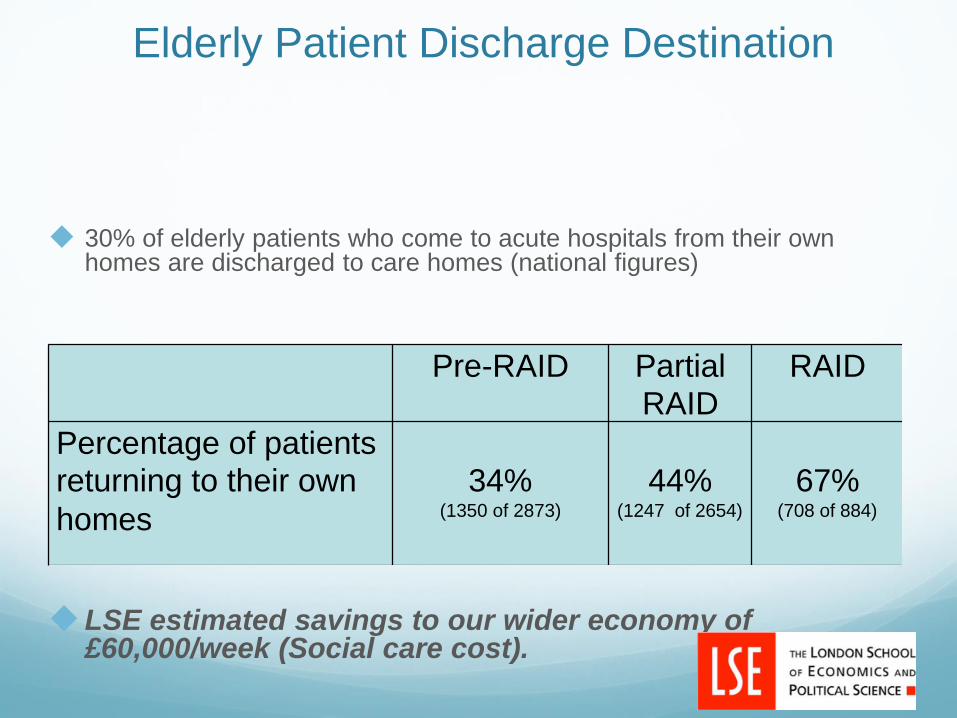
Elderly Patient Discharge Destination
30% of elderly patients who come to acute hospitals from their own homes are discharged to care homes (national figures)
LSE estimated savings to our wider economy of £60,000/week (Social care cost).
Pre-RAID Partial RAID
RAID
Percentage of patients returning to their own
homes
34%
(1350 of 2873)
44%
(1247 of 2654)
67%
(708 of 884)

Independent evaluation by London
school of Economics, August 2011 Very thorough, detailed and vigorous review but
conservative estimation
Total savings: £3.55 million to NHS
At least 44 beds/day
£60,000/week to social care cost
Money value Cost : return = £1: £4
RAID expanded in Birmingham to 5 acute hospitals across three acute Trust, 3600 beds
Now RAID is being implemented in over 27 trusts across the country.
RAID National Network, 600 members.
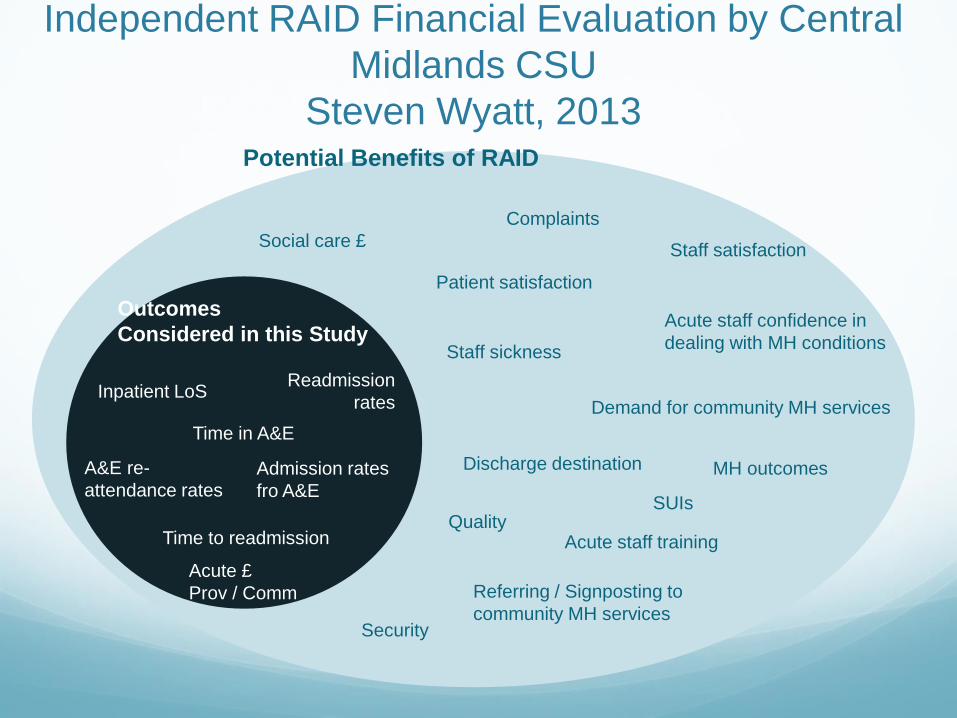
Independent RAID Financial Evaluation by Central
Midlands CSU
Steven Wyatt, 2013
Outcomes
Considered in this Study
Inpatient LoSReadmission
rates
Time in A&E
Admission rates
fro A&E
A&E re-
attendance rates
Time to readmission
Acute £
Prov / Comm
Potential Benefits of RAID
Security
Social care £
Complaints
Patient satisfaction
Acute staff confidence in
dealing with MH conditions
Staff satisfaction
Staff sickness
Demand for community MH services
Discharge destination
Acute staff trainingQuality
Referring / Signposting to
community MH services
SUIs
MH outcomes

A&E Activity Outcomes – Concurrent Controls
Outcome Cases ControlsDifference
(95% CI)Notes
Admission from A&E 13.7% 22.4% 8.7%(6.8% - 10.6%)
Sig. at 99%
Average Duration in A&E 4h 20m 2h 43m 97m(83m – 111m)
Sig. at 99%
Average Number of Re-
attendances within 28 days*1.14 0.64 0.50
(0.40 to 0.61)Sig. at 99%
Average Number of Re-
attendances within 90 days*2.20 1.53 0.67
(0.57 to 0.78)Sig. at 99%
* Applies to subset of cases seen between July 2012 and November 2012

Commissioner Cost Provider Cost
Cases Controls Cases Controls
All 2626 2626 2626 2626
14% 22% 14% 22%
Admitted 359 588 359 588
90% 91% 90% 90%
Located & Costed 322 537 324 530
@£890 @£1,391 @£1,049 @£1,615
Cost 286,573 746,998 339,912 855,847
÷0.90 ÷0.91 ÷0.90 ÷0.90
Grossed -Up Cost 319,502 817,942 376,631 949,505
Difference -498,440 -572,875
A&E Financial Outcomes – Concurrent Controls

Inpatient Activity Outcomes – Concurrent
Controls
Outcome Cases ControlsDifference
(95% CI)Notes
Average Length of Stay
Days5.7 6.3 0.6
(0.5 to 0.7)Sig. at 99%
Average Number of Re-
admissions within 28 days*0.28 0.31 -0.03
(-0.01 to -0.05)Sig. at 99%
Average Number of Re-
admissions within 90 days*0.80 0.72 0.08
(0.04 to 0.13)Sig. at 99%
* Applies to subset of cases seen between July 2012 and November 2012.

Commissioner Cost Provider Cost
Cases Controls Cases Controls
All* 33,750 33,750 33,750 33,750
93,1% 93.1% 93.1% 93.1%
Matched 31,414 31,414 31,414 31,414
99.0% 99.0% 99.6% 99.6%
Located & Costed 31,093 31,093 31,296 31,296
@£1,629 @£1,678 @£2,080 @£2,238
Cost 50,656,320 52,162,644 65,110,245 70,042,352
Difference 1,506,323 4,923,107
÷0.990÷0.931 ÷0.996÷0.931
Grossed-Up
Difference1,635,107 5,318,846
* To avoid double counting, this number excludes cases seen by RAID in AE and then admitted
Inpatient Financial Outcomes – Concurrent Controls
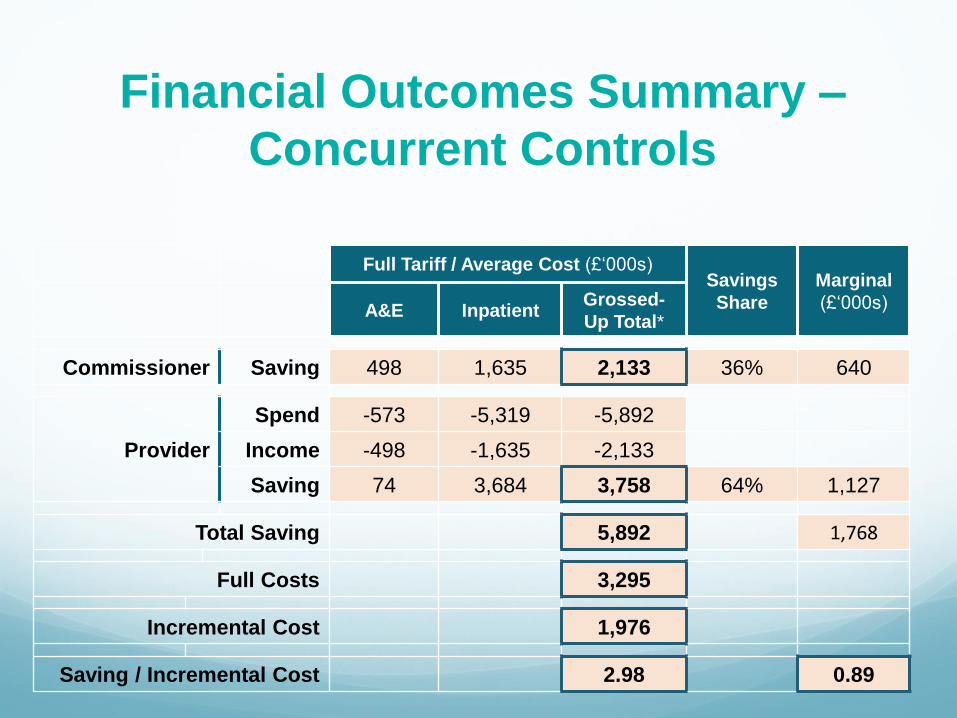
Financial Outcomes Summary –
Concurrent Controls
Full Tariff / Average Cost (£‘000s)Savings
Share
Marginal
(£‘000s)A&E InpatientGrossed-
Up Total*
Commissioner Saving 498 1,635 2,133 36% 640
Provider
Spend -573 -5,319 -5,892
Income -498 -1,635 -2,133
Saving 74 3,684 3,758 64% 1,127
Total Saving 5,892 1,768
Full Costs 3,295
Incremental Cost 1,976
Saving / Incremental Cost 2.98 0.89

Activity Outcomes by Site
Site Admission via A&E Length of Stay
cases controls diff cases controls diff
Heartlands 14.3% 28.7% -14.4% 6.1 7.4 -1.3
Good Hope 19.4% 29.2% -9.8% 7.2 7.7 -0.5
Solihull 20.2% 11.2% +9.0% 5.2 5.8 -0.6
City 11.4% 17.3% -5.9% 3.9 4.6 -0.7
UHB 10.9% 19.1% -8.2% 6.3 6.3 0.0
All 13.7% 22.4% -8.7% 5.7 6.3 -0.6

Financial Outcomes by Site (£’000s)
All HoEFT City UHB
Full Cost 3,295 1,748 748 798
Incremental Cost 1,976 997 465 513
Commissioner Savings AE -498 -322 -109 -69
Provider Savings AE -74 -31 26 -80
Commissioner Savings IP -1,635 -1,494 -293 162
Provider Savings IP -3,684 -3,161 -1,028 535
Total Savings -5,892 -5,008 -1,404 549
Net Savings (@ full cost) -2,597 -3,261 -656 1,347
Net Savings (@ incremental cost) -3,916 -4,011 -939 1,062
Savings / Full Cost 1.79 2.87 1.88 -0.69
Savings / Incremental Cost 2.98 5.02 3.02 -1.07

Number of patients with a Mental Health Diagnosis – Dementia Delirium and Depression (Retrospective case notes and Screened
patients
0
100
200
300
400
500
600
700
800
900
1000
Retrospec veData-10.4% Prospec veData-58.8%;14.6%
1000
750
0
450
104 75
NumberofPeo
ple
TotalNumberofPa ents RAIDScreendiagnosis CasenotesDiagnosis
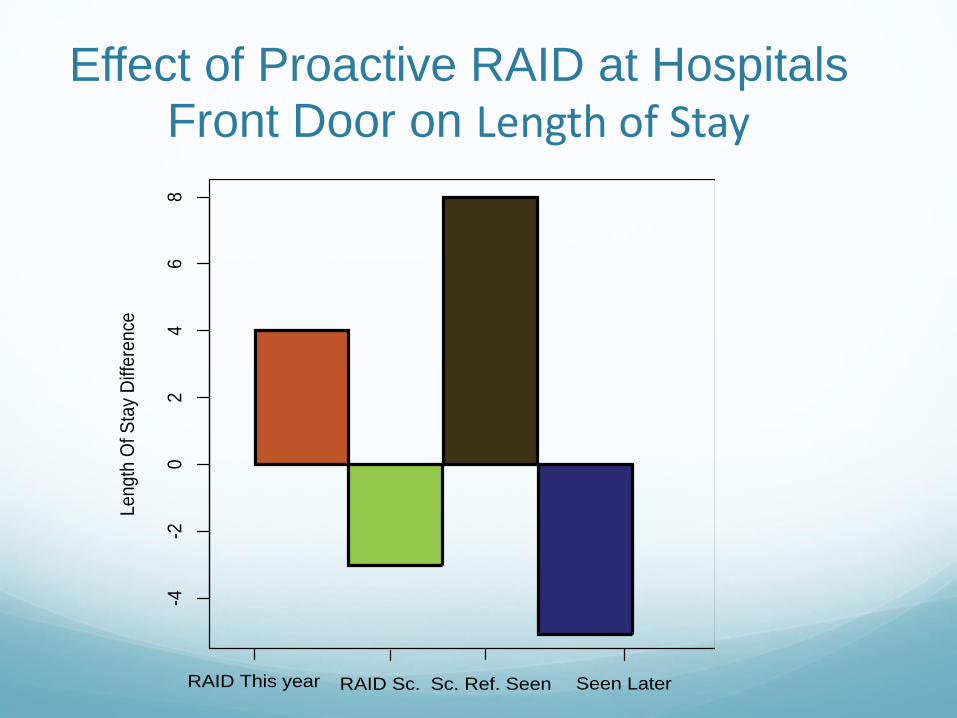
Effect of Proactive RAID at Hospitals Front Door on Length of Stay
-4-2
02
46
8
Le
ng
th O
f S
tay
Diff
ere
nce
RAID This year RAID Sc. Sc. Ref. Seen Seen Later

32
Strategy Unit
Midlands and Lancashire CSU
www.midlandsandlancashirecsu.nhs.uk
There is an increasing number of crises
There were an average of
848 mental health crises
per month in 2012/13
The average number of
crises has increased by
38% since 2012/13 to
1,168 per month in
2016/17

33
Strategy Unit
Midlands and Lancashire CSU
www.midlandsandlancashirecsu.nhs.uk
0
200
400
600
800
1000
1200
1400
1600
1800
Jul-1
2
Sep-1
2
No
v-1
2
Jan-1
3
Ma
r-1
3
Ma
y-1
3
Jul-1
3
Sep-1
3
No
v-1
3
Jan-1
4
Ma
r-1
4
Ma
y-1
4
Jul-1
4
Sep-1
4
No
v-1
4
Jan-1
5
Ma
r-1
5
Ma
y-1
5
Jul-1
5
Sep-1
5
No
v-1
5
Jan-1
6
Ma
r-1
6
Ma
y-1
6
Jul-1
6
Sep-1
6
No
v-1
6
Jan-1
7
Ma
r-1
7
Ma
y-1
7
Jul-1
7
Sep-1
7
No
v-1
7
Jan-1
8
Ma
r-1
8
Nu
mb
er
of
Cri
sis
Month
Actual Forecast Lower Prediction Interval Upper Prediction Interval
Crises are likely to increase in the future if nothing changes
(includes seasonal adjustments)Activity is projected to
increase by an additional
11% in 2017/18 from
activity in the first 6
months of 2016/17
34
Strategy Unit
Midlands and Lancashire CSU
www.midlandsandlancashirecsu.nhs.uk
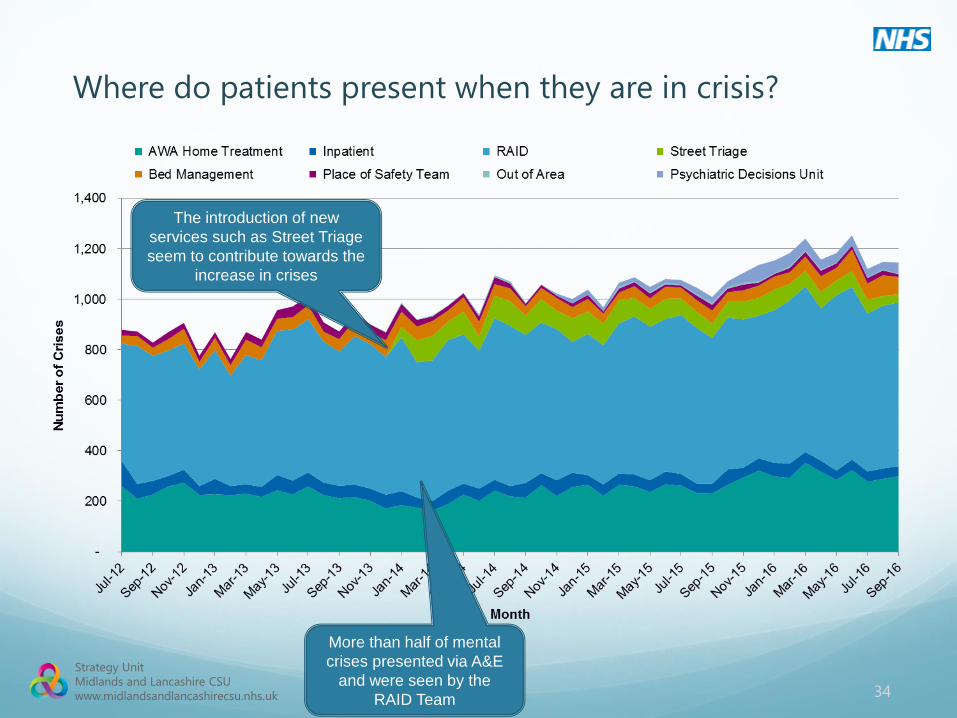
Where do patients present when they are in crisis?
More than half of mental
crises presented via A&E
and were seen by the
RAID Team
The introduction of new
services such as Street Triage
seem to contribute towards the
increase in crises
35
Strategy Unit
Midlands and Lancashire CSU
www.midlandsandlancashirecsu.nhs.uk
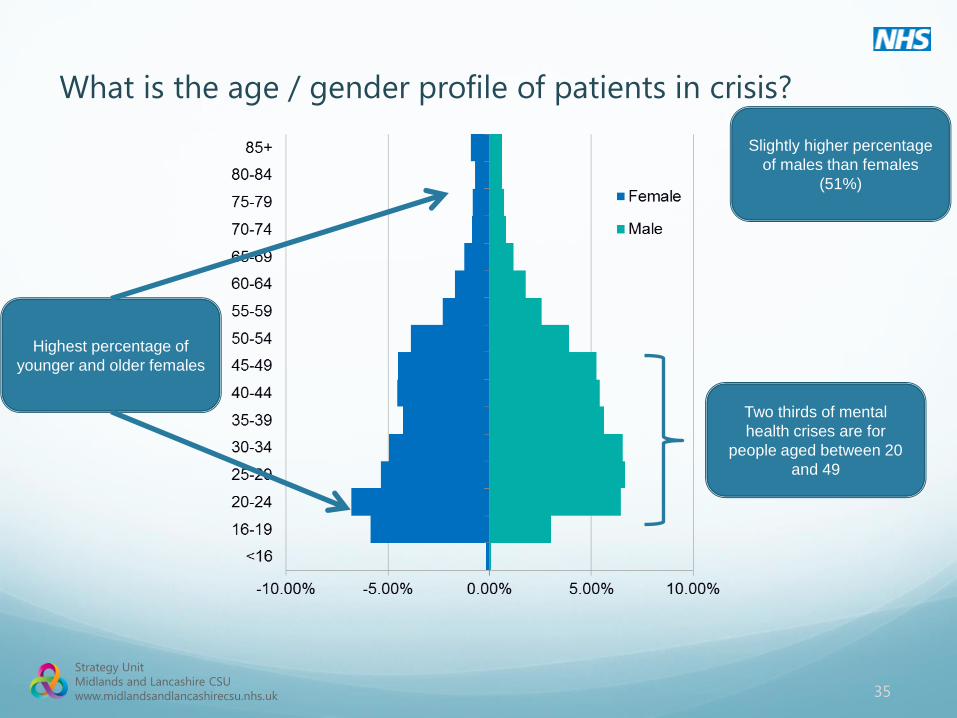
What is the age / gender profile of patients in crisis?
Slightly higher percentage
of males than females
(51%)
Highest percentage of
younger and older females
Two thirds of mental
health crises are for
people aged between 20
and 49

36
Strategy Unit
Midlands and Lancashire CSU
www.midlandsandlancashirecsu.nhs.uk
Are patients in crisis more deprived than the background
population?People with a mental
health crisis live in more
deprived areas than the
general population of
Birmingham and Solihull
The deprivation profile
each year for people who
have a mental health crisis
has not changed
significantly over the years

37
Strategy Unit
Midlands and Lancashire CSU
www.midlandsandlancashirecsu.nhs.uk
On which day of the week do patients in crisis present?
Sundays have the
lowest level of mental
health crises
Wednesdays have the
highest level of mental
health crises
The number of crises that present
on each day of the week are
broadly similar but there are some
marginal differences

38
Strategy Unit
Midlands and Lancashire CSU
www.midlandsandlancashirecsu.nhs.uk
Pathways in and out of crisis (28 days)
There is a large
increase in CMHT
activity 2 days before
a crisis
There are also
increases in other
services
1,964 people had a
CMHT contact the day
after the end of their
crisis

39
Strategy Unit
Midlands and Lancashire CSU
www.midlandsandlancashirecsu.nhs.uk
Do patients have crisis plans in place before their crisis?
0%
10%
20%
30%
40%
50%
60%
70%
80%
90%
100%
Patients Spells
Perc
en
tag
e o
f A
cti
vit
y
Updated <28 days Between 28 and 60 days Updated >60d No Crisis Plan
A third of patents have a crisis plan in place
before their crisis and these are evenly split
between those updated in last 28 days,
updated between 28 and 60 days and
updated more than 60 days before the crisis

40
Strategy Unit
Midlands and Lancashire CSU
www.midlandsandlancashirecsu.nhs.uk
Which community services do people who have a mental
health crisis use?
0.0%
2.0%
4.0%
6.0%
8.0%
10.0%
12.0%
-
10,000
20,000
30,000
40,000
50,000
60,000
70,000
80,000
90,000
100,000
Perc
en
tag
e o
f A
tten
dan
ces
Nu
mb
er
of
Att
en
dan
ces
Community Service
Number Percentage
The majority of Community
activity for people who had a
mental health crisis was with
the Integrated Multidisciplinary
Team
More than 10% of activity for
Integrated Care Community
Wards was for people who had
a mental health crisis
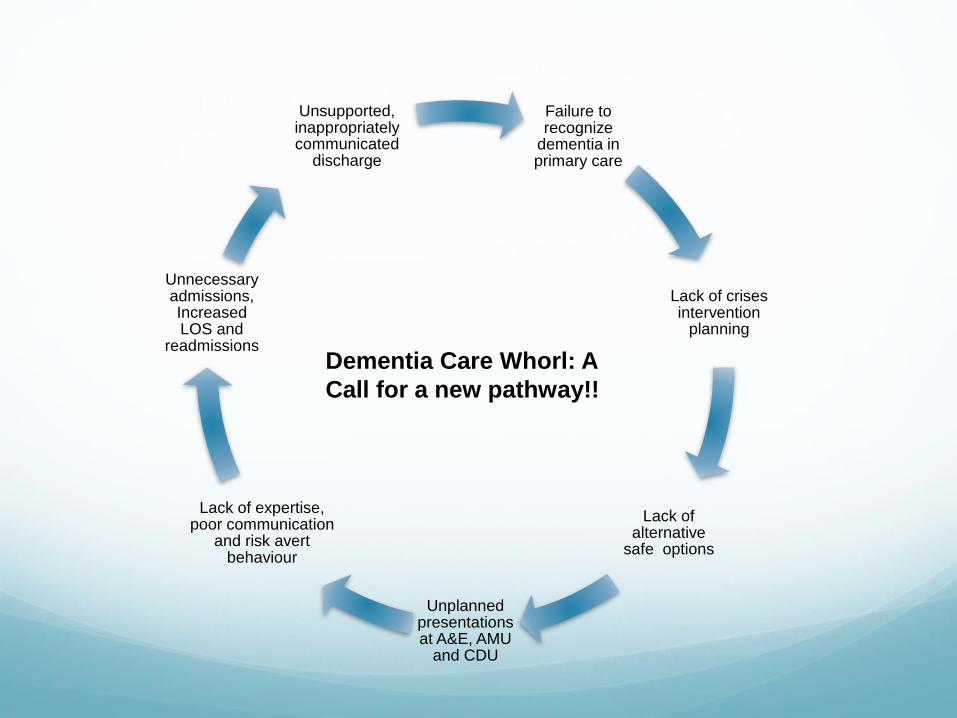
Failure to recognize
dementia in primary care
Lack of crises intervention
planning
Lack of alternative
safe options
Unplanned presentations at A&E, AMU
and CDU
Lack of expertise, poor communication
and risk avert behaviour
Unnecessary admissions, Increased LOS and
readmissions
Unsupported, inappropriately communicated
discharge
Dementia Care Whorl: A
Call for a new pathway!!


Third sector
partnership
Alzheimer’s Society
Free support to a weekly memory
clinic.
Free access information and
carers support weekly.
Alz café
Carers and patients voice.
Volunteers' service
A good numbers of volunteers
Properly governed
Very useful
Charities
Research
Training
Support

Reminiscence Pod
Pop Up Vintage Store
1950’s Pop Up Living Room
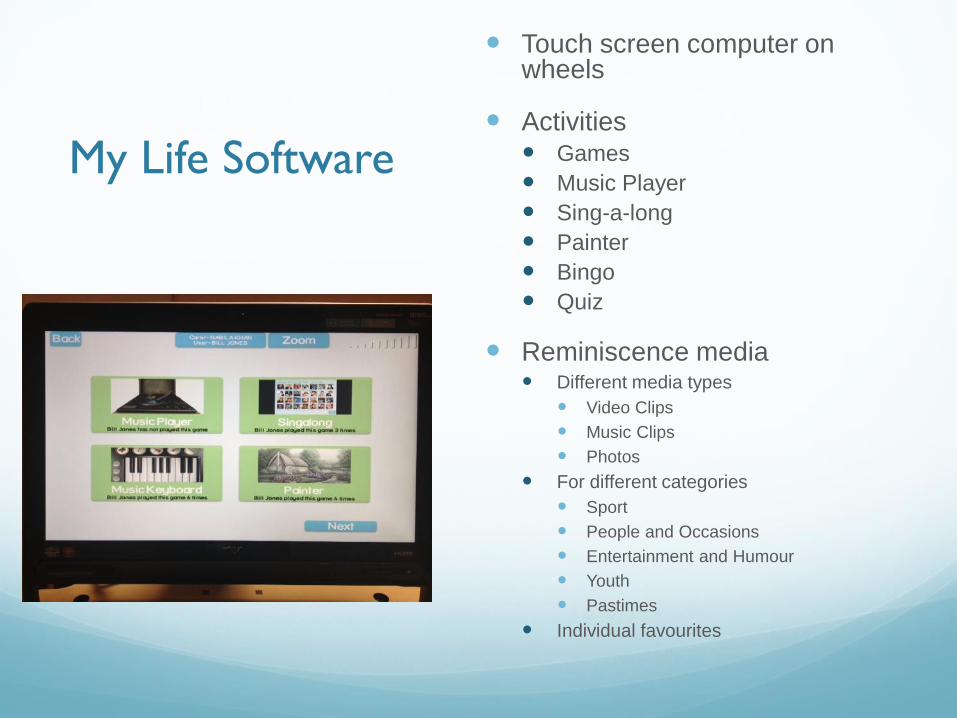
My Life Software
Touch screen computer on wheels
Activities Games
Music Player
Sing-a-long
Painter
Bingo
Quiz
Reminiscence media Different media types
Video Clips
Music Clips
Photos
For different categories
Sport
People and Occasions
Entertainment and Humour
Youth
Pastimes
Individual favourites

E-learning Development
Funding provided by the Academic Health Science Network
(AHSN).
E-learning module aimed at acute hospital staff who are caring for
people with dementia.
The module content was provided by experts in the field and
produced by the company GuyKat, a Birmingham based e-
learning developer.
On going pilot
The finished module will be accredited by the University of
Chester.
Dementia Care in Acute Hospitals: An E-learning training package

Thank You