Embed Size (px)
Citation preview
The costs of tobacco, alcohol and illicit drug abuse to
Australian society in 2004/05by
David J. CollinsMacquarie University
and
Helen M. LapsleyUniversity of Queensland
and
University of New South Wales

ii
The Costs of Tobacco, Alcohol and Illicit Drug Abuse to Australian Society in 2004/05
ISBN: 1-74186-436-4 Online ISBN: 1-74186-437-2 Publications Number: P3-2625
Print Copyright
© Commonwealth of Australia 2008
This work is copyright. Apart from any use as permitted under the Copyright Act 1968,no part may be reproduced by any process without prior written permission from the Commonwealth. Requests and inquiries concerning reproduction and rights should be addressed to the Commonwealth Copyright Administration, Attorney-General’s
at http://www.ag.gov.au/cca
Online Copyright
© Commonwealth of Australia 2008
This work is copyright. You may download, display, print and reproduce this material in unaltered form only (retaining this notice) for your personal, non-commercial use or use within your organisation. Apart from any use as permitted under the Copyright Act 1968,all other rights are reserved. Requests and inquiries concerning reproduction and rights should be addressed to Commonwealth Copyright Administration, Attorney-General’s
at http://www.ag.gov.au/cca
iii
Table of ContentsList of tables vii
List of abbreviations x
Executive Summary xii
Acknowledgments xv
1. Introduction 1
2. General methodological issues in the estimation of the social costs of drug abuse 3
3
2.2 The concept of drug abuse 4
2.3 Abusive and addictive drug use 5
2.4 Demographic and human capital approaches 5
2.5 General equilibrium impacts of drug abuse 7
8
2.7 Costs of consumption of abused drugs 11
2.8 Avoidable costs of drug abuse 11
2.9 The incidence of abuse costs 12
2.10 Active and involuntary smoking 14
2.11 Valuation of life 15
2.12 Pain and suffering 16
2.13 Welfare 16
2.14 Revenue impacts of drug abuse 17
2.15 Research, education and drug program costs 19
3. Availability of new or revised methodologies and data 21
3.1 The impact of the GST on the taxation of alcohol and tobacco 21
3.2 Production losses in the paid workforce 24
3.2.1 Reduced workforce size 24
3.2.2 Absenteeism 24
3.2.3 On-the-job productivity 25
3.3 Production losses in the household sector 25
3.4 Health 26
3.4.1 Hospitals 26
3.4.2 Medical costs 26
iv
3.4.3 Nursing homes 27
3.4.4 Ambulances 27
3.4.5 Pharmaceuticals 28
3.5 Road accidents 28
3.6 Fires caused by smoking 30
3.7 Resources used in the consumption of illicit drugs 30
3.8 Litter 32
4. The epidemiological background to economic studies 33
4.1 Causal interactions between drugs 35
5
4.3 Changes in alcohol-attributable fractions 38
0
5. Estimation of drug-attributable crime costs 41
5.1 Models of the drugs–crime relationship 41
5.2 Methodology 41
5.3 Types of costs 43
5.3.1 Policing 43
5.3.2 Criminal courts 43
5.3.3 Prisons 43
5.3.4 Customs 43
5.3.5 National Crime Authority 43
5.3.6 Forgone productivity of criminals 44
5.3.7 Private security services and home security 44
5.3.8 Property theft and damage 44
5.3.9 Administration of insurance against property theft and damage 45
5.3.10 Violence 45
5.3.11 Money laundering 45
5.3.12 The illegal tobacco market 46
5.3.13 Legal expenses 46
5.3.14 Under-reporting of crime 47
6. Some disaggregated costs 48
6.1 Crime 48
6.2 Health 50
v
6.3 Illicit drugs disaggregated 54
6.4 Productivity 58
6.5 Road accidents 59
6.6 Fires 62
7. Aggregate results 63
7.1 Total costs 63
7.2 Incidence of abuse costs 66
7.3 Budgetary implications 68
7.3.1 Alcohol 68
7.3.2 Tobacco 71
7.3.3 Illicit drugs 72
7.3.4 Summary of budgetary impacts 74
7.4 Drug-attributable costs and gross domestic product 74
7.5 Sensitivity estimates of results 75
8. Comparability with previous social cost estimates 76
9. Future research 80
9.1 Re-estimation of the results using the human capital approach 80
9.2 Recalculation of the 1998/99 alcohol cost estimates 80
9.3 Crime 81
9.4 Workplace absenteeism and reduced workplace productivity attributable to tobacco and illicit drugs 81
9.5 The value of household work 82
2
9.7 Epidemiology 82
9.8 Pharmaceuticals 82
9.9 Prescribed pharmaceuticals 82
9.10 Litter 82
9.11 Ambulances 82
9.12 Research and education expenditures 83
9.13 Road accidents 83
9.14 Review of data needs 83
Bibliography 84
General references 84
vi
Crime 86
Epidemiology 89
Fires 90
Health 90
Litter 90
Paid and unpaid workforce 91
Public expenditures 91
Road accidents 91
State cost estimates 92
Data sources 93
Appendix A, Demographic estimates 96
Introduction 96
The data 97
Method 97
Adjustment of the mortality rates 98
Appendix B, Drugs and crime: calculating attributable fractions from the DUMA and DUCO projects 102
Acknowledgments 102
Introduction 102
Data sources and key limitations: DUMA and DUCO 104
Measuring offending 104
Measuring intoxication with DUMA data 105
Measuring causation 105
Measuring dependency 105
Developing multiple offence-adjusted attributable fractions 106
Weighting DUCO 108
Conclusion 110
References 112
Appendix C, Estimation of drug-attributable cases 114
Population data 114
Mortality data 114
Morbidity data 114
Estimation of drug-attributable cases 114
Footnotes to appendices 127
vii
List of TablesTable 1, Mechanisms of cost shifting 13
Table 2, Involuntary smoking-attributable conditions 14
Table 3, PBS subsidies and patient contributions for prescribed preventive pharmaceuticals, 2004/05 19
Table 4, Tobacco tax revenues, 1998/99 and 2004/05 22
Table 5, Alcohol tax revenues, 1998/99 and 2004/05 23
Table 6, Drugs recently used, proportion of the population aged 14 years and over, 1998 and 2004 31
Table 7, Selected aetiological fractions for tobacco 33
4
Table 9, Alcohol-attributable conditions for which the abstinence-based aetiological fractions are negative 36
Table 10, Alcohol-attributable deaths and hospital bed days, 2004/05 37
Table 11, Estimated numbers of lives lost and saved due to low risk and risky/high-risk drinking when compared to abstinence in Australia, 1998 38
Table 12, Tobacco-attributable conditions for which the aetiological fractions are 40
Table 13, Tobacco-attributable deaths and hospital bed days, 2004/05 40
Table 14, Illustration of drug-attributable fractions for violent crime, 2004/05 42
Table 15, Estimates of the quantities of tobacco grown, diverted to the illegal market, and seized by the ATO 46
Table 16, Summary of selected drug-attributable crime costs, 2004/05 49
Table 17, Summary of the impact upon drug- and alcohol-attributable police and court costs of use of lower and upper bound DUMA estimates, 2004/05 50
Table 18, Healthcare costs and savings resulting from drug abuse, 2004/05 51
Table 19, Percentages of gross and net health costs, 2004/05 51
Table 20, Alcohol-attributable deaths, hospital bed days and hospital costs, 2004/05, caused or prevented 52
Table 21, Tobacco-attributable deaths, hospital bed days and hospital costs, 2004/05, caused or prevented 52
Table 22, Tobacco-attributable deaths, hospital bed days and hospital costs, 2004/05, by age and smoking status 53
Table 23, Percentages of tobacco-attributable deaths, hospital bed days and hospital costs, 2004/05, by age and smoking status 53
Table 24, Individual drug categories, summary of health outcomes, 2004/05, males 55
Table 25, Individual drug categories, summary of health outcomes, 2004/05, females 55
viii
Table 26, Individual drug categories, summary of health outcomes, 2004/05, persons 56
Table 27, Individual drug categories, summary of health outcomes, 2004/05, males, 6
Table 28, Individual drug categories, summary of health outcomes, 2004/05, 7
Table 29, Individual drug categories, summary of health outcomes, 2004/05, 7
Table 30, Paid and unpaid production costs of drug abuse, 2004/05 59
Table 31, Drug-attributable road accident costs, 2004/05, by type of drug 60
Table 32 2
Table 33, Tangible social costs of drug abuse, 2004/05 64
Table 34, Intangible social costs of drug abuse, 2004/05 65
Table 35, Total social costs of drug abuse, 2004/05 65
Table 36, Incidence of the tangible social costs of alcohol misuse, 2004/05 66
Table 37, Incidence of the tangible social costs of tobacco abuse, 2004/05 67
Table 38, Incidence of the tangible social costs of abuse of illicit drugs, 2004/05 67
Table 39, Impact of alcohol misuse on the federal government budget, 2004/05 68
Table 40, Impact of alcohol misuse on state government budgets, 2004/05 69
Table 41, Total budgetary impact of alcohol misuse, 2004/05 70
Table 42, Impact of tobacco abuse upon the federal government budget, 2004/05 71
Table 43, Impact of tobacco abuse on state government budgets, 2004/05 71
Table 44, Total budgetary impact of tobacco abuse, 2004/05 72
Table 45, Impact of abuse of illicit drugs on the federal government budget, 2004/05 72
Table 46, Impact of abuse of illicit drugs on state government budgets, 2004/05 73
Table 47, Total budgetary impact of illicit drugs abuse, 2004/05 73
Table 48, Comparison of some tangible cost categories with gross domestic product, 2004/05 75
Table 49, Comparison of constant price estimates of the social costs of tobacco, 1998/99 and 2004/05, at 2004/05 prices 78
Table 50, Comparison of constant price estimates of the social costs of illicit drugs, 1998/99 and 2004/05, at 2004/05 prices 78
Table 51, The impact of drug abuse upon the Australian male population 99
Table 52, The impact of drug abuse on the Australian female population 100
Table 53, The impact of drug abuse upon the Australian male and female population 101
Table 54, Comparing the single item and new dependency measure on self-reported attributions for police detainees, percentages 106
ix
Table 55, Self-reported causal attributions by crime type, multiple offence-adjusted attributions, DUMA, percentages 108
Table 56, DUCO males and females, weighted estimates, percentages 109
Table 57, DUCO males and females, unweighted estimates, percentages 110
6
8
Table 9
1
2
3
24
25
differed from the AF for deaths 126

x
List of abbreviations
ABOD Australian Burden of Disease studyABS Australian Bureau of StatisticsAF Attributable fraction (also known as aetiologic fraction)AIC Australian Institute of CriminologyAIDSAIHW Australian Institute of Health and WelfareATOBCABTE Bureau of Transport EconomicsCOPD Chronic obstructive pulmonary diseaseDRG Diagnosis-related groupsDUCO Drug Use Careers of OffendersDUMA Drug Use Monitoring in AustraliaEtOH Ethyl alcoholGDP Gross domestic productGST Goods and services taxHIVICDIGA Inter-Governmental Agreement on the Reform of Commonwealth-State Financial
ArrangementsIHD Ischaemic heart diseaseMSO Most serious offenceNCA National Crime AuthorityN.a. Not availableN.e.i. Not elsewhere includedNHMRC National Health and Medical Research CouncilPBSPYLL Potential years of life lostQFRS Queensland Fire and Rescue ServiceRR Relative riskRRP Revenue replacement paymentSIDS Sudden infant death syndromeWHO World Health Organization
xi
Executive SummaryThis report is the fourth study by the present authors of the social costs of drug abuse in Australia. It presents estimates of the costs of alcohol, tobacco and illicit drugs for the
The production of this report was preceded by an extensive scoping study, including an invitational workshop with other researchers in related areas.
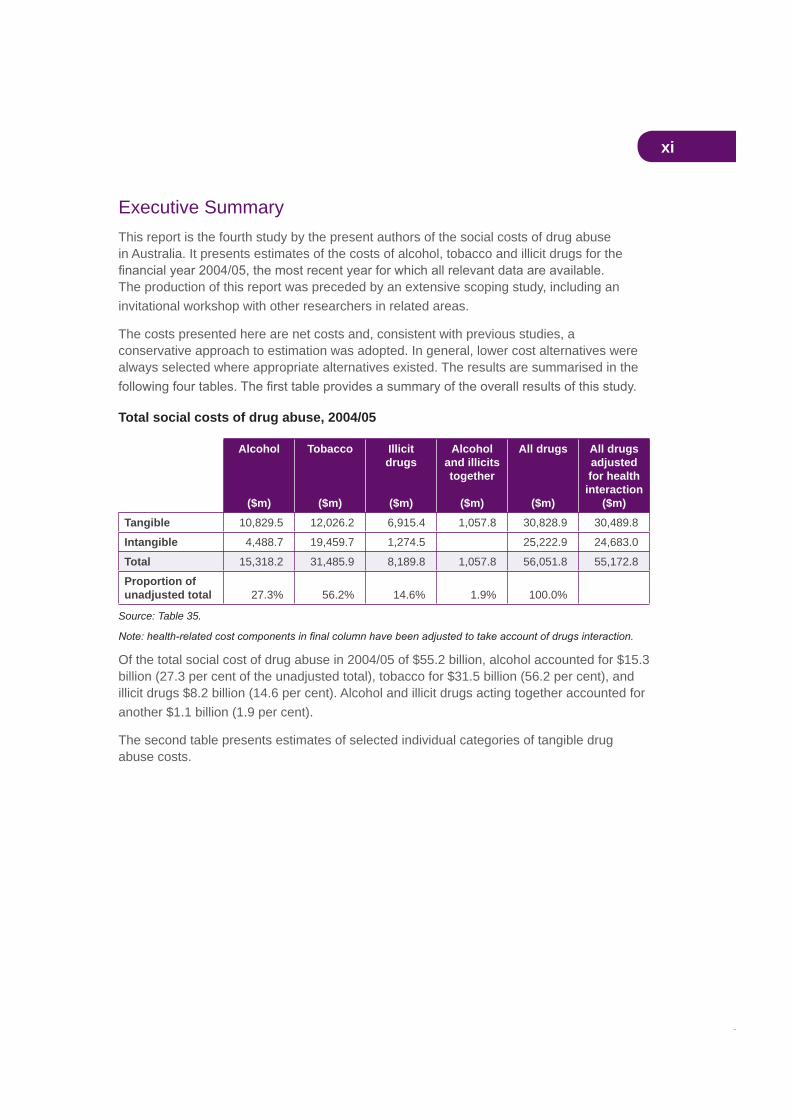
The costs presented here are net costs and, consistent with previous studies, a conservative approach to estimation was adopted. In general, lower cost alternatives were always selected where appropriate alternatives existed. The results are summarised in the
Total social costs of drug abuse, 2004/05
Alcohol
($m)
Tobacco
($m)
Illicitdrugs
($m)
Alcoholand illicits together
($m)
All drugs
($m)
All drugs adjustedfor health
interaction($m)
Tangible 10,829.5 12,026.2 6,915.4 1,057.8 30,828.9 30,489.8
Intangible 4,488.7 19,459.7 1,274.5 25,222.9 24,683.0
Total 15,318.2 31,485.9 8,189.8 1,057.8 56,051.8 55,172.8
Proportion of unadjusted total 27.3% 56.2% 14.6% 1.9% 100.0%
Source: Table 35.
Of the total social cost of drug abuse in 2004/05 of $55.2 billion, alcohol accounted for $15.3 billion (27.3 per cent of the unadjusted total), tobacco for $31.5 billion (56.2 per cent), and illicit drugs $8.2 billion (14.6 per cent). Alcohol and illicit drugs acting together accounted for another $1.1 billion (1.9 per cent).
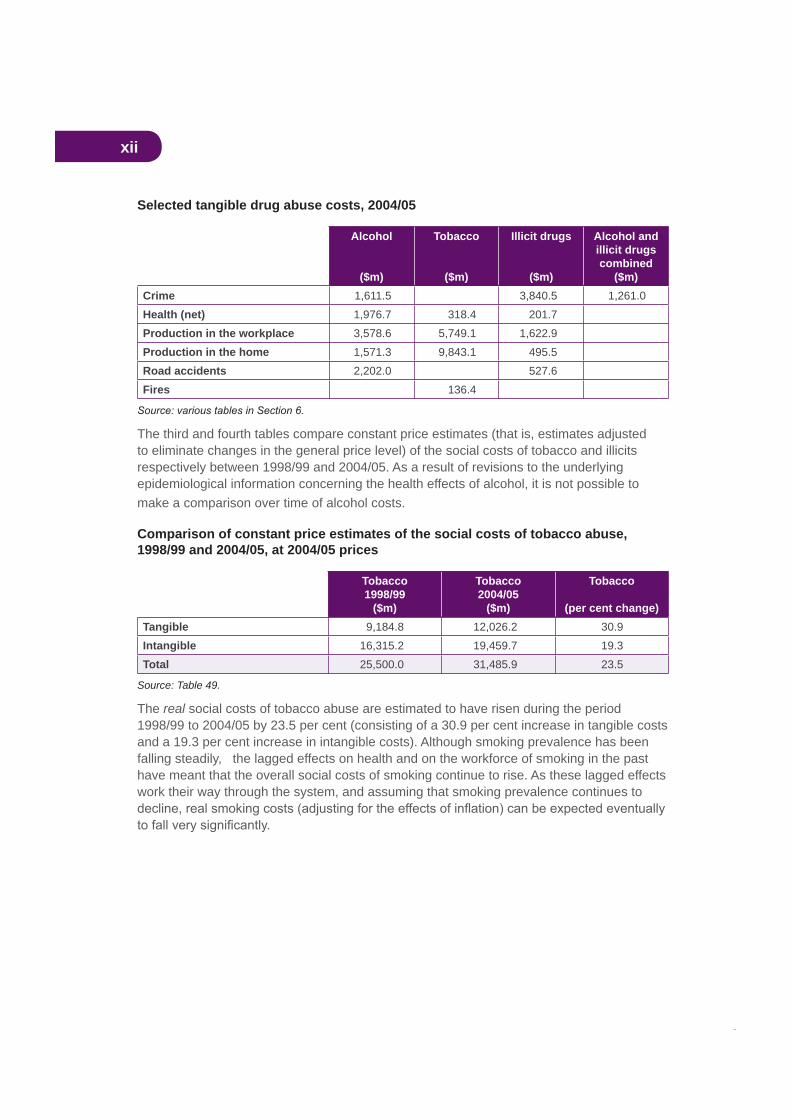
The second table presents estimates of selected individual categories of tangible drug abuse costs.
xii
Selected tangible drug abuse costs, 2004/05
Alcohol
($m)
Tobacco
($m)
Illicit drugs
($m)
Alcohol and illicit drugs combined
($m)Crime 1,611.5 3,840.5 1,261.0Health (net) 1,976.7 318.4 201.7Production in the workplace 3,578.6 5,749.1 1,622.9Production in the home 1,571.3 9,843.1 495.5Road accidents 2,202.0 527.6Fires 136.4
The third and fourth tables compare constant price estimates (that is, estimates adjusted to eliminate changes in the general price level) of the social costs of tobacco and illicits respectively between 1998/99 and 2004/05. As a result of revisions to the underlying epidemiological information concerning the health effects of alcohol, it is not possible to make a comparison over time of alcohol costs.
Comparison of constant price estimates of the social costs of tobacco abuse, 1998/99 and 2004/05, at 2004/05 prices
Tobacco1998/99
($m)
Tobacco2004/05
($m)
Tobacco
(per cent change)Tangible 9,184.8 12,026.2 30.9Intangible 16,315.2 19,459.7 19.3Total 25,500.0 31,485.9 23.5
Source: Table 49.
The real social costs of tobacco abuse are estimated to have risen during the period 1998/99 to 2004/05 by 23.5 per cent (consisting of a 30.9 per cent increase in tangible costs and a 19.3 per cent increase in intangible costs). Although smoking prevalence has been falling steadily, the lagged effects on health and on the workforce of smoking in the past have meant that the overall social costs of smoking continue to rise. As these lagged effects work their way through the system, and assuming that smoking prevalence continues to
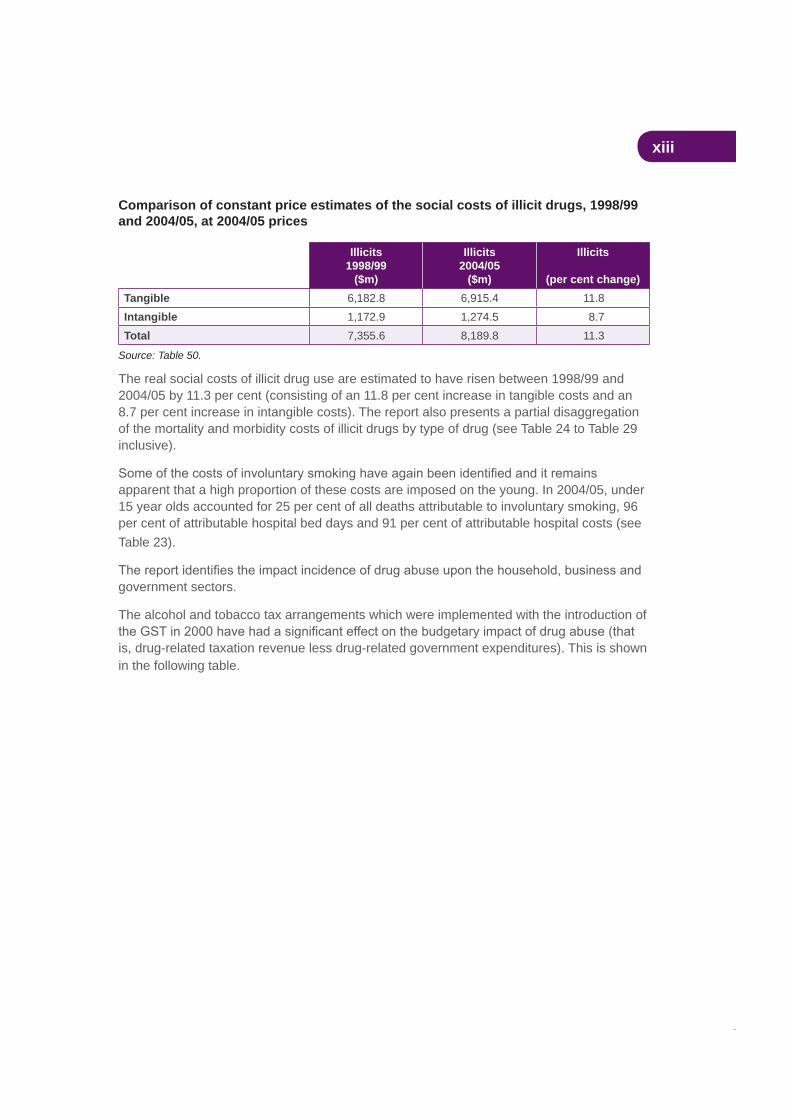
xiii
Comparison of constant price estimates of the social costs of illicit drugs, 1998/99 and 2004/05, at 2004/05 prices
Illicits1998/99
($m)
Illicits2004/05
($m)
Illicits
(per cent change)Tangible 6,182.8 6,915.4 11.8Intangible 1,172.9 1,274.5 8.7Total 7,355.6 8,189.8 11.3
Source: Table 50.
The real social costs of illicit drug use are estimated to have risen between 1998/99 and 2004/05 by 11.3 per cent (consisting of an 11.8 per cent increase in tangible costs and an 8.7 per cent increase in intangible costs). The report also presents a partial disaggregation of the mortality and morbidity costs of illicit drugs by type of drug (see Table 24 to Table 29 inclusive).
apparent that a high proportion of these costs are imposed on the young. In 2004/05, under 15 year olds accounted for 25 per cent of all deaths attributable to involuntary smoking, 96 per cent of attributable hospital bed days and 91 per cent of attributable hospital costs (see Table 23).
government sectors.
The alcohol and tobacco tax arrangements which were implemented with the introduction of
is, drug-related taxation revenue less drug-related government expenditures). This is shown in the following table.
xiv
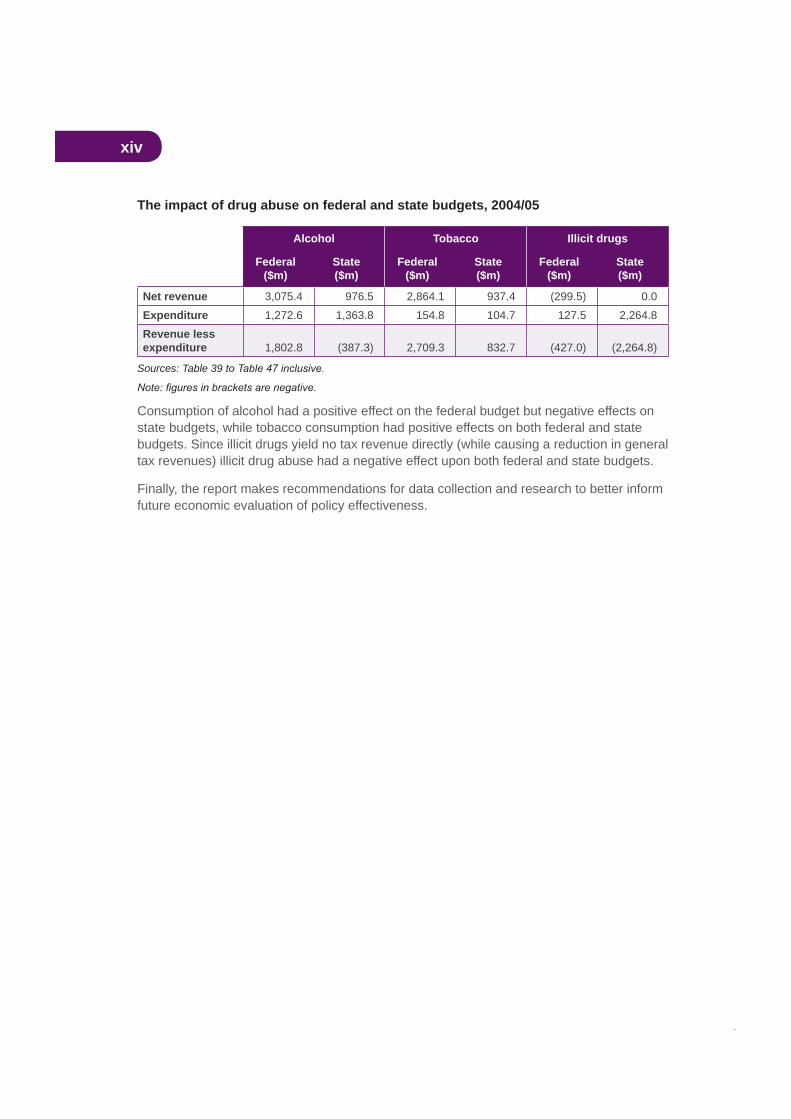
The impact of drug abuse on federal and state budgets, 2004/05
Alcohol Tobacco Illicit drugs
Federal($m)
State($m)
Federal($m)
State($m)
Federal($m)
State($m)
Net revenue 3,075.4 976.5 2,864.1 937.4 (299.5) 0.0Expenditure 1,272.6 1,363.8 154.8 104.7 127.5 2,264.8Revenue less expenditure 1,802.8 (387.3) 2,709.3 832.7 (427.0) (2,264.8)
Sources: Table 39
Consumption of alcohol had a positive effect on the federal budget but negative effects on state budgets, while tobacco consumption had positive effects on both federal and state budgets. Since illicit drugs yield no tax revenue directly (while causing a reduction in general tax revenues) illicit drug abuse had a negative effect upon both federal and state budgets.
Finally, the report makes recommendations for data collection and research to better inform future economic evaluation of policy effectiveness.
xv
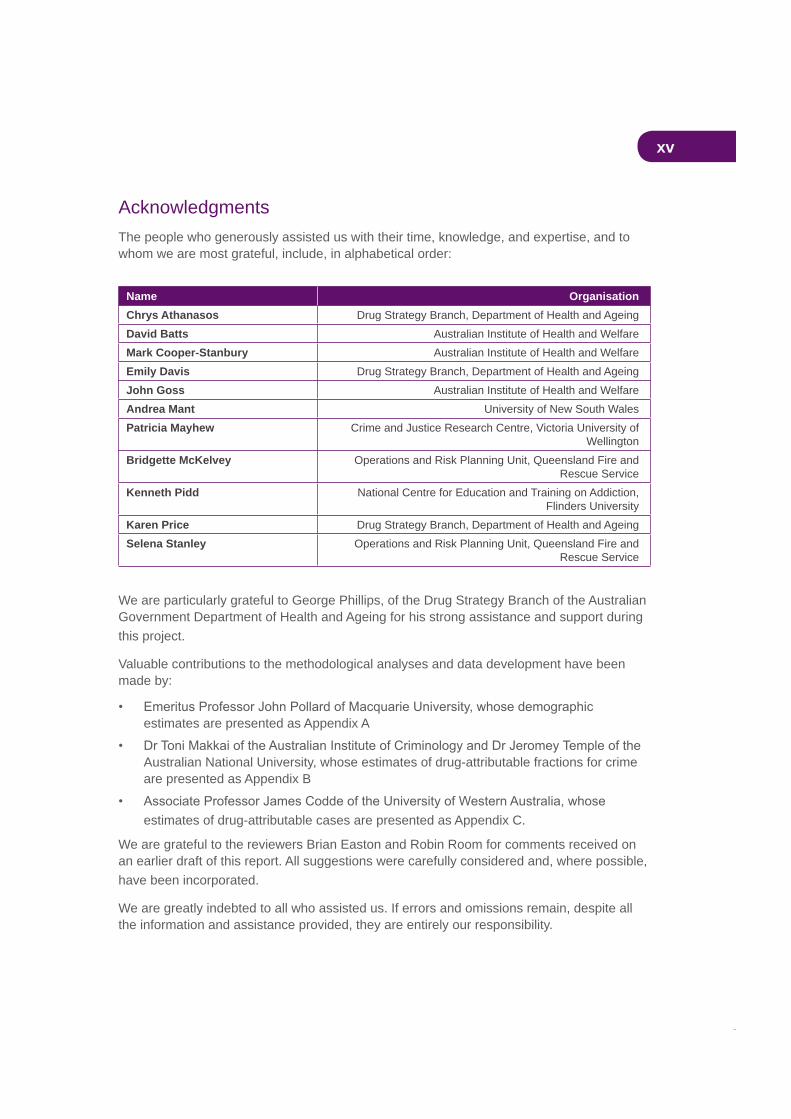
AcknowledgmentsThe people who generously assisted us with their time, knowledge, and expertise, and to whom we are most grateful, include, in alphabetical order:
Name OrganisationChrys Athanasos Drug Strategy Branch, Department of Health and AgeingDavid Batts Australian Institute of Health and WelfareMark Cooper-Stanbury Australian Institute of Health and WelfareEmily Davis Drug Strategy Branch, Department of Health and AgeingJohn Goss Australian Institute of Health and WelfareAndrea Mant University of New South WalesPatricia Mayhew Crime and Justice Research Centre, Victoria University of
WellingtonBridgette McKelvey Operations and Risk Planning Unit, Queensland Fire and
Rescue Service Kenneth Pidd National Centre for Education and Training on Addiction,
Flinders UniversityKaren Price Drug Strategy Branch, Department of Health and AgeingSelena Stanley Operations and Risk Planning Unit, Queensland Fire and
Rescue Service
We are particularly grateful to George Phillips, of the Drug Strategy Branch of the Australian Government Department of Health and Ageing for his strong assistance and support during this project.
Valuable contributions to the methodological analyses and data development have been made by:
estimates are presented as Appendix A
Australian National University, whose estimates of drug-attributable fractions for crime are presented as Appendix B
estimates of drug-attributable cases are presented as Appendix C.
We are grateful to the reviewers Brian Easton and Robin Room for comments received on an earlier draft of this report. All suggestions were carefully considered and, where possible, have been incorporated.
We are greatly indebted to all who assisted us. If errors and omissions remain, despite all the information and assistance provided, they are entirely our responsibility.

1
1. IntroductionThis study estimates the social costs of the abuse of drugs (alcohol, tobacco and illicit
prepared for the Department of Health and Ageing by the present authors. Previous studies of these costs were undertaken for the years 1988, 1992 and 1998/99 (Collins and Lapsley, 1991, 1996 and 2002 respectively).
Since the production of the 1998/99 estimates, the present authors have been involved in
World Health Organization publication Substance Abuse (Single et al., 2003). They are also the two lead authors of the Health Canada publication substance abuse (Collins, Lapsley et al., 2006). The latter, produced after a Health Canada-sponsored international workshop on the costs of substance abuse, represents
as opposed to aggregate, costs. The Australian Government Department of Health and Ageing has commissioned the present authors to undertake a pilot study applying this new methodology to the estimation of the avoidable costs of alcohol abuse in Australia, to be undertaken after the completion of the study published in this report. This avoidable cost study will inform and constitute part of a set of international studies in this area. It is intended that the avoidable cost guidelines will be reviewed in the light of the experience gained in the pilot studies.
Previous studies in this series have analysed the theory and methodology of social cost estimation in considerable detail. This can present a problem to the reader in that the present study runs the risk of largely repeating the methodological explanations of previous studies. On the other hand, if the methodological discussion were too brief or completely eliminated, this paper would not be able to be read as a stand-alone document. This
is largely a repeat of discussions in our previous papers. This section need not be read by those readers who are completely familiar with the underlying methodology. We proceed in Section 3 to explain and discuss areas of estimation where new or revised methodologies or new data have become available. Section 4 examines epidemiological issues and Section 5 examines issues in the estimation of drug-attributable crime costs. The aim in the above
independently of the previous ones.
Section 6 presents detailed disaggregated cost estimates for crime, health, productivity,
and morbidity costs of illicit drugs by type of drug. Section 7 presents the full results disaggregated by category of drug (alcohol, tobacco and illicit drug). Section 8 considers the
section discusses implications of the study for future research.
2
The approach of the present authors, both of whom are economists, is to concentrate
specialisation is called for, experts in these areas have provided data and been consulted.
the non-economic methodologies used in this study—demographic, epidemiological and criminological.
It is recognised that, in spite of the existence of the International Guidelines (Single et al., 2003), full consensus does not exist on the methodology of social cost estimation. Thus,
various available methodologies. The approach of the present report is to disaggregate the estimates as far as possible, in order that readers are able to identify the impact which the adoption of different methodologies would have upon these estimates. For example, this
resources which results from premature deaths caused by drug abuse. Most other cost studies do not identify this impact, preferring to estimate only the gross healthcare costs. Similarly, there has been discussion as to the proportion of total alcohol consumption in the Australian community which can be deemed abusive. This report indicates the impact of different assumed levels of abusive alcohol consumption on the aggregate estimates.
The uses of substance abuse cost estimates are discussed in some detail in Single et al. (2003).
First, economic cost estimates are frequently used to argue that policies on alcohol, tobacco and other drugs should be given a high priority on the public policy agenda.
It is important to know which psychoactive substances involve the greatest economic costs.
Third, economic cost studies help to identify information gaps, research needs and
Last but not least, the development of improved estimates of the costs of substance abuse offers the potential to provide baseline measures to determine
consequences of alcohol, tobacco and other drug use. Estimates of the social costs can assist policy makers in evaluating outcomes, as expressed in terms of changes in social costs in constant dollar terms. Estimates of social costs can also facilitate cross-national comparisons of the consequences of substance abuse and different approaches to confronting those consequences.
The purpose of the study presented here is to provide reliable estimates which can inform all of these public policy objectives.

3
2. General methodological issues in the estimation of the social costs of drug abuse
Lapsley studies, and again for the purposes of the present study, is:
The value of the net resources which in a given year are unavailable to the community for consumption or investment purposes as a result of the effects of past and present drug abuse, plus the intangible costs imposed by this abuse.
This cost concept, which applies to what has been labelled the demographic approach, is based on the calculation of the size and structure of a hypothetical population in which no drug abuse had occurred. The hypothetical population in this counterfactual situation is then compared with the actual population size and structure, as a basis for estimating drug abuse costs.
Most of the literature on drug abuse cost estimation pays virtually no attention to the implicit counterfactual situation against which the costs of abuse are estimated. However, if a study’s assumed counterfactual situation is not made explicit, interpretation of its results
Y million dollars” is not particularly informative unless we know what was the alternative situation assumed for the purposes of the calculation. The study might be referring to:
past (prevalence).
morbidity or mortality in a given year results from smoking in earlier periods. If the social costs of smoking in a given year were calculated on this basis they would be minimal.Clearly, then, we should be examining the impact of smoking over an extended period of time and this implies comparison with the counterfactual situation in which there was no smoking over this extended period. The comparison is being made between the actual smoking situation over an extended period and a hypothetical alternative situation of no past or present smoking.
Thus, for the purposes of this study, the counterfactual situation which is compared with the actual 2004/05 drug abuse situation is one in which there has been no abuse of the drug in question for an extended period of time. In this study that period is assumed to be at least 40 years.

4
To postulate a situation of no past or present drug abuse is not to suggest that such a situation is necessarily achievable. It is, almost certainly, not achievable. Thus the costs attributed to drug abuse will exceed by a considerable margin the potential reduction
potential reduction in costs, given the implementation of a set of appropriate public policies, involves the estimation of costs, which is not undertaken in this study. The issues involved in estimating avoidable costs are dealt with extensively in Collins, Lapsley et al. (2006).
2.2 The concept of drug abuse
extra resources which would have been available if there had been no past or present abuse. This implies that, had there been no abusive consumption, the resources devoted to satisfying those consumption demands would have been released for other consumption or
measurement of abusive consumption.
or illicit drugs. In the case of tobacco, virtually all consumption is harmful to the smoker
their consumption, with the implication that any consumption is abuse. However, the use of
abuse in the National Alcohol Strategy (Commonwealth Department of Health and Aged Care, 2001), only alcohol misuse. On the other hand, a new National Alcohol Strategy which has recently been published (see www.alcohol.gov.au) offers no preference, separation, or
tobacco abuse, illicit drug abuse and alcohol abuse/misuse.
aetiological fraction is greater than zero, i.e. when drug abuse adversely affects the
encompasses non-medical costs such as accidents and policing, is that drug abuse exists when drug use involves a net social cost additional to the resource costs of the provision of that drug. Abuse occurs if the community incurs net costs as a result of drug use.
As discussed below, this study concentrates on social costs because these are the costs that are relevant for the development of public policy. However, the consumption of alcohol
(in effect, negative social costs) are equally relevant for the development of public policy.
drug use.

5
2.3 Abusive and addictive drug use
alcohol, and illicit drugs. For tobacco it is concluded that there is a small proportion of tobacco consumed which is not addictive. However, from a health perspective, all tobacco consumption is abusive, i.e. there is no safe level of consumption. Even those aetiological fractions which are negative for tobacco do not negate the cancers, heart disease and other conditions caused by smoking.
Alcohol presents different challenges from the perspective of the determination of social costs. In Collins and Lapsley (1996) it was concluded that 20 per cent of alcohol consumption was by addicted drinkers. (It should be emphasised that this does not suggest that 20 per cent of alcohol consumers are addicted, as the average alcohol consumption of addicted drinkers will be much higher than that of other drinkers.) This does not address the issue of misused alcohol which is consumed by non-addicted drinkers, the results of which can include costs of illness, road accidents, violence (including domestic violence), reduced productivity, crime and drug-induced accidents. Accordingly, the proportion of abusive alcohol consumption is assumed to be higher, at 30 per cent.
It is recognised that this proportion represents an educated guess and it has been suggested that the true proportion may well be much higher—at least 50 per cent. This
abusive consumption. The estimates of all the other components of the social costs of
in abusive alcohol consumption, on the basis of the 30 per cent assumption, is $1,689m. If a
As indicated earlier, the consumption of all illicit drugs is treated here as abusive because Australian society has decided that use of these drugs is illegal and that their consumption represents abuse. In effect, this determines the counterfactual scenario as a situation in which there is no consumption of illicit drugs. The degree to which such unauthorised use is abuse, as discussed elsewhere in this report, is a question outside the scope of this study.
2.4 Demographic and human capital approachesThe approach to cost estimation adopted in previous Collins and Lapsley studies and in
capital” approach of some other studies. The brief comparison of the two approaches presented below is based on that written by the present authors for inclusion in the
, produced by the World Health Organization (Single et al., 2003). These guidelines acknowledge the legitimacy of both approaches.
Both approaches relate to the valuation of the loss of production arising from the abuse-related deaths of otherwise productive members of society. Both approaches compare production and abuse costs in the actual situation with those in the hypothetical alternative situation which would have existed had there been no past or present substance abuse.
6
The difference between the two approaches relates to the way in which the production costs of premature mortality are treated.
The human capital approach is to estimate the value of the worker’s future production stream, brought back to present day values by the use of an appropriate discount rate.A thousand dollars received this year is worth more than a thousand dollars received
for consumption or investment purposes a year earlier and so produce interest receipts
for the difference between present and future values. Two major problems arise in the human capital approach—how to forecast future production levels and how to choose the appropriate discount rate.
The demographic approach compares the actual population size and structure with the size and structure of the hypothetical alternative no-abuse population. From this comparison the actual and hypothetical outputs are compared to yield the production costs in the year
estimation of the alternative population structure.
The essential difference between the two approaches can be summarised in the following way. The human capital approach calculates the present and future production costs of abuse-induced deaths which occur in the present year. The demographic approach calculates the present production costs of abuse-induced deaths which have occurred in past and present years. Which approach should be adopted depends, therefore, upon which type of information is needed and upon the precise nature of the counterfactual scenario. The two approaches are complementary rather than competitive.
The two approaches are likely to yield different aggregate cost relativities for the three drug categories. This arises from the fact that the age at which an Australian drug-attributable death occurs is lowest for illicit drugs, relatively low for alcohol and highest for tobacco. The average potential years of life lost (PYLL) for all illicit drug-attributable deaths (for the ages 0–74) is 39, for alcohol it is 32, and for tobacco it is only 16. Thus, the human capital approach will place a higher emphasis on costs which involve the discounting back to present day values.
where the nature of the task is to compare, on a common basis, time streams of costs and
study it is to estimate the costs of drug abuse which are borne in a given year. It can be argued that for the purpose of estimating abuse costs, this is a more comprehensible and useful concept of cost than that delivered by the human capital approach.
If abuse cost studies are to be extended into the BCA of proposed drug programs, the human capital approach is indispensable. The data sets used in the two approaches are largely overlapping and it would be perfectly feasible to extend the present study to produce human capital-based estimates.
7
A major problem of both approaches is the valuation of life. The interpretations to be placed on the life valuations differ between the two approaches. The human capital approach estimates the value of the loss of a life. The demographic approach estimates the value of the loss of a year’s living.
2.5 General equilibrium impacts of drug abuseThe abuse cost concept adopted here, by referring to the resources which would be released for consumption or investment purposes, explicitly avoids the problem of what economists refer to as the general equilibrium impact of drug abuse.
It is often argued that, if an industry producing abused substances ceased to exist, there would be substantial loss of employment, output and income. Thus this employment, output
is the implicit assumption that the opportunity cost of resources used in the drug industry
use) is zero. This is an assumption that would appear impossible to justify. If such logic
that agricultural resources used in the production of abused substances would have zero opportunity cost and it is impossible to imagine that manufacturing and distributive resources would have no alternative use.
A similar problem arises in valuing production losses resulting from substance abuse. If there were high levels of unemployment, the loss of production might be small or zero (because the prematurely deceased could be replaced by workers who otherwise would be unemployed). The costs of drug abuse borne by society would apparently be much lower in periods of high unemployment than in periods of low unemployment. Increases in unemployment would apparently reduce drug abuse costs.
econometric model and an appropriate counterfactual. Even if such models existed, and we are unaware of their existence (although Richter and Gori (1980) made such an attempt), there would still remain, with the human capital approach, the problem of forecasting future rates of unemployment, growth and productivity over the remaining normal lifetime of the prematurely dead. It is not possible to produce robust estimates of the opportunity cost over extended periods of time of resources used in the production of abused substances.
The following point should once again be made explicit. The approach of this paper is to estimate the value of the resources which would have been made available had there been no past or present drug abuse. The alternative uses to which these resources would have been put would be largely determined by government macroeconomic and microeconomic policies and to forecast these uses would therefore be speculative.

8
2.6 Private and social costs of drug abuse and their policy
A fundamental issue of abuse cost estimation is whether the estimates should incorporate
and freely borne by the consumer or producer himself, they are referred to as private costs but to the extent that they are not so borne but fall on the rest of society they are referred to as social costs”. Thus, according to Markandya and Pearce, total costs equal private costs plus social costs. What Markandya and Pearce call social costs are often called negative
compensation to those who bear these extra costs).
aware of the costs that he bears. If his actions are determined by a perceived cost that is in fact less than his actual cost, the difference between the two can be viewed as a social
higher costs and they are, therefore, unaccounted for”.
In these circumstances individuals are not necessarily behaving irrationally. They are simply adjusting their behaviour according to the best available, relevant, information. As Markandya and Pearce implicitly accept, costs borne by the individual drug abuser can be social costs even if that individual is rational, if those costs have not been knowingly incurred. This point merits further elucidation.
In a private market transaction the consumer is assumed to make a comparison between
exceed the private costs (that is, there is some consumer surplus). But what if, as a result
purchase not gone ahead. The community as a whole (through the purchaser) has borne a cost because of the lack of appropriate information on the part of the purchaser. The purchaser has borne that cost, a social cost.
As an example of this analysis, assume that a motorist purchases a new car in ignorance
end collisions, with catastrophic implications for its occupants. In this theoretical example
purchaser had no way of taking it into account in the purchase decision. Had the risk been known, the purchaser would either have been unwilling to buy that model at all or only
estimation, less than the purchase price. The real wealth of society has been reduced by this transaction even though the cost is borne by the private purchaser (see Collins and Lapsley, 2002).
9
Thus, the crucial issues in relation to the estimation of the social (external) costs of abuse are:
the objective of this study is to estimate the social cost of drug abuse, purely private costs are not relevant to, and are not counted in, this study.
Why is so much attention paid to the distinction between private and social costs and
government action on the basis that:
generally accord with the best interests of the individual concerned;
accounted for, then what is in the individual’s best interests will also be best for society; and
decisions that would improve the welfare of either the individuals concerned or society more broadly.”
If the objective were to estimate the total
should be ignored. The present study is concerned with the social costs of drug abuse and
are relevant to the formulation of public policies.
Being fully informed about the private costs of abuse requires the abuser to have access to, and have the ability to process and evaluate, epidemiological information on the effects of drug use. It also requires the drug user to be able to evaluate the probable future health
nature, are fully-informed, or even well-informed, about the costs of their abuse (Courtwright et al., 1989). Abusers are likely to be less well-informed than non-users, since well-informed users are much more likely to have ceased or avoided abuse.
10
Potential major sources of information for drug abusers are public health campaigns, advertising by manufacturers and information disseminated by the media. Public health campaigns and media information are highly useful but clearly are not perfect vehicles for conveying relevant health information. Advertising of tobacco (which was legal until relatively recently) and alcohol in Australia has generally provided at best little information other than price and at worst impressionistic images totally at odds with the actual effects of abuse of these products.
by Becker and Murphy (1988) on the theory of rational addiction, implies utility maximisation
users are rational, forward looking utility maximisers who base consumption decisions on full knowledge of the consequences of addiction.”
It should be noted that rationality here implies full knowledge. The theory of rational addiction, which has been widely quoted by industry groups as supporting their case, does not merely demand rationality; it demands both rationality and full knowledge. Furthermore, it demands rational behaviour in a situation of full knowledge at the time at which the addiction was acquired. A high proportion of addictions are acquired in the early- or mid-teens when it would seem that the presence of both rationality and full information is unlikely.
The notion of rationality as maximisation of utility over time is itself an interesting one.
undertaken by using some concept of a time preference rate. Are very high time preference
be seen to be consistent with utility maximisation. But society itself is clearly unwilling to accept all behaviour patterns (for example, self-destructive behaviour even when it does not impose social costs).
The present research assumes that addicts do not satisfy the rationality and information requirements discussed above. Ellemann-Jensen (1991) takes issue with this analysis, pointing out that total addiction has been assumed to imply that the smoker enjoys no utility
contrast to the hypothesis of utility-maximisation in standard economic theory”. In fact, this is not necessarily the case. A 1991 editorial in the suggests that addiction involves, inter alia:
11
In these circumstances, the objective of drug consumption may well be to avoid highly
withdrawal effects result from previous consumption of the addictive drug, avoidance of
use. Rational behaviour of an addict is not the same as rational behaviour of a person contemplating acquiring an addiction, and the two cannot be equated.
2.7 Costs of consumption of abused drugsIf all drug abuse ceased to exist, the consequent reduction in consumption would release resources which could be used for other consumption or investment uses. Thus, on
resources used in abusive consumption represent one of the costs of drug abuse. The correct measure of these resources is the value of consumption rather than the value of production since the latter fails to take into account imports or exports of the abused substances. Data on consumption at market prices must be adjusted to a basis of factor cost by deducting taxes less subsidies.
illegal, there are no national accounts data on consumption. The street value of illicit drugs is not a useful measure from the point of view of this study because a high proportion of the street value represents a return for the risks involved in drug dealing. The resources used in illegal drug activities would, in their alternative uses, undoubtedly command much lower rates of return. If dealing in or use of the drugs in question did not attract legal sanctions, their prices would be very much lower, although presumably if illicit drugs were legalised they would be taxed.
2.8 Avoidable costs of drug abuseEstimates of the aggregate costs of substance abuse do not indicate the potential returns to anti-abuse policies and programs. These potential returns are represented by costs.
It is accepted that the hypothetical alternative situation on which this paper’s calculations are based, of no past or present drug abuse, is not achievable under any circumstances.Estimates of the total costs of drug abuse comprise both and costs. Unavoidable costs comprise the costs which are currently borne relating to past drug abuse, together with those resulting from the fact that some proportion of the population will continue to abuse drugs. Avoidable costs are those costs which are potentially amenable to public policy initiatives and behavioural changes.
Previous papers in this series have presented estimates of the avoidable costs of substance abuse in Australia. However, as indicated above, the present authors will, in a separate paper, estimate the avoidable costs of alcohol misuse in Australia. The present paper, unlike previous papers in this series, does not provide any estimates of the avoidable costs of substance abuse.

12
2.9 The incidence of abuse costsThis paper follows the recommendations of the
(Single et al., 2003) in attempting to identify the incidence of drug abuse costs; that is, who bears these costs. Abuse costs can be viewed as a form of tax imposed upon various sections of the community. Accordingly, the incidence of these costs can be analysed using the principles of tax incidence analysis developed in the public
Tax analysis makes the distinction between legal incidence and effective (or economic) incidence. Legal incidence indicates which individuals or organisations are legally required to pay the tax to the revenue authorities. Economic incidence describes who ultimately bears the tax after all the economic adjustments resulting from the imposition of the tax have been worked through. For example, a manufacturer might be required to pay increased GST (legal incidence) but the tax might be passed on to the consumer in the form of higher prices (effective incidence). It is relatively easy to identify the legal incidence of a
Drug abuse costs are treated in this study, for the purposes of identifying their incidence, as a form of tax. We attempt to estimate here the impact incidence (the equivalent of the legal incidence) rather than the effective incidence, which would be an extremely complex process beyond the scope of the present study.
Social costs of drug abuse can bear upon one or more of four community groups (neither
There are various mechanisms by which these groups could shift the abuse costs to other groups. Some of these mechanisms are indicated in Table 1.

13
Table 1, Mechanisms of cost shifting
Cost initially borne by Means by which cost is shifted
Cost shifted to
Drug users Lower work productivity at existing wage rates
Employers
Other individuals Lower work productivity at existing wage rates
Employers
Business Higher pricesor
Lower wagesor
Lower tax payments
Consumersor
Employeesor
Government
Government Higher taxesor
Lower expenditures
Taxpayers (private and business)
or
expenditures (private and business)
Given that any costs imposed on business or government must eventually be shifted in some form, all costs must ultimately be borne by individuals.
economic adjustments resulting from drug abuse. No attempt is made here to do so. The
(consisting of ill-informed and/or addicted abusers and other individuals), business and government.
By their nature, intangible costs cannot be shifted. For example, there is no mechanism by which the costs of loss of life can be passed on to others. Thus individuals bear both the impact and the effective incidence of all intangible costs.
An interesting issue arises in relation to the impact incidence of the resources used in the abusive consumption of alcohol, tobacco and illicit drugs. As these resources would have been available for other uses had they not been utilised for this purpose, it needs to be determined which section of the community (households, business or government) would
The approach of the present study is to assume that the productive resources released from the production and distribution of drugs would have become available for the production and distribution of other goods and services. Thus the impact incidence of the resources used as a result of drug abuse is assumed to be on businesses involved in these alternative activities.
14
2.10 Active and involuntary smokingThis study disaggregates the costs of smoking into active and involuntary components. The more usual distinction is between active and passive smoking (sometimes called sidestream smoke or environmental tobacco smoke). However, all three phrases have their limitations in that they appear to indicate that the only mechanism by which smoking affects non-smokers is by the latter’s inhalation of tobacco smoke. There are, however, other mechanisms by which smoking can affect non-smokers. As an illustration, pregnant mothers who smoke are likely to impose adverse health effects on their unborn children (for example, through low
preferred and is adopted in this study, some of the epidemiological information (for example
To clarify this distinction, medical conditions attributable to active smoking occur as a
the unborn).
This study assumes that all smoking-attributable conditions suffered by people aged less
juveniles under the age of 15 either will be non-smokers or will not have smoked for a period of time long enough to have acquired smoking-attributable medical conditions. At ages of
by Begg et al.smoking.
On current medical evidence, the overwhelming proportion of the morbidity attributable to involuntary smoking, as well as a high proportion of involuntary smoking mortality, is borne by the young.
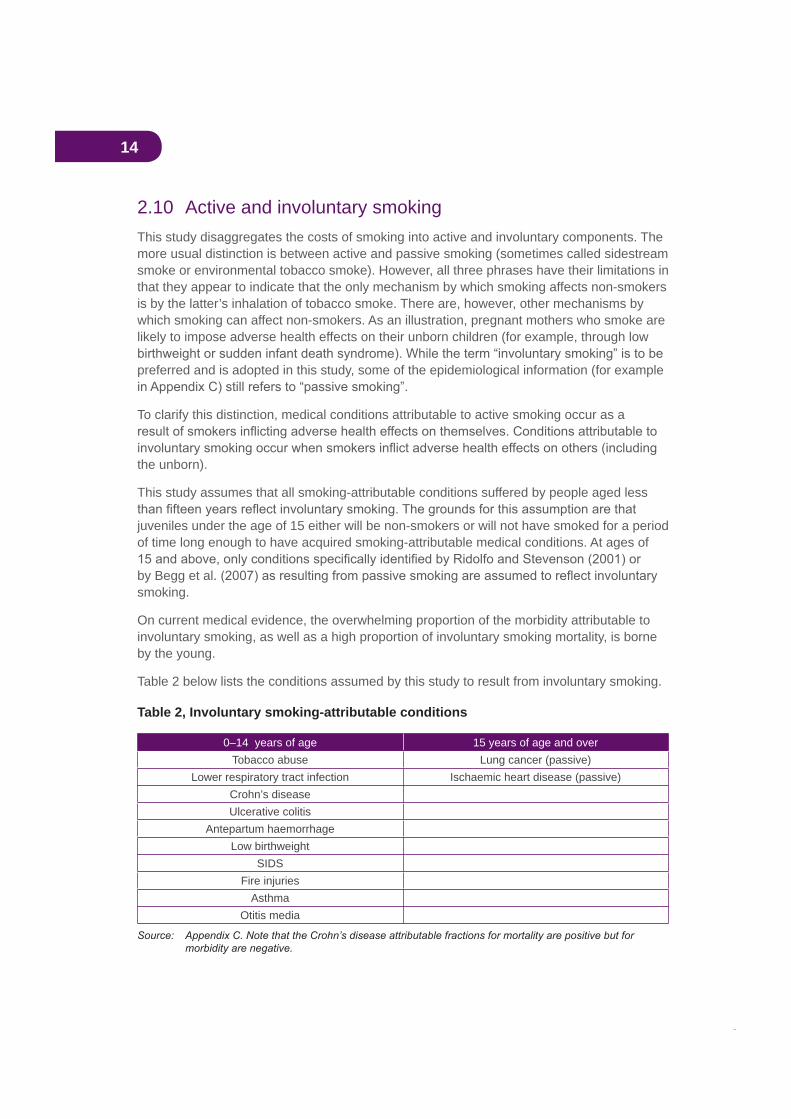
Table 2 below lists the conditions assumed by this study to result from involuntary smoking.
Table 2, Involuntary smoking-attributable conditions
0–14 years of age 15 years of age and overTobacco abuse Lung cancer (passive)
Lower respiratory tract infection Ischaemic heart disease (passive)Crohn’s diseaseUlcerative colitis
Antepartum haemorrhageLow birthweight
SIDSFire injuries
AsthmaOtitis media
15
It could be argued that alcohol consumption can have analogous involuntary effects in that people are killed or injured as collateral consequences of alcohol misuse. However, data
2.11 Valuation of lifeDrug abuse causes premature deaths. When a life is lost prematurely the community bears two types of social costs—the loss of productive capacity (a tangible cost) and the psychological effects borne by the drug abuse victim and others (an intangible cost). How to value the costs to the community of these deaths is the subject of considerable debate in the economic literature.
Valuing the loss of productive capacity is known as the human capital approach. It involves estimating the loss of the future stream of productive capacity and expressing it as a present-day value by the application of an appropriate discount rate. The psychological costs of premature death are estimated using the willingness-to-pay approach, in which researchers identify how much people would be willing to pay to reduce the risk of death in a particular period of time (death not being permanently avoidable). Generally, intangible
which conventional markets (and so market prices) exist. However, the human capital
The two approaches are discussed in Bureau of Transport Economics (2000, chapter 3).
If the human capital approach is adopted, premature deaths of people of above workforce age are, by implication, considered to have no social cost since no productive capacity is
since the resources which would have been needed to supply the consumption needs of the deceased are saved. However, the community by many actions (including the allocation of substantial healthcare resources to the aged) demonstrates clearly that it believes the lives of people of beyond work force age are still of value. Thus, while it is important to value the loss of productive capacity, to ignore the psychological costs valued in a willingness-to-pay approach would produce a totally misleading estimate of the social cost of premature deaths.
The present study values the drug-attributable loss of productive capacity in the year under study (a tangible cost) together with the psychological costs of premature death. Consistent with the demographic approach adopted here, the study estimates the value of the loss of one year’s living, not the value of a lost life (which can involve the loss of many years of living).
The Bureau of Transport Economics (2000) refers to a range of international willingness-to-pay estimates of the value of life. It indicates that a reasonable valuation of a lost life in Australia in 1996 would be $2 million, which is at the low end of the range of international
a year’s living by reference to the average life expectancy of the Australian population (Australian Bureau of Statistics, Deaths 2000).
16
The average intangible value of the loss of one year’s living in 2004/05 prices was calculated to be $53,267.
2.12 Pain and sufferingAs reported in our previous studies, pain and suffering attributable to road accidents remains the single component of total drug-attributable pain and suffering to which we are able to assign a monetary value. This estimate is derived from the research reported in the Bureau of Transport Economics (BTE) (2000), but it does not appear possible to extend this estimate to other areas of drug abuse.
Easton (1997) in his New Zealand study has estimated that intangible morbidity costs are of similar order of magnitude to mortality costs. While data are not available to make similar calculations for Australia, it is recognised that the results presented here may well represent a considerable underestimate.
2.13 WelfareDrug abuse can cause increased reliance on social services of various kinds. These may be physical support services, such as the provision of supported accommodation, or income
services must avoid the inclusion of pecuniary costs.
The distinction between real and pecuniary costs as applied to the analysis of welfare is expounded in some detail in Collins and Lapsley (1991, pp. 56–8). It can be broadly summarised as follows. Where service provision involves the use of resources which would otherwise have been available to the community as a whole for other uses (for example, accommodation costs or the administrative costs of the support system), the resources used are real. These costs should be included in social cost estimates. Income support, on the other hand, usually represents a pecuniary transfer from one section of the community to another—that is simply a different distribution of the available resources. The resources available to the community as a whole (as opposed to the taxpaying community) do not change as a result of the process of income support, although they may result in very different types of expenditures and savings. Consequently, these costs do not constitute a valid component of social cost estimates, though they certainly can represent an important budgetary cost to government.
Collins and Lapsley (2002, p. 27) concluded that it was not possible to estimate welfare costs, either real or budgetary, causally attributable to the consumption of each of the three drug categories studied (alcohol, tobacco and illicits). The same conclusion was reached in the preparation of the present study.
17
2.14 Revenue impacts of drug abuseIt is often asserted that, even if the social costs of abuse of tobacco and alcohol are high, the revenues derived by governments from taxing these drugs more than cover the costs imposed on governments. This argument cannot be made for illicit drugs, which yield no tax revenues, and which may indeed lead to a net revenue loss as a result of tax evasion and money laundering.
This apparently straightforward revenue/expenditure comparison, when subject to careful analysis, is far more complex. This can be best illustrated by taking the example of tobacco which, in terms of estimated social costs, is by far the most serious problem drug in Australia.
At the outset it should be conceded that, as will be seen later in this report, tobacco tax revenue does in fact exceed by a considerable margin the tobacco-attributable costs
their way”.
for the reasons discussed above. It is, to a very large extent, the tobacco industry which
This question is easily answered in the negative.
There is a great deal of persuasive evidence that the demand for tobacco is relatively unresponsive to changes in tobacco prices. Using economic terminology, the demand for cigarettes is price-inelastic. Tax analysis shows that in these circumstances a high proportion of the tax is borne by the buyer not the seller. This implies that the industry which is responsible for the imposition of high social costs pays only a small proportion of the tobacco tax revenue.
Estimation of the budgetary impact of smoking indicates whether tobacco tax revenue compensates governments for the revenue and expenditure impacts of smoking (that is,
that imposes the social costs compensates those sections of the community which bear the costs. These costs are borne by smokers, other individuals and the business sector. Governments merely pass on the costs borne by the public sector to the general community, by taxation or other means.
The same argument holds for alcohol, the other drug whose use is able to be directly taxed. If drug-producing industries are to compensate the rest of the community fully for the negative externalities which they generate, drug tax revenues should substantially exceed drug-related public expenditures.
In examining the budgetary impact of drug abuse, the obvious comparison is between expenditures undertaken and revenue generated. It should, however, also be recognised that drug abuse reduces revenue from some types of taxes. Abuse-induced mortality and morbidity will reduce income tax revenue as a result of a reduction in the size of the employed workforce. Indirect tax revenues will also be reduced as a result of the effect
18
of mortality in reducing consumption expenditure levels. There would be other, relatively
company income tax. However, as explained below, the revenue from these latter types of taxes should be excluded from the analysis because they do not discriminate against the alcohol or tobacco industry in any way. All industries must bear these taxes at the same
provided by government to industry generally. They are, accordingly, not incorporated in the budgetary analysis of this study.
Indirect taxes (which are calculated net of subsidies) are taxes which are assessed on producers in respect of the production, sale, purchase or use of goods and services and which are charged to the expenses of production. Examples are the GST, customs duties and excise taxes. Revenue from indirect taxes declines as a result of drug abuse because premature mortality reduces consumption levels and so reduces tax revenue raised from that consumption expenditure.
Indirect tax revenue losses (net of subsidy gains) are estimated by applying the ratio
reduction resulting from premature mortality. Indirect tax data are derived from Australian
The present study presents estimates of the budgetary impacts at federal and state levels of tobacco, alcohol and illicit drug use, incorporating the revenue-contraction, as well as the revenue-generation, effects. It should be noted that the budgetary impact of abusive consumption is estimated, not the impact of total consumption (although these amounts are the same in relation to tobacco and illicit drugs).
industries on the revenue and expenditure effects of their industries. To include in the analysis all revenues attributable to the particular drug implies that the industry, in
all. It is quite wrong to attribute all tax revenue from alcohol or tobacco to be raised as compensation for the abuse-related externalities, rather than attributing some to the tax burden that is inevitably borne by all industries, whether they impose negative externalities or not. If there were no externalities, alcohol and tobacco would still bear sales or other consumption taxes consistent with the tax burden borne by other commodities.
This point can be illustrated clearly in relation to the current Goods and Services Tax (GST) regime. Virtually all goods and services are subject to GST at a rate of ten per cent. Thus the tax is almost completely non-discriminatory between products and between industries. In considering the tax contributions of the tobacco and alcohol industries, GST revenue
these drugs are relevant to the revenue/expenditure comparison.
There is, however, a complication in the Australian context in that the GST which is now applied to alcohol and tobacco was applied to these goods for the purposes of administrative simplicity. An-across-the-board GST at a single rate is much simpler, and accordingly much less costly to implement than one in which there are substantial exemptions (in the tax jargon, zero rating). As explained below, when the Australian GST
19
was implemented, excise duties on alcohol and tobacco were simultaneously reduced, so that the overall tax burdens remained broadly the same. In acknowledging this history, the present study includes GST revenue on alcohol and tobacco for the purposes of the budgetary analysis.
2.15 Research, education and drug program costsThe (Single et al., 2003) argue that public expenditure on areas such as drug-related education programs or research projects represents the effects of public decisions to reduce abuse rather than the direct effects of abuse and, accordingly, should be excluded from abuse cost estimates. The guidelines recommend that these costs, although considered relevant to a study of drug abuse costs, should be presented separately as policy costs rather than incorporated in the abuse cost estimates. The present study follows Collins and Lapsley (2002) in adopting the criterion that expenditures on prevention of drug abuse and on research concerning appropriate interventions can be seen as discretionary, but that expenditures on the interventions themselves should not treated as discretionary.
At the time of the production of Collins and Lapsley (1996), the second in this series of estimates of the social costs of drug abuse, it was possible to obtain information on drug-related research and education costs from Commonwealth Department of Health internal records. The Commonwealth made payments to the states and territories through cost-
different allocations.
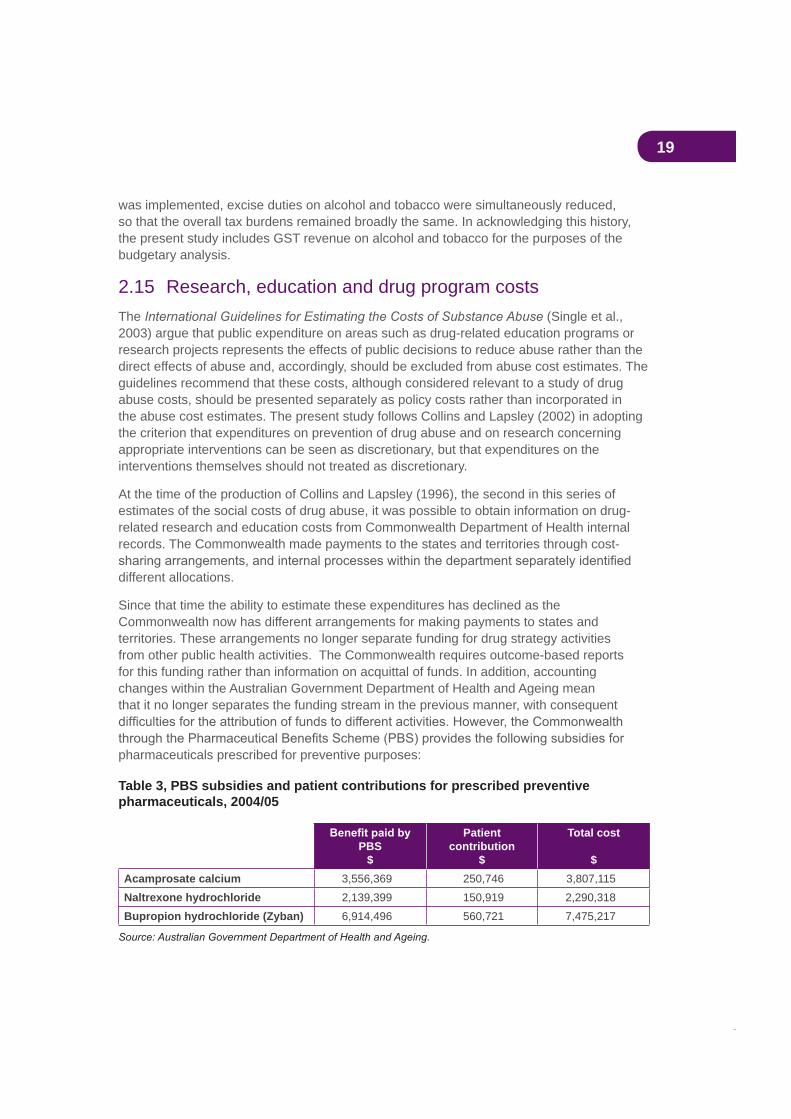
Since that time the ability to estimate these expenditures has declined as the Commonwealth now has different arrangements for making payments to states and territories. These arrangements no longer separate funding for drug strategy activities from other public health activities. The Commonwealth requires outcome-based reports for this funding rather than information on acquittal of funds. In addition, accounting changes within the Australian Government Department of Health and Ageing mean that it no longer separates the funding stream in the previous manner, with consequent
pharmaceuticals prescribed for preventive purposes:
Table 3, PBS subsidies and patient contributions for prescribed preventive pharmaceuticals, 2004/05
PBS$
Patientcontribution
$
Total cost
$Acamprosate calcium 3,556,369 250,746 3,807,115Naltrexone hydrochloride 2,139,399 150,919 2,290,318Bupropion hydrochloride (Zyban) 6,914,496 560,721 7,475,217

20
In principle, it would be desirable to estimate expenditures on drug-related research and education by the law enforcement, customs and education sectors. It seems likely that the effort from these agencies is increasing but the information necessary to estimate drug-related expenditures by these bodies is not published, and probably not collected.
The Australian Bureau of Statistics, in its publication on sources of Australian data on illicit
expenditures. It refers to the only published source of such data—a survey of government expenditure on drug programs and services by the Alcohol and Other Drugs Council of Australia (Crosbie and McNiven, 1999) and comments:
The paper contained data on Commonwealth, State and Territory Government
services, with no distinction between alcohol, tobacco and other drugs, including illicit drugs, and the comparability of data between States was problematic.
Australian Bureau of Statistics, 1(4808.0, p. 43).
As a result of these problems it has once again not proved possible, for the purposes of the
drug-related research and education, and on drug programs.

21
3. Availability of new or revised methodologies and data
This section provides details of areas of estimation where revised or new estimation methodologies have become available or where data availability has improved.
3.1 The impact of the GST on the taxation of alcohol and tobacco
This study, like previous studies by the present authors in this series, estimates the budgetary impact of drug abuse on the Commonwealth and on the states and territories (referred to subsequently for the purpose of brevity as the states). This involves a comparison of drug-attributable expenditures, for example on healthcare and justice, with the relevant tax revenues. Since the previous study (Collins and Lapsley, 2002) there have
Prior to 1997, tobacco was taxed through federal customs and excise duties and state franchise fees. Alcohol was subject to the federal wholesale sales tax as well as customs and excise duties and franchise fees. In August 1997, in response to a challenge to NSW franchise fees on tobacco, a High Court decision in Wales struck down these fees. This decision clearly also had applicability to tobacco franchise fees imposed by other states and to liquor franchise fees across all states and, as a result, all franchise fees were suspended.
As a consequence, the Commonwealth Government negotiated a safety net agreement with the states under which the Commonwealth would increase its tax rates on alcohol and tobacco to cover the revenue which would have been raised by the now-suspended franchise fees. The safety net revenue was returned to the states as Revenue Replacement
and Lapsley (2002).
In July 2000 the Commonwealth Government introduced the Goods and Services Tax (GST) and abolished the wholesale sales tax, as part of a complicated package of changes resulting from the 1999 Intergovernmental Agreement (IGA) negotiated between the Commonwealth and the states. The IGA changed the methods of taxing alcohol and tobacco, and the distribution of that revenue between the Commonwealth and the states. Under the IGA, all GST revenue was earmarked for the states (though much of this revenue was clawed back by the Commonwealth through the simultaneous abolition of Financial Assistance Grants to the states).
22
It was intended that the GST should be applied to all forms of alcohol and tobacco at the standard rate of 10 per cent, but that the overall rates of tax on these products should be largely unchanged. Thus some compensatory changes in other taxes were implemented:
the GST.
sales tax on wine.
At the same time, to improve the effectiveness of the tobacco excise tax, its basis was
and taxation by tobacco weight. This reform was estimated at the time by Federal Treasury to yield an increase in tobacco tax revenue of $440m in a full year.
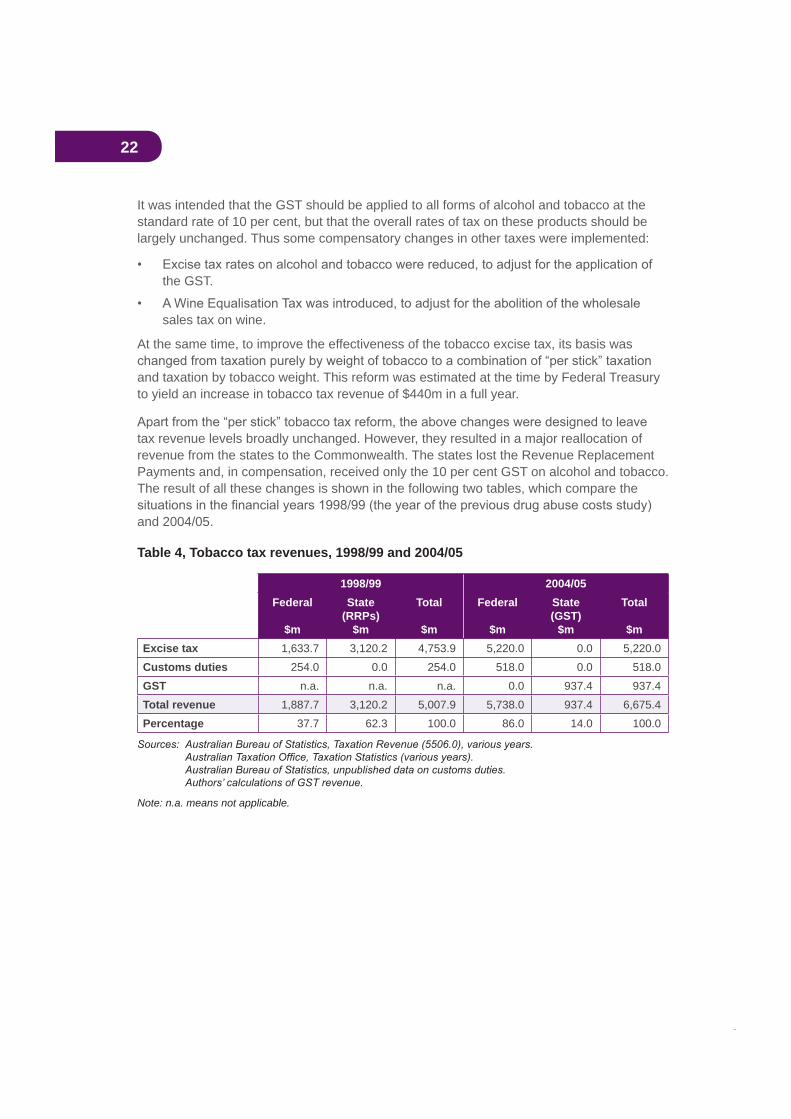
tax revenue levels broadly unchanged. However, they resulted in a major reallocation of revenue from the states to the Commonwealth. The states lost the Revenue Replacement Payments and, in compensation, received only the 10 per cent GST on alcohol and tobacco. The result of all these changes is shown in the following two tables, which compare the
and 2004/05.
Table 4, Tobacco tax revenues, 1998/99 and 2004/05
1998/99 2004/05Federal
$m
State(RRPs)
$m
Total
$m
Federal
$m
State(GST)
$m
Total
$mExcise tax 1,633.7 3,120.2 4,753.9 5,220.0 0.0 5,220.0Customs duties 254.0 0.0 254.0 518.0 0.0 518.0GST n.a. n.a. n.a. 0.0 937.4 937.4Total revenue 1,887.7 3,120.2 5,007.9 5,738.0 937.4 6,675.4Percentage 37.7 62.3 100.0 86.0 14.0 100.0
Note: n.a. means not applicable.
23
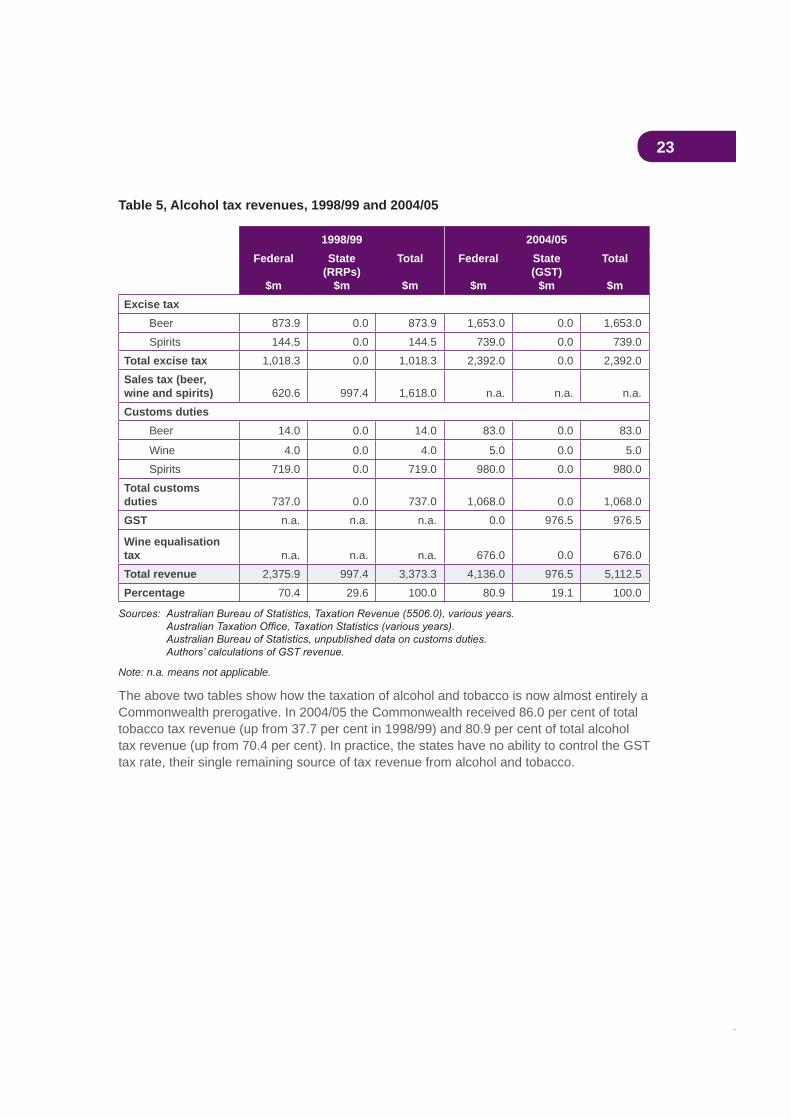
Table 5, Alcohol tax revenues, 1998/99 and 2004/05
1998/99 2004/05Federal
$m
State(RRPs)
$m
Total
$m
Federal
$m
State(GST)
$m
Total
$mExcise tax
Beer 873.9 0.0 873.9 1,653.0 0.0 1,653.0Spirits 144.5 0.0 144.5 739.0 0.0 739.0
Total excise tax 1,018.3 0.0 1,018.3 2,392.0 0.0 2,392.0Sales tax (beer, wine and spirits) 620.6 997.4 1,618.0 n.a. n.a. n.a.Customs duties
Beer 14.0 0.0 14.0 83.0 0.0 83.0
Wine 4.0 0.0 4.0 5.0 0.0 5.0Spirits 719.0 0.0 719.0 980.0 0.0 980.0
Total customs duties 737.0 0.0 737.0 1,068.0 0.0 1,068.0GST n.a. n.a. n.a. 0.0 976.5 976.5
Wine equalisation tax n.a. n.a. n.a. 676.0 0.0 676.0Total revenue 2,375.9 997.4 3,373.3 4,136.0 976.5 5,112.5Percentage 70.4 29.6 100.0 80.9 19.1 100.0
Note: n.a. means not applicable.
The above two tables show how the taxation of alcohol and tobacco is now almost entirely a Commonwealth prerogative. In 2004/05 the Commonwealth received 86.0 per cent of total tobacco tax revenue (up from 37.7 per cent in 1998/99) and 80.9 per cent of total alcohol tax revenue (up from 70.4 per cent). In practice, the states have no ability to control the GST tax rate, their single remaining source of tax revenue from alcohol and tobacco.
24
3.2 Production losses in the paid workforceDrug abuse can have an important impact upon the productivity of the paid workforce in three ways:
(a) reduction in the size of the available workforce as a result of drug-attributable deaths and illnesses causing premature retirement
(b) increased workforce absenteeism resulting from drug-attributable sickness or injury
(c) reduced on-the-job productivity as a result of drug-attributable morbidity.
These three components are now considered in detail.
3.2.1 Reduced workforce size
based is:
The value of the net resources which in a given year are unavailable to the community for consumption or investment purposes as a result of the effects of past and present drug abuse.
on the assumption that there had been no past or present abuse of the drug in question. An estimate is then made, from national accounts data, of the difference in potential production levels between the actual workforce and the counterfactual, no drug abuse, workforce.
3.2.2 Absenteeism
The absenteeism cost estimates in Collins and Lapsley (2002) relied heavily upon research by Bush and Wooden (1994), who studied the impact of smoking and alcohol on absences from the workplace. Their conclusions can be summarised in the following quotations:
After controlling for the effects of other variables, smokers were found to be 1.4 times more likely to be absent, and ex-smokers to be 1.3 times more likely to be absent than those who have never smoked.
In particular, interaction between smoking status and sex produced probabilities of absence that were different for men and women. For male smokers the probability climbed to 1.7 times greater than those who have never smoked and for female smokers the probability of absence decreased slightly to 1.2 times greater than those who have never smoked.
NHMRC are about 1.2 times more likely to be absent than other drinkers and those who do not drink.
25
Since the publication of Collins and Lapsley (2002), Pidd et al. (2006) have argued that the 1998/99 costs of absenteeism attributable to consumption of alcohol were seriously underestimated. Their research is based upon data collected as part of the
. They estimate, on the basis of self-reported results in the survey, that 2,683,000 workdays were lost in 2001 as a result of alcohol-attributable absenteeism. Using an alternative technique which calculates for differences in the illness-related or injury-related absenteeism of drinkers and non-drinkers, they estimate that 7,400,000 workdays were lost as a result of alcohol consumption. Following the conservative approach adopted in the present research, the lower of the two estimates is adopted here.
The Bush and Wooden (1994) data and the Pidd et al. (2006) results, together with prevalence data on smoking and drinking from the
and Australian Bureau of Statistics data on employee absences from work and their causes, permit the estimation of the excess absenteeism attributable to smoking and drinking compared with the rest of the workforce.
While neither Bush and Wooden nor Pidd et al.estimate the probability of absenteeism due to consumption of illicit drugs, it seems a reasonable assumption that the relationship between absenteeism in the workforce and the number of attributable hospital bed days for patients of workforce age is similar for tobacco and illicit drugs. Thus, this ratio is used to estimate the absenteeism attributable to illicit drug use. It seems plausible that a higher proportion of illicit drug users than smokers are unemployable. If this were the case, the above methodology would tend to underestimate illicit-attributable absenteeism.
3.2.3 On-the-job productivity
Once again, it has not been possible to identify research from which a reliable estimate of drug-attributable reductions in on-the-job productivity could be produced. We continue to
3.3 Production losses in the household sectorDrug-attributable sickness or death cause production losses not only in the paid workforce but also in the unpaid household sector. The total economy of a nation consists of both market and non-market sectors. The non-market sector uses, in an unpaid capacity, considerable human resources for the production of goods and services which are directly consumed by households without going through the market. These activities, though productive, are in almost all cases not included in conventional national accounts statistics (see, for example, 1993).
The estimates presented here of the value of production losses in the household sector are based upon the most recent ABS estimates of unpaid work in the publication
ABS study is as follows:

26
Household production consists of those unpaid activities which are carried on, by and for the members, which activities might be replaced by market goods or paid services, if circumstances such as income, market conditions and personal inclinations permit the service being delegated to someone outside the household group.
A household activity is considered as unpaid work if an economic unit other than the household itself could have supplied the household with an equivalent service. The ABS estimates take account of domestic activities, childcare, purchasing of goods and services, and volunteer and community work. All are services which will be lost by the community in the event of the severe sickness or death of the person supplying them, and therefore should be counted as a component of social cost.
The ABS reports four possible valuation methodologies—individual function replacement cost, housekeeper replacement cost and opportunity cost (gross and net). The valuation method chosen for the purposes of this study is that which is preferred by the ABS, the individual function replacement cost. This method assigns values to the time spent on household production by household members according to the cost of hiring the market replacement for each individual function.
The values derived from the ABS estimates, updated to 2004/05 levels, are applied to the most recent data on drug-attributable mortality and morbidity developed for the purposes of the present study to yield estimates of production losses in the household sector.
3.4 Health
3.4.1 Hospitals
This study applies well-validated case-mix costs to the episodes of hospital care which have
average hospital costs.
in this study. While overall hospital costs have been increasing, lengths of stay for most morbidities have been decreasing and patients are treated more intensively during their inpatient stay. A greater amount of acute care is being provided outside acute hospitals, or provided within hospitals as services to non-inpatients. Medical and pharmaceutical costs identify some of these services, but it has still not been possible to cost allied health services, nor other non-medical health services provided within the community.
3.4.2 Medical costs
The total value of medical costs in 2004/05, and the sources of funds for these expenditures, are presented in the Australian Institute of Health and Welfare publication
, Table A1. The relevant proportions of this total cost are allocated to the individual drugs (alcohol, tobacco and illicit drugs) according to the estimated attributable hospital bed days.
27
3.4.3 Nursing homes
Residential care for the sick and disabled aged population has an attributable fraction, derived from the calculation of primary conditions and co-morbidities of people using residential aged care. The estimates have been made only for residential care, and do not include the costs of community care services. This results in an underestimate of aged care costs related to tobacco, alcohol and illicit drug use, as an increasing proportion of services for this population are provided through a range of programs outside residential aged care facilities.
Examples of increased drug morbidity in nursing homes include cases of alcohol-related psychoses leading to dementia, the tobacco-related age impairment of ventilatory function and illicit drug-related conditions of infective entoconditis and true psychoses. One example demonstrated by an early Australian study shows that the absence of addiction to tobacco, alcohol and illicit drugs lessens morbidity, delays mortality and reduces the use of health services (Webster and Rawson, 1979).
The proportion of the aged who are in nursing homes because of drug-related conditions varies mainly as a function of geography, socio-economic status and gender. Drugs cause gross disability in the aged which is more evident in the nursing home population than in the equivalent age cohort in the community. Taking all these factors into consideration, it is estimated conservatively that drug-related morbidity in nursing homes is 15 per cent higher than in the equivalent outside community and that at least 15 per cent of all nursing home admissions have drug-related morbidities.
3.4.4 Ambulances
The only data available on illicit drug-attributable ambulance use relate to ambulance
relate to ambulance attendances where the Ambulance Service Protocol 28 (drug overdose and poisoning) was used and where a narcotic antagonist (such as Naloxone/Narcan) was administered. The (Attachment 8A) provides data on total ambulance attendances by state and for Australia as a whole. By applying the proportion of total NSW ambulance attendances which related to drug overdoses to the Australia-wide number of attendances for all causes, an estimate can be produced for drug overdose-related ambulance attendances Australia-wide.
Dietz et al. (2000) studied ambulance attendance at heroin overdoses in Melbourne for
updated to 2004/05 values by applying the increase in Australia-wide average ambulance attendance costs for all causes, calculated from data in the
(Attachment 10A) and (Attachment 8A). Application of this average overdose attendance cost to the estimated number of overdose-related ambulance attendances produces an estimate of total overdose attendance costs.
the consumption of tobacco and alcohol. The Western Australian Department of Health collects data on separations arriving at hospital by ambulance at a level of disaggregation
28
which permits linking to tobacco- and alcohol-attributable medical conditions. The relevant attributable fractions are applied to these data to yield estimates of attributable ambulance services. These results are then used to estimate Australia-wide attributable ambulance costs by application of ambulance usage and cost data in the
(Attachment 8A).
3.4.5 Pharmaceuticals
The pharmaceutical cost estimates presented below relate to selected pharmaceuticals
risk-related fractions, and for which hospital and medical services are provided. The same fraction as in the calculation of hospital and medical services has been applied to each of these drugs. This is necessarily only a partial calculation since it does not include costs of non-prescribed (across-the-counter) drugs consumed in relation to tobacco- or alcohol-attributable conditions, and it has costed only those included in the one hundred highest
drug-attributable pharmaceutical costs.
As discussed previously, an increasing component of treatment and care is provided on a non-inpatient basis. It is, therefore, important to identify these costs wherever possible. The cost estimates presented below apply only to prescription pharmaceuticals provided outside the hospital sector. In-patient pharmaceutical costs are incorporated in Diagnosis-Related Groups (DRG) hospital costs.
As this calculation applies only to prescribed pharmaceuticals to maintain or improve health status for tobacco-attributable and alcohol-attributable conditions, it does not include the costs of abuse or misuse of pharmaceuticals. We recognise that such abuse has
cost estimates do not include the government-subsidised costs of prescription drugs which support smoking cessation.
3.5 Road accidentsThe estimates of drug-attributable road accident costs presented here are based on Bureau of Transport Economics estimates of aggregate road crash costs in Australia in 1996 (Bureau of Transport Economics, 2000).
is attributable to the consumption of alcohol (Ridolfo and Stevenson, 2001, p. 30). Evidence has also emerged of a causal link between illicit drug use and motor vehicle accidents (see Appendix C for the attributable fractions). There appears to be no convincing evidence that road accidents are causally linked to tobacco consumption. The aetiological fractions presented in Appendix C are used to estimate the proportions of road accident costs calculated by the BTE which are attributable to abuse of alcohol and illicit drugs. The 1996 estimates are factored to 2004/05 values by use of the Australian National Accounts implicit
accidents over the period.

29
However, some categories of road crash costs are calculated by the BTE on a different basis from that used in this study, since the concepts of cost adopted in the two studies differ. In essence, the BTE study uses a human capital approach while the present study uses a demographic approach (for an explanation of this distinction see the section above on ‘Demographic and human capital approaches’). For costs which are fully borne in the year in which the crash takes place (for example, vehicle repairs and the provision
ongoing into the future (for example, medical/ rehabilitation services and long-term care), this study adopts a different estimation methodology from that of the BTE.
The BTE study estimates road crash costs in the following categories:
Human costs MedicalAmbulanceRehabilitation *Long-term care *Labour in the workplace *Labour in the household *Quality of life *LegalCorrectional servicesWorkplace disruption Premature funeralsCoroner
Vehicle costs RepairsUnavailability of vehiclesTowing
General costs Travel delaysInsurance administrationPoliceNon-vehicle property damageFire and emergency services
The symbol * in the above list indicates that the cost item in the present study has been calculated using a different methodology from that utilised by BTE.
For its estimates of drug-attributable hospital costs, labour in the workplace, and labour in the household, the present study uses data derived from Ridolfo and Stevenson (2001). These data are more recent than those used in the BTE study.
It is assumed in the present study that all legal costs are incurred in the year in which the crash occurs. This assumption yields results close to reality since crashes in a given year may not be fully legally processed in that year but, in compensation, some legal costs will be resulting from crashes occurring in previous years.
30
The BTE study calculates the value of the quality of life lost as a result of death or injury by reference to compensation payments from the Victorian Transport Accident Commission. The approach of the present report to the valuation of life is to adopt the willingness-to-pay approach discussed above. However, the BTE estimate for the loss of quality of life resulting from road accident injuries is accepted on the assumption that all such costs are borne in the year of the accident. Again, as with legal costs, this assumption yields results close to reality. Pain and suffering resulting from crashes in a given year may extend into future years but, for the same reason, some pain and suffering resulting from crashes in previous years will carry over into the year under review.
3.6 Fires caused by smoking
from research conducted by the Operations and Risk Planning Unit of the Queensland Fire and Rescue Service (see Queensland Fire and Rescue Service, 2006). This research
it is possible to estimate average smoking-attributable property damage for Australia as a
costs can also be estimated.
the (Steering Committee, 2006, Attachment 8A). In
adopted analogous averaging procedures to those adopted here.
The epidemiological data used in the present study separately identify tobacco-attributable
lighted cigarettes. It also becomes possible to estimate the impact of smoking-attributable
such as national parks loss of animals and loss of amenity during bush regeneration—they
3.7 Resources used in the consumption of illicit drugsThe Australian Institute of Criminology Drug Use Careers of Offenders (DUCO) survey provides estimates of expenditures on illicit drugs by prisoners prior to their incarceration. These expenditure data, weighted by prevalence rates for frequent drug users, can be used to estimate the street value of traded drugs, which can then be discounted to adjust for the
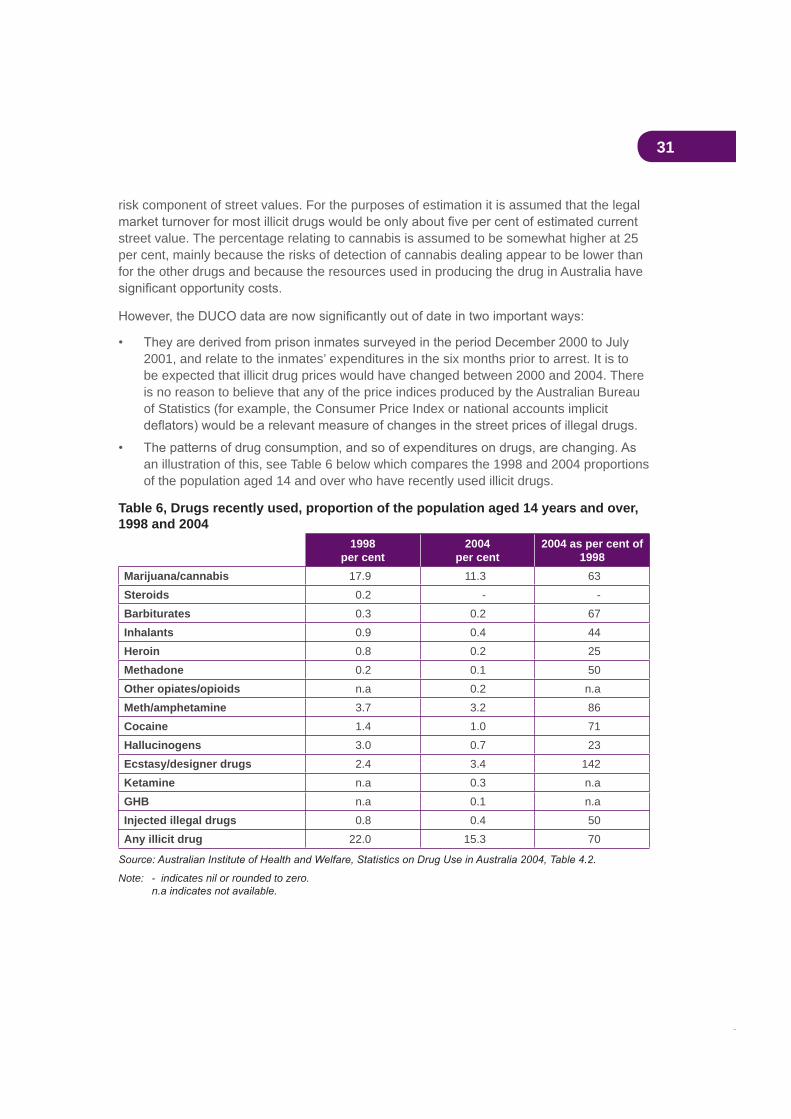
31
risk component of street values. For the purposes of estimation it is assumed that the legal
street value. The percentage relating to cannabis is assumed to be somewhat higher at 25 per cent, mainly because the risks of detection of cannabis dealing appear to be lower than for the other drugs and because the resources used in producing the drug in Australia have
2001, and relate to the inmates’ expenditures in the six months prior to arrest. It is to be expected that illicit drug prices would have changed between 2000 and 2004. There is no reason to believe that any of the price indices produced by the Australian Bureau of Statistics (for example, the Consumer Price Index or national accounts implicit
an illustration of this, see Table 6 below which compares the 1998 and 2004 proportions of the population aged 14 and over who have recently used illicit drugs.
Table 6, Drugs recently used, proportion of the population aged 14 years and over, 1998 and 2004
1998per cent
2004per cent
2004 as per cent of 1998
Marijuana/cannabis 17.9 11.3 63Steroids 0.2 - -Barbiturates 0.3 0.2 67Inhalants 0.9 0.4 44Heroin 0.8 0.2 25Methadone 0.2 0.1 50Other opiates/opioids n.a 0.2 n.aMeth/amphetamine 3.7 3.2 86Cocaine 1.4 1.0 71Hallucinogens 3.0 0.7 23Ecstasy/designer drugs 2.4 3.4 142Ketamine n.a 0.3 n.aGHB n.a 0.1 n.aInjected illegal drugs 0.8 0.4 50Any illicit drug 22.0 15.3 70
Note: - indicates nil or rounded to zero.
32
The estimates presented here of the resources used in the consumption of illegal drugs apply 2004 prevalence data to the DUCO expenditures. From these data are estimated total street values of illegal drugs consumed in 2004. In order to estimate the value which these resources would have in other legitimate uses, these total street values are discounted to eliminate their risk component. However, DUCO expenditure data are not available for barbiturates, inhalants, other opiates/opioids, ecstasy, ketamine and GBH. Accordingly, the
3.8 LitterCosts of litter associated with drug abuse are both tangible and intangible, and apply to each category of drug. Costs are borne by governments, particularly state and local governments, and by individuals. There are a number of surveys documenting types and amounts of environmental litter, but none of these studies enable the resource costs or the
Litter caused by smoking predominantly consists of cigarette butts and cigarette packets which have been thrown away, swept into storm-water drains, or recovered during environmental clean-up days. These costs are not borne by the litterers.
Litter costs associated with alcohol include discarded bottles, cans, ring-pulls, and broken glass. Together with tobacco litter, such litter is ugly and, in the case of broken glass, can be dangerous. The presence of litter diminishes the value of scenery, bushland and coasts.
Litter costs attributed to illicit drugs relate to drug paraphernalia including syringes and, like broken glass, comprise a considerable public health hazard. Most of these costs can be substantially reduced through public education and enforced regulation, but it has not been possible to estimate the costs of litter, let alone effective interventions.
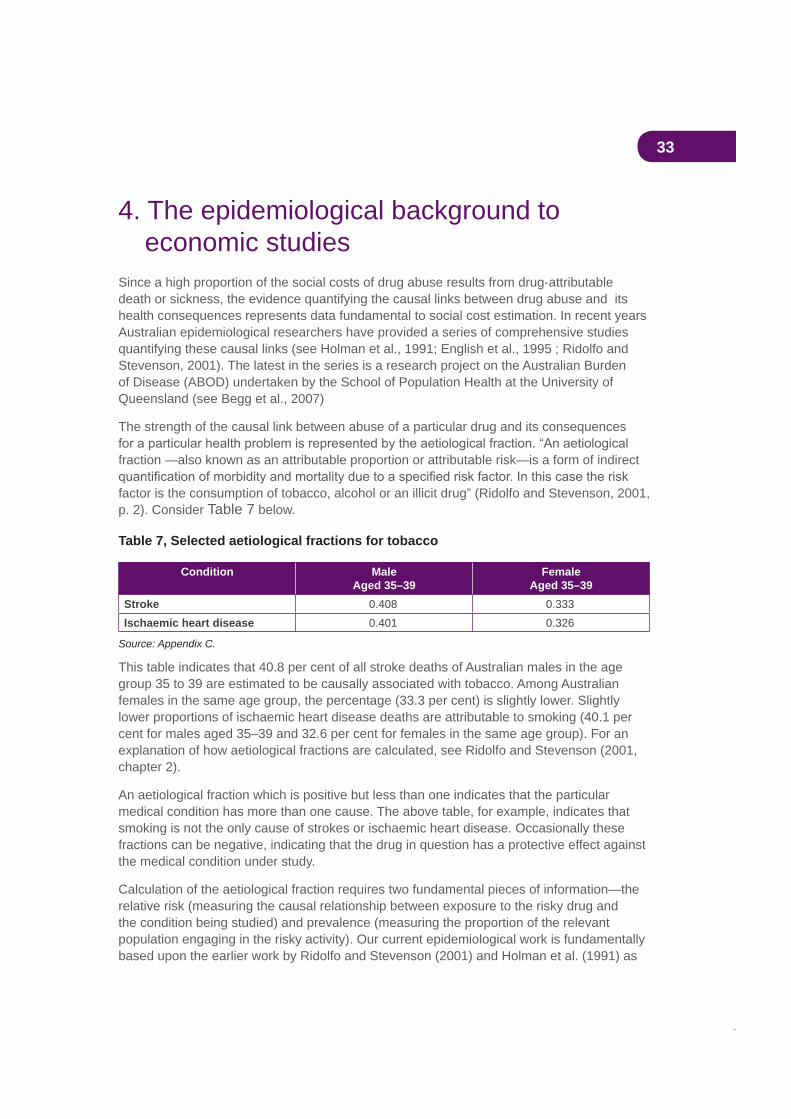
33
4. The epidemiological background to economic studies
Since a high proportion of the social costs of drug abuse results from drug-attributable death or sickness, the evidence quantifying the causal links between drug abuse and its health consequences represents data fundamental to social cost estimation. In recent years Australian epidemiological researchers have provided a series of comprehensive studies quantifying these causal links (see Holman et al., 1991; English et al., 1995 ; Ridolfo and Stevenson, 2001). The latest in the series is a research project on the Australian Burden of Disease (ABOD) undertaken by the School of Population Health at the University of Queensland (see Begg et al., 2007)
The strength of the causal link between abuse of a particular drug and its consequences
fraction —also known as an attributable proportion or attributable risk—is a form of indirect
factor is the consumption of tobacco, alcohol or an illicit drug” (Ridolfo and Stevenson, 2001, p. 2). Consider Table 7 below.
Table 7, Selected aetiological fractions for tobacco
Condition MaleAged 35–39
FemaleAged 35–39
Stroke 0.408 0.333Ischaemic heart disease 0.401 0.326
Source: Appendix C.
This table indicates that 40.8 per cent of all stroke deaths of Australian males in the age group 35 to 39 are estimated to be causally associated with tobacco. Among Australian females in the same age group, the percentage (33.3 per cent) is slightly lower. Slightly lower proportions of ischaemic heart disease deaths are attributable to smoking (40.1 per cent for males aged 35–39 and 32.6 per cent for females in the same age group). For an explanation of how aetiological fractions are calculated, see Ridolfo and Stevenson (2001, chapter 2).
An aetiological fraction which is positive but less than one indicates that the particular medical condition has more than one cause. The above table, for example, indicates that smoking is not the only cause of strokes or ischaemic heart disease. Occasionally these fractions can be negative, indicating that the drug in question has a protective effect against the medical condition under study.
Calculation of the aetiological fraction requires two fundamental pieces of information—the relative risk (measuring the causal relationship between exposure to the risky drug and the condition being studied) and prevalence (measuring the proportion of the relevant population engaging in the risky activity). Our current epidemiological work is fundamentally based upon the earlier work by Ridolfo and Stevenson (2001) and Holman et al. (1991) as

34
well as on the recent University of Queensland ABOD study (Begg et al., 2007). Appendix C explains the derivation of the epidemiological estimates used in the current study.
Table 8 lists all the conditions which Appendix C concludes are causally linked to the abuse of alcohol, tobacco or illicit drugs.
Table 8
Alcohol Tobacco IllicitsOropharyngeal cancer Oropharyngeal cancer Opiate dependenceOesophageal cancer Oesophageal cancer Opiate abuseLiver cancer Stomach cancer Opiate poisoningLaryngeal cancer Pancreatic cancer Accidental opiate poisoningFemale breast cancer Laryngeal cancer Cannabis dependenceAlcoholic psychosis Lung cancer Cannabis abuseAlcohol dependence/abuse Cervical cancer Amphetamine dependenceAlcoholic liver cirrhosis Endometrial cancer Amphetamine abuseRoad injuries Bladder cancer Cocaine dependenceAlcoholic poly-neuropathy Kidney cancer Cocaine abuseHypertension Ischaemic heart disease Psychostimulant poisoningIschaemic heart disease Chronic obstructive pulmonary
diseaseAccidental poison by psychostimulants
Alcoholic cardiomyopathy Tobacco abuse Hallucinogen dependenceSupraventricular cardiac dysrhythmias
Parkinson’s disease Hallucinogen abuse
Heart failure Pulmonary circulation disease Hallucinogen poisoningStroke—haemorrhagic/ischaemic
Cardiac dysrhythmias Other psychotropic drug poisoning
Oesophageal varices Heart failure Accidental poisoning by hallucinogens
Gastro-oesophagealhaemorrhage
Stroke Anabolic steroid poisoning
Alcoholic gastritis Peripheral vascular disease Hepatitis BLower respiratory tract infection Hepatitis C
Cholelithiasis Crohn’s disease HIV/AIDSPancreatitis—acute/chronic Ulcerative colitis Infective endocarditisAlcoholic beverage & other EtOH poisoning
Antepartum haemorrhage Drug psychoses
Fall injuries Low birthweight Maternal drug dependenceFire injuries SIDS Newborn drug toxicityDrowning Fire injuries Antepartum haemorrhageAspiration Asthma (under 15 years) Low birthweightOccupational and machine injuries
Macular degeneration Road injuries
Otitis media SuicideChild abuse & assault Lung cancer (passive) Schizophrenia
Ischaemic heart disease (passive)
Source: Appendix C.

35
It is acknowledged that there are a number of conditions (such as depression and anxiety) for which aetiological fractions have not yet been developed but for which there is already evidence relating to drugs as a causal factor. However, without attributable fractions the
4.1 Causal interactions between drugsEnglish et al. (1995) acknowledged the possibility of double-counting of drug-caused deaths in a situation in which the estimated numbers of deaths attributable to each of the drugs (alcohol, tobacco and illicit drugs) were added together to give a total for all drug-caused deaths. After examining the epidemiological evidence they concluded that interaction occurred in relation to only three conditions—oropharyngeal cancer, laryngeal cancer and
assumption of double-counting of deaths from all three conditions, the number of deaths for 2004/05 would be overestimated by 2.18 per cent (366 cases) of total deaths from all drug-attributable conditions in that year.
while estimates of the social costs of drugs are not affected by the problem, there is some slight overestimation of mortality-related and morbidity-related costs involved when individual drug costs are aggregated to yield total drug costs. Accordingly, to eliminate the possible effect of double counting we discount the aggregate estimates of these types of costs by 2.18 per cent, the extent of the estimated double counting.
Interpretation of estimates of the social costs of alcohol use and misuse is more complex than for tobacco or illicit drugs. For some medical conditions, alcohol consumption at appropriate levels can have a protective effect; that is, alcohol consumption can reduce the risk of illness or death. With minor exceptions in relation to tobacco, there is no evidence of
Table 9 below presents a summary of the alcohol-attributable conditions for which the abstinence-based aetiological fractions are negative. Abstinence-based means that
consumption relative to a baseline of complete abstinence from alcohol. A negative aetiological fraction means that alcohol consumption has a protective effect against the relevant condition.
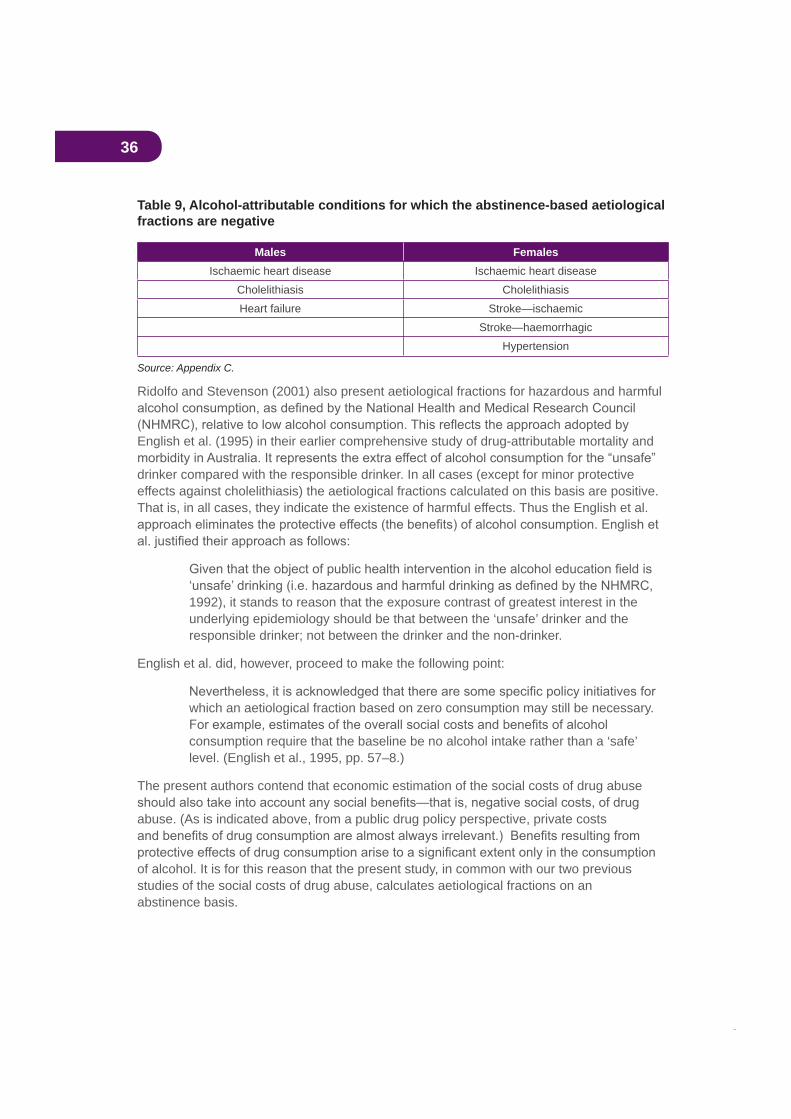
36
Table 9, Alcohol-attributable conditions for which the abstinence-based aetiological fractions are negative
Males FemalesIschaemic heart disease Ischaemic heart disease
Cholelithiasis CholelithiasisHeart failure Stroke—ischaemic
Stroke—haemorrhagicHypertension
Source: Appendix C.
Ridolfo and Stevenson (2001) also present aetiological fractions for hazardous and harmful
English et al. (1995) in their earlier comprehensive study of drug-attributable mortality and
drinker compared with the responsible drinker. In all cases (except for minor protective effects against cholelithiasis) the aetiological fractions calculated on this basis are positive. That is, in all cases, they indicate the existence of harmful effects. Thus the English et al.
1992), it stands to reason that the exposure contrast of greatest interest in the underlying epidemiology should be that between the ‘unsafe’ drinker and the responsible drinker; not between the drinker and the non-drinker.
English et al. did, however, proceed to make the following point:
which an aetiological fraction based on zero consumption may still be necessary.
consumption require that the baseline be no alcohol intake rather than a ‘safe’ level. (English et al., 1995, pp. 57–8.)
The present authors contend that economic estimation of the social costs of drug abuse
abuse. (As is indicated above, from a public drug policy perspective, private costs
of alcohol. It is for this reason that the present study, in common with our two previous studies of the social costs of drug abuse, calculates aetiological fractions on an abstinence basis.
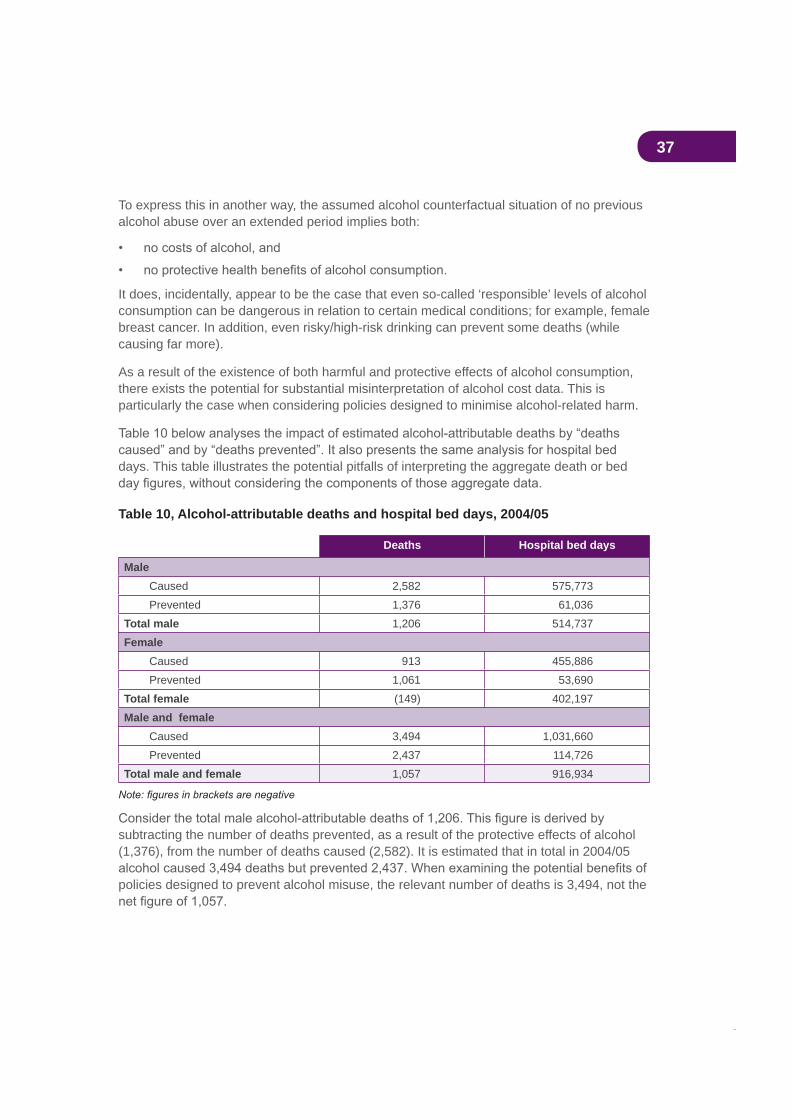
37
To express this in another way, the assumed alcohol counterfactual situation of no previous alcohol abuse over an extended period implies both:
It does, incidentally, appear to be the case that even so-called ‘responsible’ levels of alcohol consumption can be dangerous in relation to certain medical conditions; for example, female breast cancer. In addition, even risky/high-risk drinking can prevent some deaths (while causing far more).
As a result of the existence of both harmful and protective effects of alcohol consumption, there exists the potential for substantial misinterpretation of alcohol cost data. This is particularly the case when considering policies designed to minimise alcohol-related harm.
days. This table illustrates the potential pitfalls of interpreting the aggregate death or bed
Table 10, Alcohol-attributable deaths and hospital bed days, 2004/05
Deaths Hospital bed days
MaleCaused 2,582 575,773Prevented 1,376 61,036
Total male 1,206 514,737Female
Caused 913 455,886Prevented 1,061 53,690
Total female (149) 402,197Male and female
Caused 3,494 1,031,660Prevented 2,437 114,726
Total male and female 1,057 916,934
subtracting the number of deaths prevented, as a result of the protective effects of alcohol (1,376), from the number of deaths caused (2,582). It is estimated that in total in 2004/05
policies designed to prevent alcohol misuse, the relevant number of deaths is 3,494, not the
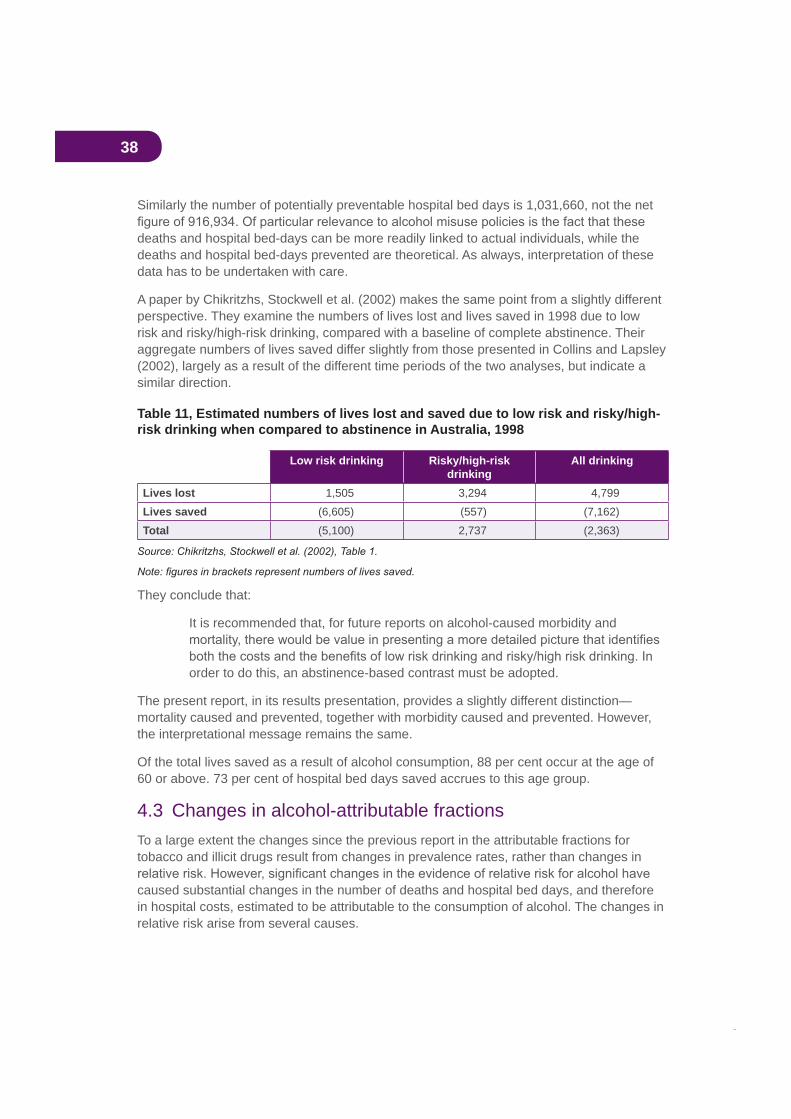
38
Similarly the number of potentially preventable hospital bed days is 1,031,660, not the net
deaths and hospital bed-days can be more readily linked to actual individuals, while the deaths and hospital bed-days prevented are theoretical. As always, interpretation of these data has to be undertaken with care.
A paper by Chikritzhs, Stockwell et al. (2002) makes the same point from a slightly different perspective. They examine the numbers of lives lost and lives saved in 1998 due to low risk and risky/high-risk drinking, compared with a baseline of complete abstinence. Their aggregate numbers of lives saved differ slightly from those presented in Collins and Lapsley (2002), largely as a result of the different time periods of the two analyses, but indicate a similar direction.
Table 11, Estimated numbers of lives lost and saved due to low risk and risky/high-risk drinking when compared to abstinence in Australia, 1998
Low risk drinking Risky/high-riskdrinking
All drinking
Lives lost 1,505 3,294 4,799Lives saved (6,605) (557) (7,162)Total (5,100) 2,737 (2,363)
They conclude that:
It is recommended that, for future reports on alcohol-caused morbidity and
order to do this, an abstinence-based contrast must be adopted.
The present report, in its results presentation, provides a slightly different distinction—mortality caused and prevented, together with morbidity caused and prevented. However, the interpretational message remains the same.
Of the total lives saved as a result of alcohol consumption, 88 per cent occur at the age of 60 or above. 73 per cent of hospital bed days saved accrues to this age group.
4.3 Changes in alcohol-attributable fractionsTo a large extent the changes since the previous report in the attributable fractions for tobacco and illicit drugs result from changes in prevalence rates, rather than changes in
caused substantial changes in the number of deaths and hospital bed days, and therefore in hospital costs, estimated to be attributable to the consumption of alcohol. The changes in relative risk arise from several causes.
39
The current method sees the exclusion (compared with the previous work) of epilepsy and
hypertension.
The net number of alcohol-caused deaths/hospitalisations was greater in the current study than would have been previously estimated due to a combination of the above factors but, more importantly, due to revisions of the attributable fractions (AFs) applied to a number of key diseases. These revisions have arisen from work recently undertaken by the University of Queensland Australian Burden of Disease (ABOD) research project. The ABOD report (Begg et al., 2007, p. 84) makes the following comment:
the previous Australian burden study (AIHW: Mathers et al 1999, AIHW: Ridolfo and Stevenson 2001) with only an estimated 2,346 deaths being prevented in 2003 compared to 7,157 deaths in 1996. This is due to the previous study underestimating the number of people who abstain from alcohol or drink less than 0.25 drinks per day.
For some diseases, the ABOD report utilised a lower AF for alcohol-caused cancers, hypertension, IHD, stroke, aspiration, drowning and suicide. While this reduced the numbers of deaths/hospitalisation due to conditions such as aspiration, drowning and suicide, the impact of smaller AFs was much greater in reducing the number of deaths/hospitalisations for IHD and stroke prevented by the consumption of alcohol. In general, the lower AFs are due to the lower prevalence of hazardous and harmful drinking reported in the ABOD report than that used by Ridolfo and Stevenson. While this contributes to the AFs for stroke and
contributes to the reduction in the attribution of these conditions to alcohol.
have implications for the demographic estimates used in the present study. These implications arise for two reasons:
1. It has not proved possible to recalculate the earlier alcohol-attributable fractions.
2. As explained in Appendix A, in the demographic calculations the English et al. (1995) attributable fractions are assumed to apply prior to 1988 (but without illicit drug deaths prior to 1962) and those of Ridolfo and Stevenson in 1998, with intermediate fractions for the period 1989–1997. Those of Codde (see Appendix C) are assumed to apply in 2006, with intermediate fractions from 1999 and 2005.
Because the Ricardo and Stevenson attributable fractions imply an overestimate of the number of alcohol-attributable deaths prevented, and thus an underestimate of net deaths, the demographic estimates used here will tend to understate the alcohol-attributable reduction in the 2004/05 population. It follows that the alcohol-attributable social costs presented below will also be underestimated.
It is unfortunate, from the perspective of this economic study, that the change in the epidemiological method of estimating the protective effects of alcohol has eliminated any
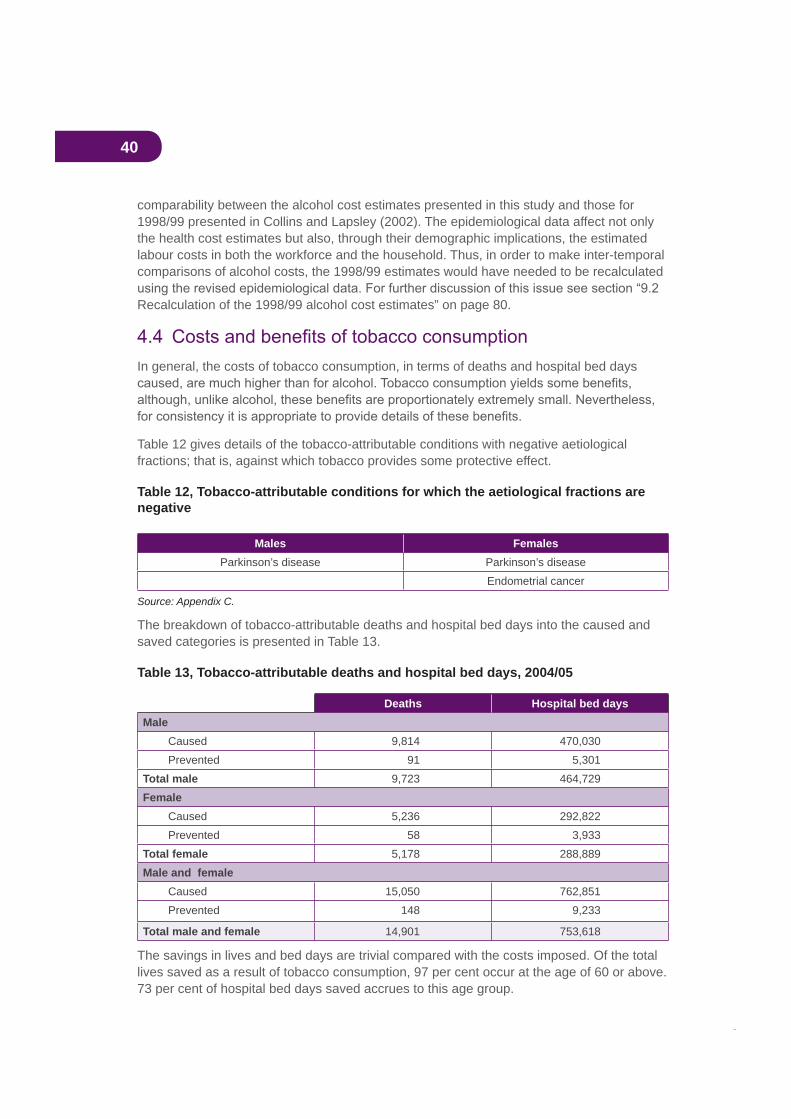
40
comparability between the alcohol cost estimates presented in this study and those for 1998/99 presented in Collins and Lapsley (2002). The epidemiological data affect not only the health cost estimates but also, through their demographic implications, the estimated labour costs in both the workforce and the household. Thus, in order to make inter-temporal comparisons of alcohol costs, the 1998/99 estimates would have needed to be recalculated
Recalculation of the 1998/99 alcohol cost estimates” on page 80.
In general, the costs of tobacco consumption, in terms of deaths and hospital bed days
Table 12 gives details of the tobacco-attributable conditions with negative aetiological fractions; that is, against which tobacco provides some protective effect.
Table 12, Tobacco-attributable conditions for which the aetiological fractions are negative
Males FemalesParkinson’s disease Parkinson’s disease
Endometrial cancer
Source: Appendix C.
The breakdown of tobacco-attributable deaths and hospital bed days into the caused and saved categories is presented in Table 13.
Table 13, Tobacco-attributable deaths and hospital bed days, 2004/05
Deaths Hospital bed daysMale
Caused 9,814 470,030Prevented 91 5,301
Total male 9,723 464,729Female
Caused 5,236 292,822Prevented 58 3,933
Total female 5,178 288,889Male and female
Caused 15,050 762,851Prevented 148 9,233
Total male and female 14,901 753,618
The savings in lives and bed days are trivial compared with the costs imposed. Of the total lives saved as a result of tobacco consumption, 97 per cent occur at the age of 60 or above. 73 per cent of hospital bed days saved accrues to this age group.
41
5. Estimation of drug-attributable crime costsIn studying the drug-attributable costs of crime, only those crime costs should be estimated where a causal connection can be demonstrated between the consumption of a drug
confuse association with causation would result in a vast overestimate of the costs of drug-attributable crime.
5.1 Models of the drugs–crime relationshipThere are four models which explain different causal roles for illicit drugs and alcohol in relation to the commission of crime (see Pernanen et al., 2000, 2002).
The pharmacological or intoxication model. The assumption of this model is that drug intoxication encourages the commission of crimes which would otherwise not have been committed. In alcohol studies, this model is frequently referred to as the
The economic means model. This model concerns crimes which are committed to fund the acquisition of illicit drugs or alcohol.
The systemic model. This model concerns crimes which result from involvement in the illegal economy related to drugs. It relates to crimes committed, for example, in selling
being criminal through legislation which regulates drug use. Examples of such crimes
100 per cent.
In practice, all four models are used in their appropriate contexts in the present study.
5.2 MethodologyThe basic methodology is to evaluate the total costs of a particular activity (for example, policing or incarceration) and then to estimate the proportion of these costs causally attributable (as opposed to related) to drug use. Thus the fundamental data needs are
A variety of sources are used to derive data on aggregate costs, though undoubtedly the most valuable sources are the by the Steering Committee for the Review of Commonwealth/State Service Provision.
A drug-attributable fraction for a particular category of crime (for example, violence or theft) indicates the proportion of this crime which is assessed to be causally attributable to consumption of the drug in question. The categories of drugs studied here are alcohol and illicit drugs. The nature of these attributable fractions is illustrated by Table 14 below, which
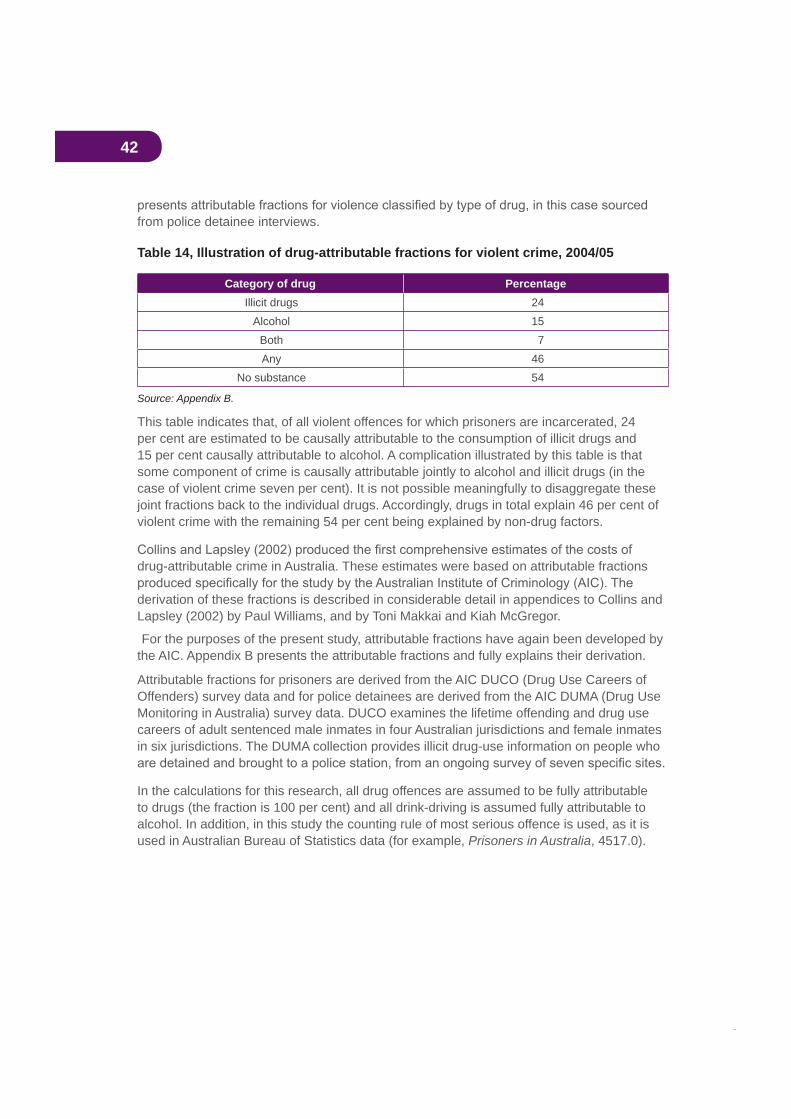
42
from police detainee interviews.
Table 14, Illustration of drug-attributable fractions for violent crime, 2004/05
Category of drug PercentageIllicit drugs 24
Alcohol 15Both 7Any 46
No substance 54
Source: Appendix B.
This table indicates that, of all violent offences for which prisoners are incarcerated, 24 per cent are estimated to be causally attributable to the consumption of illicit drugs and 15 per cent causally attributable to alcohol. A complication illustrated by this table is that some component of crime is causally attributable jointly to alcohol and illicit drugs (in the case of violent crime seven per cent). It is not possible meaningfully to disaggregate these joint fractions back to the individual drugs. Accordingly, drugs in total explain 46 per cent of violent crime with the remaining 54 per cent being explained by non-drug factors.
drug-attributable crime in Australia. These estimates were based on attributable fractions
derivation of these fractions is described in considerable detail in appendices to Collins and Lapsley (2002) by Paul Williams, and by Toni Makkai and Kiah McGregor.
For the purposes of the present study, attributable fractions have again been developed by the AIC. Appendix B presents the attributable fractions and fully explains their derivation.
Attributable fractions for prisoners are derived from the AIC DUCO (Drug Use Careers of Offenders) survey data and for police detainees are derived from the AIC DUMA (Drug Use Monitoring in Australia) survey data. DUCO examines the lifetime offending and drug use careers of adult sentenced male inmates in four Australian jurisdictions and female inmates in six jurisdictions. The DUMA collection provides illicit drug-use information on people who
In the calculations for this research, all drug offences are assumed to be fully attributable to drugs (the fraction is 100 per cent) and all drink-driving is assumed fully attributable to alcohol. In addition, in this study the counting rule of most serious offence is used, as it is used in Australian Bureau of Statistics data (for example, Prisoners in Australia, 4517.0).
43
5.3 Types of costsWe now consider calculation methods for the various categories of crime costs.
5.3.1 Policing
Steering Committee reports provide comprehensive cost data on policing at state and national levels. The data used are police expenditures net of receipts. These expenditures are allocated to the individual types of crime according to the proportions of detainee hours
from the Australian Institute of Criminology Taylor and Bareja, 2005), the most recent national data on police detainees. Appropriate proportions
drug-attributable crime according to the DUMA (detainee) attributable fractions.
Australian studies show that only around one-third of police call-outs result in a crime being recorded. Our analysis implicitly assumes that the attributable fractions for police call-outs not resulting in the recording of a crime are the same as for other call-outs.
5.3.2 Criminal courts
Comprehensive cost data are provided by Steering Committee reports. The data used are expenditures net of receipts for all levels of criminal courts. They are allocated to the
most serious offence, data derived from the National Police Custody Survey (Taylor and Bareja, 2005). They are then allocated to drug-attributable crime according to the DUMA (detainee) attributable fractions.
5.3.3 Prisons
Comprehensive cost data are provided by Steering Committee reports. The data used are prison expenditures net of receipts. They are allocated to the individual types of crime on the basis of data from the National Prisoner Census presented in the ABS publicationPrisoners in Australia (4517.0) and to drug-attributable crime according to the DUCO (prisoner) attributable fractions.
5.3.4 Customs
Services provided by the Australian Customs Service have a variety of simultaneous functions—border protection, immigration controls, prevention of smuggling, quarantine requirements and prevention of import of illicit drugs. In practice there appears to be no way to allocate joint costs between these various functions.
5.3.5 National Crime Authority
As in our previous study, we are still unable to identify any basis upon which it would be possible to identify the drug-attributable component of NCA costs.
44
5.3.6 Forgone productivity of criminals
If prisoners had not been incarcerated, their labour would have been released for productive use. However, there is reason to suspect that such labour would not in all cases have been put to productive use. Using data from the National Prisoner Census it is possible to estimate the value in a free market of the potential output of prisoners if they were not currently incarcerated.
Since there are no data available on the number of people engaged in drug-attributable crime but not detained or imprisoned, it is not possible to estimate the potential value of their labour in productive employment.
5.3.7 Private security services and home security
It would appear to be possible, from ABS data, to make very rough estimates of these types of costs. However, they are, in our view, discretionary prevention expenditures and so not relevant to this study.
5.3.8 Property theft and damage
A considerable amount of property theft is attributable to the consumption of alcohol or illicit drugs. However, conventional economic literature asserts that this type of theft does not represent a real loss to the community as a whole since, as long as the property is not subsequently damaged or destroyed, it merely represents a redistribution of assets from the victims (or perhaps insurance company customers and shareholders) to the thieves and their customers. We do not accept this argument completely since, in the process of
property to the thief is, in almost all cases, less than its value had been to the victim of the crime. The difference between the two values represents a cost to the community as a whole.
An Australian Institute of Criminology paper (Mayhew and Adkins, 2005) estimates the overall costs of crime in Australia in 2001, including the costs of various types of property crime. The categories of property crime whose costs are estimated are armed and unarmed robbery, burglary, shoplifting, vehicle theft, theft from vehicles, other theft and handling, and criminal damage. These costs can be updated to 2004/05 values by application of the ABS GDP chain price index.
In the judgment of the present authors, neither vehicle theft nor criminal damage can be causally attributed with any level of certainty to the consumption of drugs in the way that other property crime can. Accordingly, these two categories of property crime are assumed, for the purposes of this study, not to be affected by the consumption of drugs. DUCO (prisoner) attributable fractions are used to attribute the costs of property crime to drug consumption or to non-drug causes.
Information in Stevenson and Forsythe (1998) suggests that property on the stolen goods market will raise about 30 per cent of its new value but in a legitimate second-hand market would raise about 70 per cent of its new value. This indicates that theft causes social losses of about 40 per cent of the new value of property stolen and about 57 per cent of second-
45
hand values. The AIC report itself does not make clear whether its estimated property losses are new values or replacement (second-hand) values. However, private correspondence with one of the report’s authors indicates that the estimates represent replacement (that is, depreciated) values.
It was not possible to identify data on the basis of which the incidence of property losses (among households, business and government) could be estimated.
5.3.9 Administration of insurance against property theft and damage
The present report also estimates drug-attributable insurance costs. The costs of insurance against property loss have two components:
represents a pecuniary transfer from insurance non-claimers to insurance claimers, and does not constitute a resource cost
Mayhew and Adkins (2005) report an industry estimate of the costs of administering
to exclude the insurance administration costs relating to vehicle theft and criminal property damage (see above), the relevant insurance costs in 2001/2 are estimated to have been
allocated to drugs and other causes by application of the DUCO (prisoner) attributable fractions.
5.3.10 Violence
The epidemiological data used in this research include information on deaths, hospital episodes and bed days resulting from alcohol-attributable violence and these have been applied to DRG cost data to yield hospital costs. From these data the full costs of such violence can be determined.
No such information on illicit drug-attributable violence is provided by Ridolfo and Stevenson. However, it is possible to determine the relativities between alcohol- and illicit drug-attributable violence, and hence to estimate the social costs of such violence, by use of the violent crime attributable fractions discussed above.
5.3.11 Money laundering
A report prepared for the Australian Institute of Criminology (see Walker, forthcoming) estimates that around $2.8 billion of the proceeds of crime in Australia was laundered in 2004. Of this amount, Walker estimates, around $300 million was attributable to the market in illicit drugs.
However, money laundering has extremely complex economic effects (for example, on the allocation of productive resources, on the distribution of income in the community at large, and on tax revenues and public expenditures) which are beyond the scope of this paper to analyse.
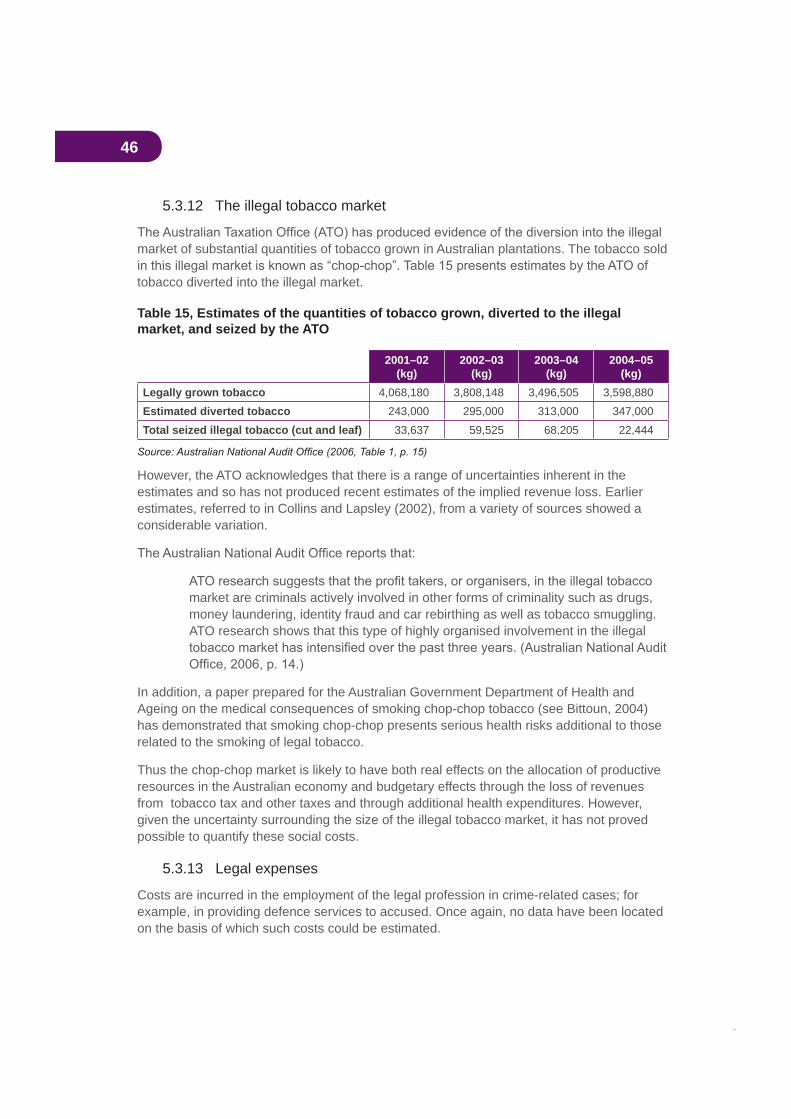
46
5.3.12 The illegal tobacco market
market of substantial quantities of tobacco grown in Australian plantations. The tobacco sold
tobacco diverted into the illegal market.
Table 15, Estimates of the quantities of tobacco grown, diverted to the illegal market, and seized by the ATO
2001–02(kg)
2002–03(kg)
2003–04(kg)
2004–05(kg)
Legally grown tobacco 4,068,180 3,808,148 3,496,505 3,598,880Estimated diverted tobacco 243,000 295,000 313,000 347,000Total seized illegal tobacco (cut and leaf) 33,637 59,525 68,205 22,444
However, the ATO acknowledges that there is a range of uncertainties inherent in the estimates and so has not produced recent estimates of the implied revenue loss. Earlier estimates, referred to in Collins and Lapsley (2002), from a variety of sources showed a considerable variation.
market are criminals actively involved in other forms of criminality such as drugs, money laundering, identity fraud and car rebirthing as well as tobacco smuggling. ATO research shows that this type of highly organised involvement in the illegal
In addition, a paper prepared for the Australian Government Department of Health and Ageing on the medical consequences of smoking chop-chop tobacco (see Bittoun, 2004) has demonstrated that smoking chop-chop presents serious health risks additional to those related to the smoking of legal tobacco.
Thus the chop-chop market is likely to have both real effects on the allocation of productive resources in the Australian economy and budgetary effects through the loss of revenues from tobacco tax and other taxes and through additional health expenditures. However, given the uncertainty surrounding the size of the illegal tobacco market, it has not proved possible to quantify these social costs.
5.3.13 Legal expenses
Costs are incurred in the employment of the legal profession in crime-related cases; for example, in providing defence services to accused. Once again, no data have been located on the basis of which such costs could be estimated.
47
5.3.14 Under-reporting of crime
crime. Apart from the conservative estimation techniques adopted in the research for this
reported to the police.
Carcach (1997) discussed results of the 1993 National Crime and Safety Survey (see Australian Bureau of Statistics, 4509.0), which estimated that the proportions of crime reported to police were 78 per cent for break and enter, 52 per cent for robbery and 32 per cent for assault. Bryant and Williams (2000) concluded that only about 30 per cent of alcohol- or other drug-related violence was reported to the police. Carcach and Grant (2000) reported data from the 1998 National Crime and Safety Survey (Australian Bureau of Statistics, 4509.0) which showed that respectively 74 per cent and 30 per cent of (most recent) incidents of household and personal offences were reported to police.
48
6. Some disaggregated costsThis section provides detailed estimates of the costs of drug-attributable crime, healthcare,
smoking. It also presents information on the breakdown of the costs of illicit drugs according
of abuse (alcohol, tobacco or illicit drugs). This form of presentation is adopted to provide comprehensive information on particular areas of costs while avoiding the problem of double counting of some costs. For example, road accident costs include, inter alia, productivity losses, for which separate aggregate drug abuse cost estimates are made. Productivity costs cannot be included in both areas without double counting, and yet to exclude them from road accident costs would give the impression that the total costs of drug-attributable road accidents were lower than in fact they are. This problem is overcome in the cases of
included) costs which are the values carried over to the aggregate tables. In this way all double counting is avoided.
6.1 CrimeTable 16 below presents estimates of drug-attributable crime costs. In interpreting these estimates it should be borne in mind that, as discussed earlier, they are also certainly substantial underestimates as a result of the considerable under-reporting of crimes to police.
As indicated earlier, some component of crime costs is causally attributable jointly to alcohol and illicit drugs. It is not possible to indicate what proportion of these joint costs is attributable to either alcohol individually or illicit drugs individually.
Alcohol-attributable crime cost $1.7 billion in 2004/05 while crime attributable to consumption of illicit drugs cost $4.0 billion. Crime attributable jointly to both types of drugs cost a further $1.4 billion.

49
Table 16, Summary of selected drug-attributable crime costs, 2004/05
Alcohol($m)
Illicit drugs($m)
Both($m)
Tangible costsPolice 747.1 1,716.9 320.2Criminal courts 85.8 146.8 28.0Prisons 141.8 348.6 146.6Property 67.1 445.4 144.6Insurance administration 14.3 94.6 30.7Violence 187.5 196.1 203.2Productivity of prisoners 368.0 892.1 387.7
Total tangible 1,611.5 3,840.5 1,261.0Intangible costs
Loss of life (violence) 124.4 130.1 134.8Total intangible costs 124.4 130.1 134.8Total costs 1,735.9 3,970.6 1,395.8Total n.e.i.
Tangible 1,424.0 3,644.5 1,057.8Intangible 0.0 0.0 0.0
Relevant costs as a proportion of GDP 0.20% 0.48% 0.16%
relevant attributable fractions.
Table 17 indicates how these cost estimates would change if the upper bound attributable
is explained in Appendix B.
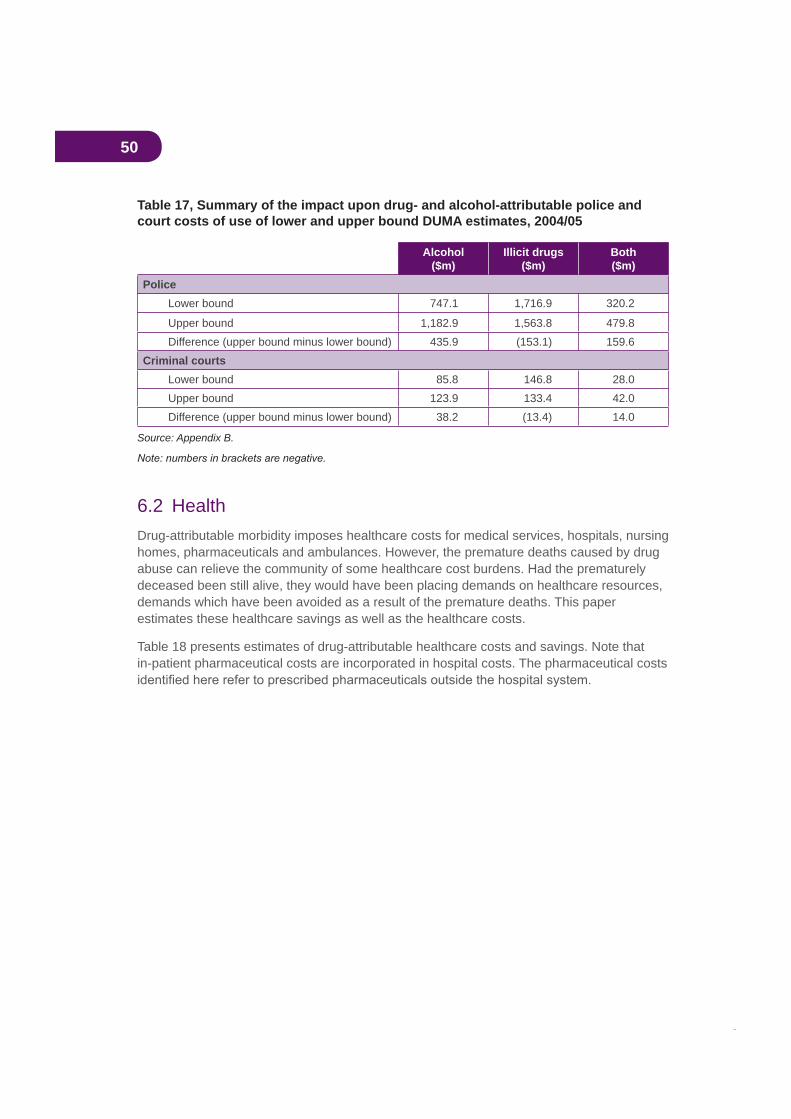
50
Table 17, Summary of the impact upon drug- and alcohol-attributable police and court costs of use of lower and upper bound DUMA estimates, 2004/05
Alcohol($m)
Illicit drugs($m)
Both($m)
PoliceLower bound 747.1 1,716.9 320.2
Upper bound 1,182.9 1,563.8 479.8Difference (upper bound minus lower bound) 435.9 (153.1) 159.6
Criminal courtsLower bound 85.8 146.8 28.0Upper bound 123.9 133.4 42.0Difference (upper bound minus lower bound) 38.2 (13.4) 14.0
Source: Appendix B.
6.2 HealthDrug-attributable morbidity imposes healthcare costs for medical services, hospitals, nursing homes, pharmaceuticals and ambulances. However, the premature deaths caused by drug abuse can relieve the community of some healthcare cost burdens. Had the prematurely deceased been still alive, they would have been placing demands on healthcare resources, demands which have been avoided as a result of the premature deaths. This paper estimates these healthcare savings as well as the healthcare costs.
Table 18 presents estimates of drug-attributable healthcare costs and savings. Note that in-patient pharmaceutical costs are incorporated in hospital costs. The pharmaceutical costs
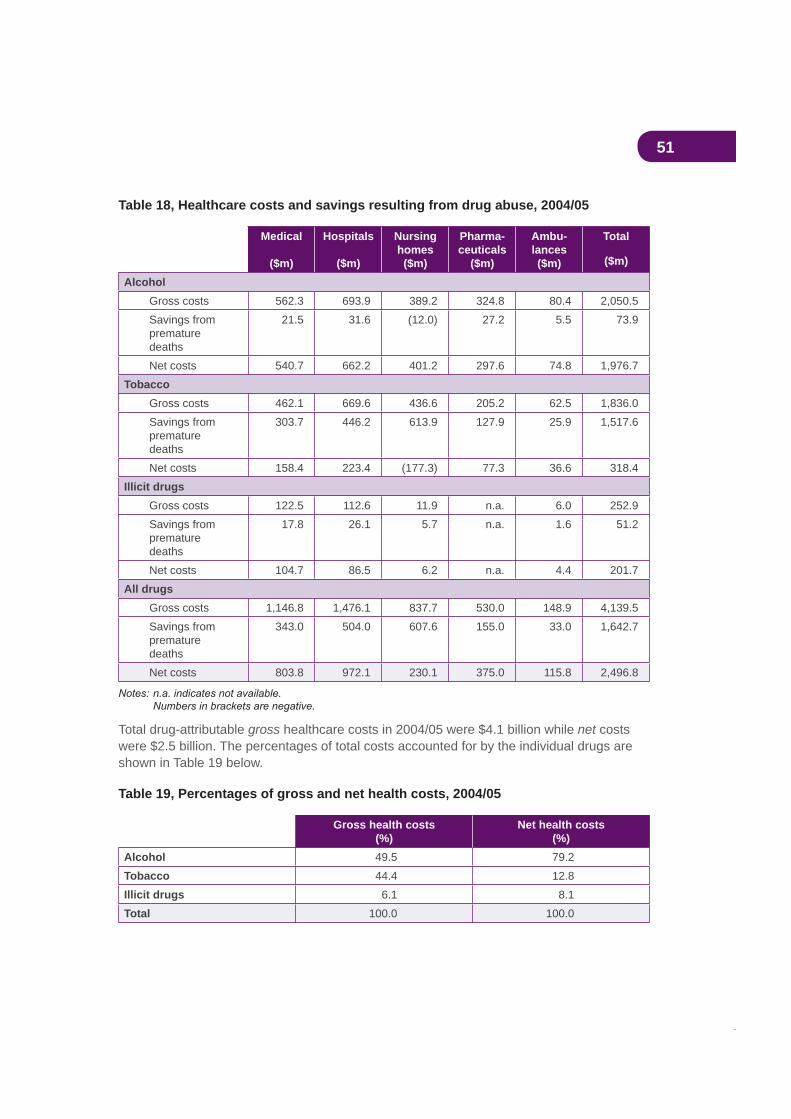
51
Table 18, Healthcare costs and savings resulting from drug abuse, 2004/05
Medical
($m)
Hospitals
($m)
Nursinghomes
($m)
Pharma-ceuticals
($m)
Ambu-lances($m)
Total
($m)
AlcoholGross costs 562.3 693.9 389.2 324.8 80.4 2,050.5Savings frompremature deaths
21.5 31.6 (12.0) 27.2 5.5 73.9
Net costs 540.7 662.2 401.2 297.6 74.8 1,976.7Tobacco
Gross costs 462.1 669.6 436.6 205.2 62.5 1,836.0Savings frompremature deaths
303.7 446.2 613.9 127.9 25.9 1,517.6
Net costs 158.4 223.4 (177.3) 77.3 36.6 318.4Illicit drugs
Gross costs 122.5 112.6 11.9 n.a. 6.0 252.9Savings from premature deaths
17.8 26.1 5.7 n.a. 1.6 51.2
Net costs 104.7 86.5 6.2 n.a. 4.4 201.7All drugs
Gross costs 1,146.8 1,476.1 837.7 530.0 148.9 4,139.5Savings from premature deaths
343.0 504.0 607.6 155.0 33.0 1,642.7
Net costs 803.8 972.1 230.1 375.0 115.8 2,496.8
Total drug-attributable gross healthcare costs in 2004/05 were $4.1 billion while net costswere $2.5 billion. The percentages of total costs accounted for by the individual drugs are shown in Table 19 below.
Table 19, Percentages of gross and net health costs, 2004/05
Gross health costs(%)
Net health costs(%)
Alcohol 49.5 79.2Tobacco 44.4 12.8Illicit drugs 6.1 8.1Total 100.0 100.0
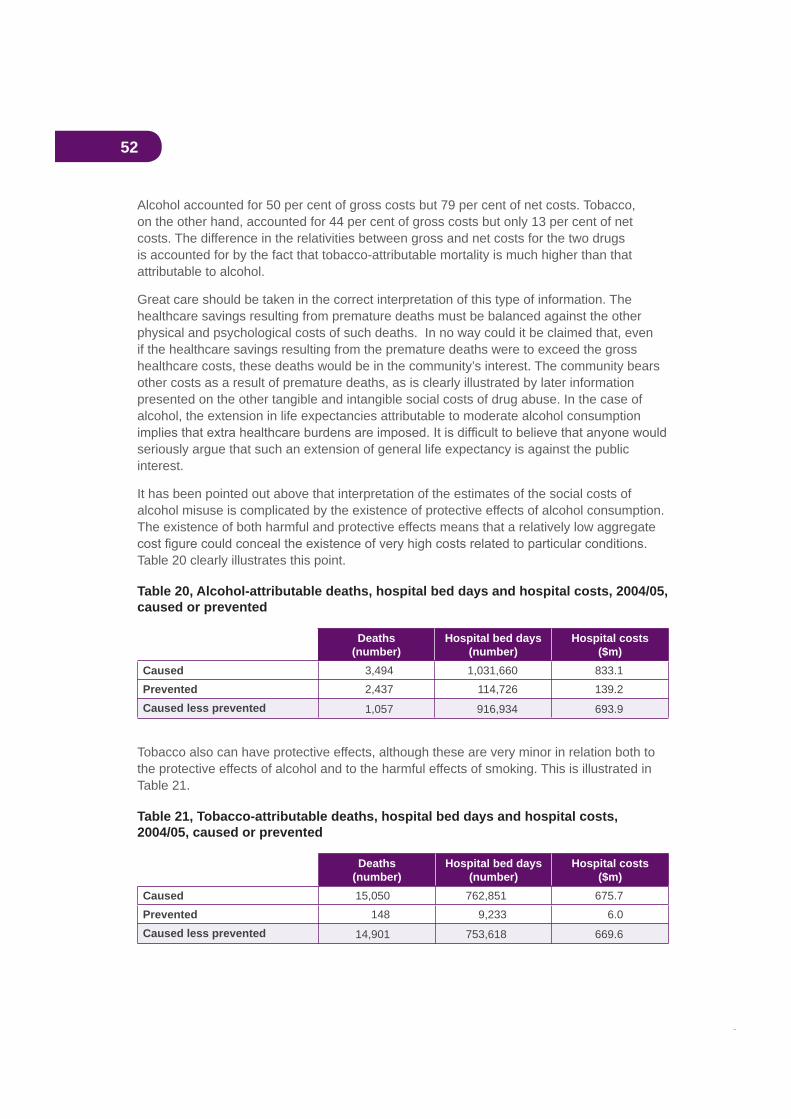
52
Alcohol accounted for 50 per cent of gross costs but 79 per cent of net costs. Tobacco, on the other hand, accounted for 44 per cent of gross costs but only 13 per cent of net costs. The difference in the relativities between gross and net costs for the two drugs is accounted for by the fact that tobacco-attributable mortality is much higher than that attributable to alcohol.
Great care should be taken in the correct interpretation of this type of information. The healthcare savings resulting from premature deaths must be balanced against the other physical and psychological costs of such deaths. In no way could it be claimed that, even if the healthcare savings resulting from the premature deaths were to exceed the gross healthcare costs, these deaths would be in the community’s interest. The community bears other costs as a result of premature deaths, as is clearly illustrated by later information presented on the other tangible and intangible social costs of drug abuse. In the case of alcohol, the extension in life expectancies attributable to moderate alcohol consumption
seriously argue that such an extension of general life expectancy is against the public interest.
It has been pointed out above that interpretation of the estimates of the social costs of alcohol misuse is complicated by the existence of protective effects of alcohol consumption. The existence of both harmful and protective effects means that a relatively low aggregate
Table 20 clearly illustrates this point.
Table 20, Alcohol-attributable deaths, hospital bed days and hospital costs, 2004/05, caused or prevented
Deaths(number)
Hospital bed days(number)
Hospital costs($m)
Caused 3,494 1,031,660 833.1Prevented 2,437 114,726 139.2Caused less prevented 1,057 916,934 693.9
Tobacco also can have protective effects, although these are very minor in relation both to the protective effects of alcohol and to the harmful effects of smoking. This is illustrated in Table 21.
Table 21, Tobacco-attributable deaths, hospital bed days and hospital costs, 2004/05, caused or prevented
Deaths(number)
Hospital bed days(number)
Hospital costs($m)
Caused 15,050 762,851 675.7Prevented 148 9,233 6.0Caused less prevented 14,901 753,618 669.6

53
Estimates of the impact of involuntary smoking on deaths, hospital bed days and hospital
proportionate terms in Table 23.
Table 22, Tobacco-attributable deaths, hospital bed days and hospital costs, 2004/05, by age and smoking status
Voluntary Involuntary Total
Deaths (number)0–14 0.0 36 3615+ 14,753 112 14,865
Total 14,753 149 14,901Hospital bed days (number)
0–14 0.0 61,178 61,17815+ 689,951 2,489 692,440
Total 689,951 63,667 753,618Hospital costs ($m)
0–14 0.0 30.6 30.615+ 636.0 3.1 639.1
Total 636.0 33.7 669.6
Table 23, Percentages of tobacco-attributable deaths, hospital bed days and hospital costs, 2004/05, by age and smoking status
Voluntary(%)
Involuntary(%)
Total(%)
Deaths0–14 0.0 24.5 0.215+ 100.0 75.5 99.8
Total 100.0 100.0 100.0Hospital bed days
0–14 0.0 96.1 8.115+ 100.0 3.9 91.9
Total 100.0 100.0 100.0Hospital costs
0–14 0.0 90.8 4.615+ 100.0 9.2 95.4
Total 100.0 100.0 100.0
54
The above two tables clearly illustrate how the costs of involuntary smoking are largely imposed on the young. In relation to involuntary smoking, the under 15s accounted in 2004/05 for 25 per cent of attributable deaths, 96 per cent of attributable hospital bed days and 91 per cent of attributable hospital costs.
6.3 Illicit drugs disaggregatedThe illicit drug-attributable mortality and morbidity costs presented above relate to illicit
(see Table 6) and we consider that these costs should, wherever possible, be disaggregated down to the level of individual drugs. The ability to disaggregate is, however, severely limited by the scope of the available epidemiological data. It is possible to identify some of the effects of individual drugs on mortality, potential years of life lost (PYLL), hospital usage and gross hospital costs (not taking into account any savings which have resulted from
drugs the costs of ambulances, nursing homes, pharmaceuticals, crime, road accidents and productivity losses. The next three tables present a summary of the epidemiological information for males, females and persons.
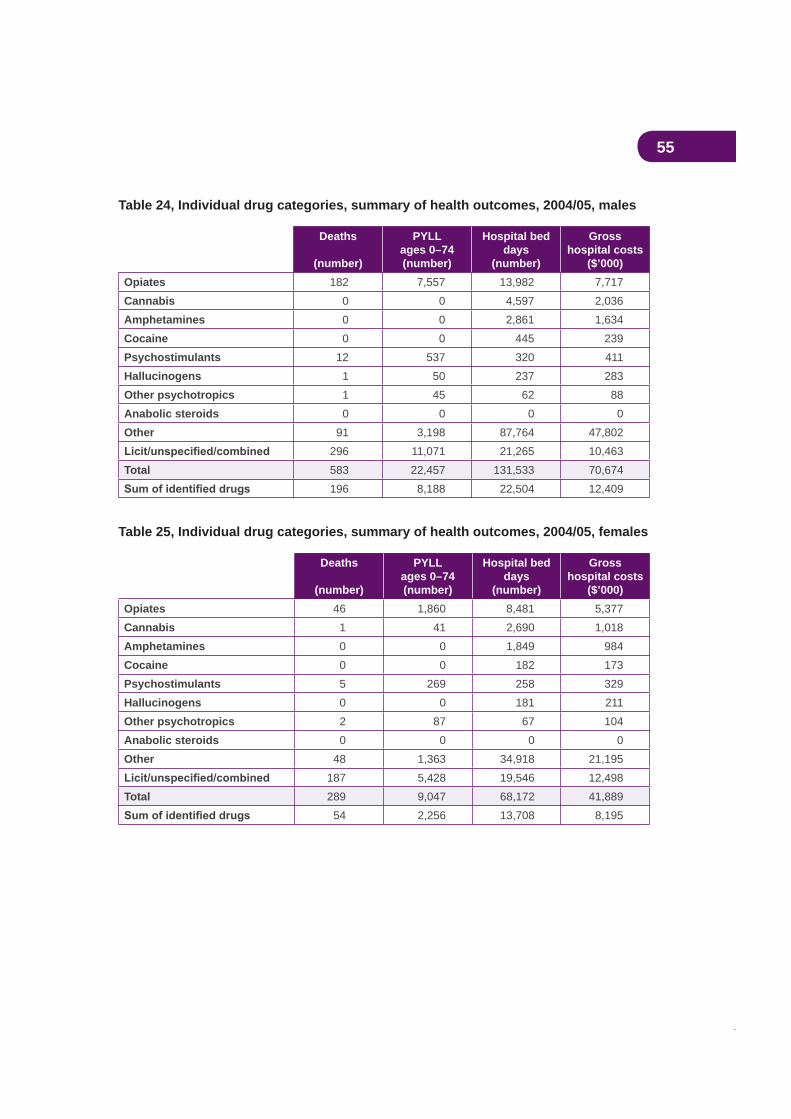
55
Table 24, Individual drug categories, summary of health outcomes, 2004/05, males
Deaths
(number)
PYLL ages 0–74(number)
Hospital bed days
(number)
Grosshospital costs
($’000)Opiates 182 7,557 13,982 7,717Cannabis 0 0 4,597 2,036Amphetamines 0 0 2,861 1,634Cocaine 0 0 445 239Psychostimulants 12 537 320 411Hallucinogens 1 50 237 283Other psychotropics 1 45 62 88Anabolic steroids 0 0 0 0Other 91 3,198 87,764 47,802
296 11,071 21,265 10,463Total 583 22,457 131,533 70,674
196 8,188 22,504 12,409
Table 25, Individual drug categories, summary of health outcomes, 2004/05, females
Deaths
(number)
PYLLages 0–74(number)
Hospital bed days
(number)
Grosshospital costs
($’000)Opiates 46 1,860 8,481 5,377Cannabis 1 41 2,690 1,018Amphetamines 0 0 1,849 984Cocaine 0 0 182 173Psychostimulants 5 269 258 329Hallucinogens 0 0 181 211Other psychotropics 2 87 67 104Anabolic steroids 0 0 0 0Other 48 1,363 34,918 21,195
187 5,428 19,546 12,498Total 289 9,047 68,172 41,889
54 2,256 13,708 8,195

56
Table 26, Individual drug categories, summary of health outcomes, 2004/05, persons
Deaths
(number)
PYLLages 0–74(number)
Hospital bed days
(number)
Gross hospital costs
($’000)Opiates 228 9,417 22,463 13,094Cannabis 1 41 7,287 3,054Amphetamines 0 0 4,710 2,618Cocaine 0 0 627 412Psychostimulants 17 806 578 740Hallucinogens 1 50 418 494Other psychotropics 3 132 129 192Anabolic steroids 0 0 0 0Other 139 4,561 122,683 68,998
483 16,498 40,811 22,961Total 872 31,504 199,706 112,563
250 10,445 36,212 20,604
mortality and morbidity results from conditions which the epidemiological data do not assign
Table 27, Individual drug categories, summary of health outcomes, 2004/05, males,
Deaths
(%)
PYLLages 0–74
(%)
Hospital bed days(%)
Grosshospital costs
(%)Opiates 92.9 92.3 62.1 62.2Cannabis 0.0 0.0 20.4 16.4Amphetamines 0.0 0.0 12.7 13.2Cocaine 0.0 0.0 2.0 1.9Psychostimulants 6.1 6.6 1.4 3.3Hallucinogens 0.5 0.6 1.1 2.3Other psychotropics 0.5 0.5 0.3 0.7Anabolic steroids 0.0 0.0 0.0 0.0
100.0 100.0 100.0 100.033.6 36.5 17.1 17.6
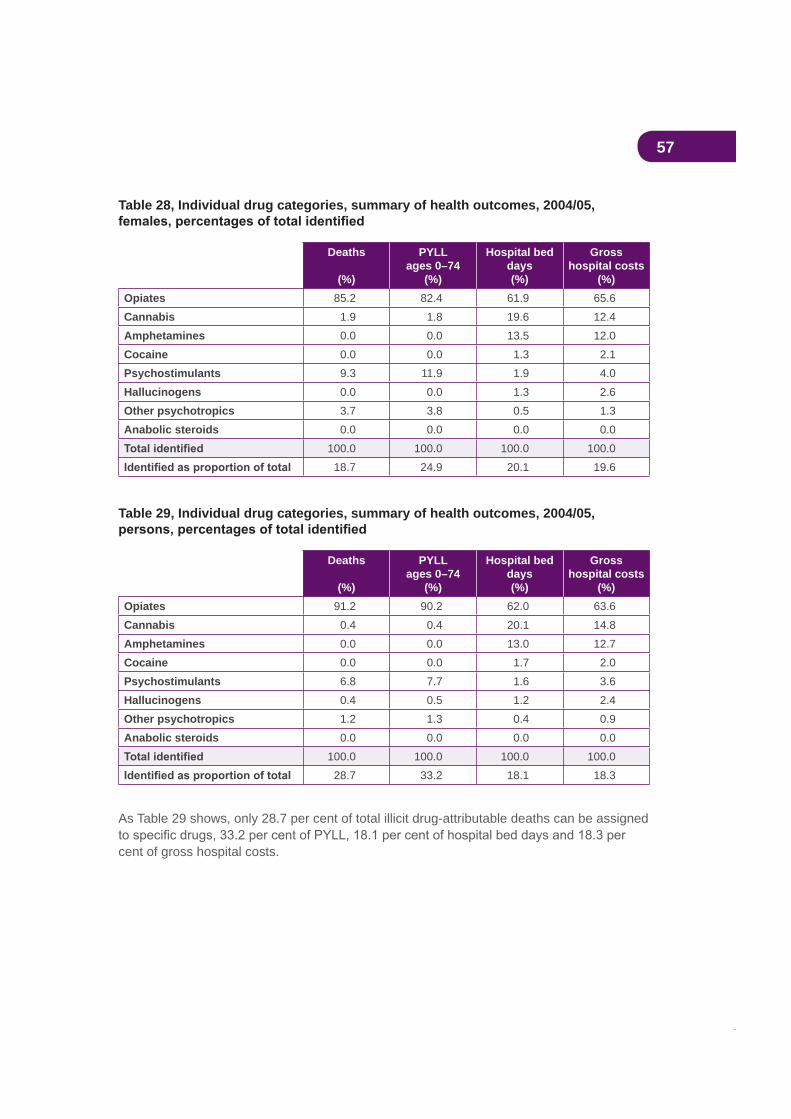
57
Table 28, Individual drug categories, summary of health outcomes, 2004/05,
Deaths
(%)
PYLL ages 0–74
(%)
Hospital bed days(%)
Grosshospital costs
(%)Opiates 85.2 82.4 61.9 65.6Cannabis 1.9 1.8 19.6 12.4Amphetamines 0.0 0.0 13.5 12.0Cocaine 0.0 0.0 1.3 2.1Psychostimulants 9.3 11.9 1.9 4.0Hallucinogens 0.0 0.0 1.3 2.6Other psychotropics 3.7 3.8 0.5 1.3Anabolic steroids 0.0 0.0 0.0 0.0
100.0 100.0 100.0 100.018.7 24.9 20.1 19.6
Table 29, Individual drug categories, summary of health outcomes, 2004/05,
Deaths
(%)
PYLL ages 0–74
(%)
Hospital bed days(%)
Grosshospital costs
(%)Opiates 91.2 90.2 62.0 63.6Cannabis 0.4 0.4 20.1 14.8Amphetamines 0.0 0.0 13.0 12.7Cocaine 0.0 0.0 1.7 2.0Psychostimulants 6.8 7.7 1.6 3.6Hallucinogens 0.4 0.5 1.2 2.4Other psychotropics 1.2 1.3 0.4 0.9Anabolic steroids 0.0 0.0 0.0 0.0
100.0 100.0 100.0 100.028.7 33.2 18.1 18.3
As Table 29 shows, only 28.7 per cent of total illicit drug-attributable deaths can be assigned
cent of gross hospital costs.
58
6.4 ProductivityDrug abuse causes a loss of national productive capacity in the paid workforce as a result of drug-attributable death and sickness. Losses are also experienced in the unpaid workforce—that is, in the household sector—from the same causes. Against these losses should be set the savings in national resources which would have been consumed had the drug-attributable deaths not occurred. Net production losses represent the gross reduction in productive capacity less these consumption savings.
Table 30 presents estimates of the reductions in productive capacity which resulted from drug abuse in 2004/05.
Of the total net production costs of $13.2 billion, tobacco accounted for by far the largest share (60.7 per cent or $8.0 billion). Alcohol represented 26.8 per cent ($3.5 billion) and illicit drugs 12.5 per cent ($1.6 billion). Of the gross production costs of $22.9 billion, workforce losses represented 47.9 per cent ($11.0 billion) and household losses 52.1 per cent ($11.9 billion).
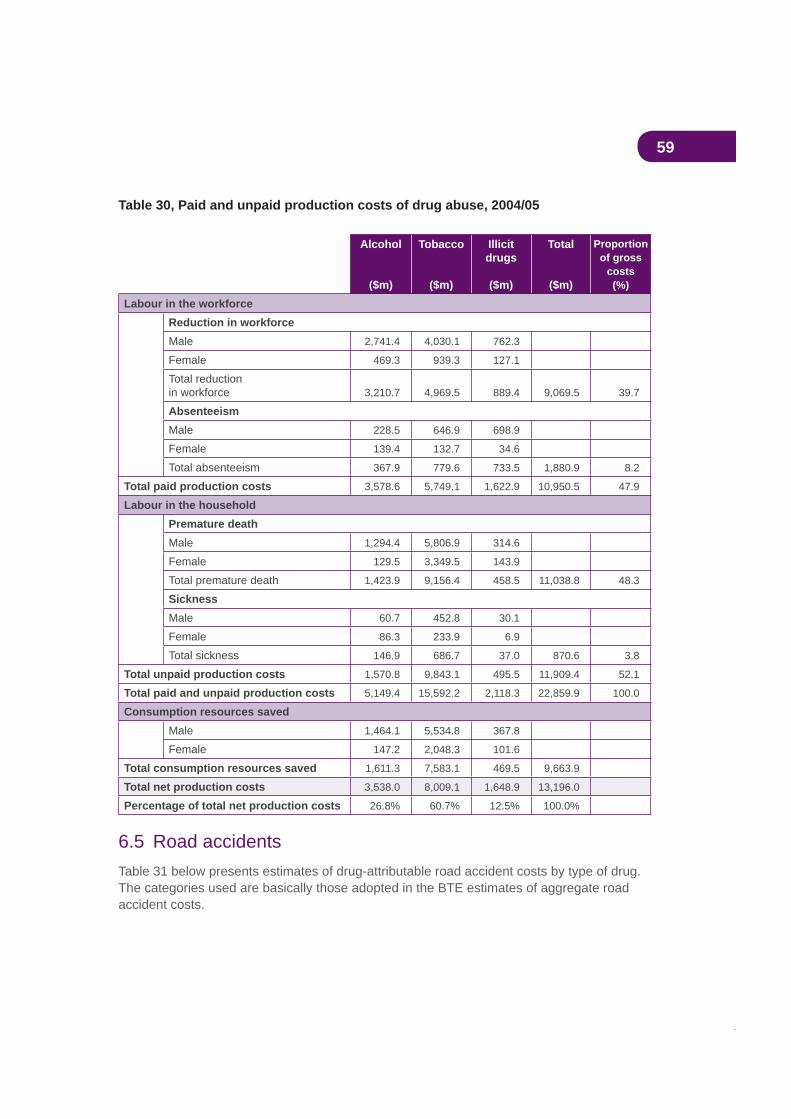
59
Table 30, Paid and unpaid production costs of drug abuse, 2004/05
Alcohol
($m)
Tobacco
($m)
Illicitdrugs
($m)
Total
($m)
Proportionof gross
costs(%)
Labour in the workforceReduction in workforceMale 2,741.4 4,030.1 762.3
Female 469.3 939.3 127.1
Total reductionin workforce 3,210.7 4,969.5 889.4 9,069.5 39.7
AbsenteeismMale 228.5 646.9 698.9
Female 139.4 132.7 34.6
Total absenteeism 367.9 779.6 733.5 1,880.9 8.2
Total paid production costs 3,578.6 5,749.1 1,622.9 10,950.5 47.9
Labour in the householdPremature deathMale 1,294.4 5,806.9 314.6
Female 129.5 3,349.5 143.9
Total premature death 1,423.9 9,156.4 458.5 11,038.8 48.3
SicknessMale 60.7 452.8 30.1
Female 86.3 233.9 6.9
Total sickness 146.9 686.7 37.0 870.6 3.8
Total unpaid production costs 1,570.8 9,843.1 495.5 11,909.4 52.1
Total paid and unpaid production costs 5,149.4 15,592.2 2,118.3 22,859.9 100.0
Consumption resources savedMale 1,464.1 5,534.8 367.8
Female 147.2 2,048.3 101.6
Total consumption resources saved 1,611.3 7,583.1 469.5 9,663.9
Total net production costs 3,538.0 8,009.1 1,648.9 13,196.0
Percentage of total net production costs 26.8% 60.7% 12.5% 100.0%
6.5 Road accidents Table 31 below presents estimates of drug-attributable road accident costs by type of drug. The categories used are basically those adopted in the BTE estimates of aggregate road accident costs.
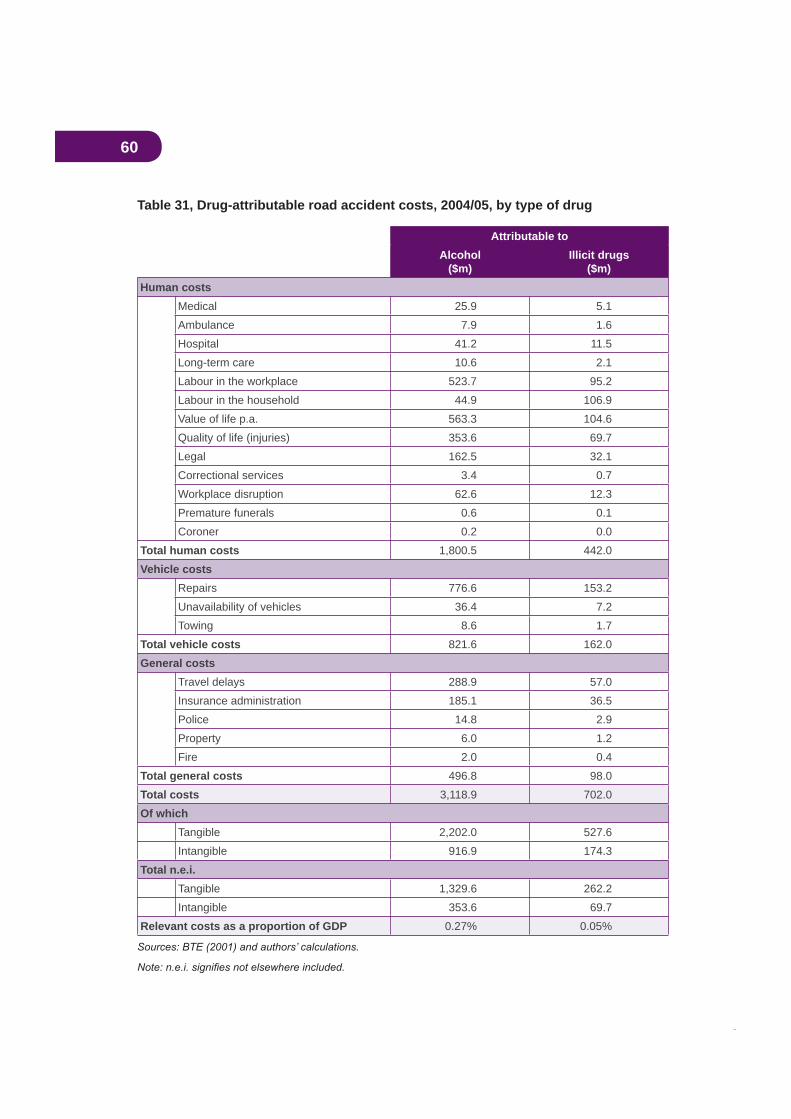
60
Table 31, Drug-attributable road accident costs, 2004/05, by type of drug
Attributable toAlcohol
($m)Illicit drugs
($m)Human costs
Medical 25.9 5.1Ambulance 7.9 1.6Hospital 41.2 11.5Long-term care 10.6 2.1Labour in the workplace 523.7 95.2Labour in the household 44.9 106.9Value of life p.a. 563.3 104.6Quality of life (injuries) 353.6 69.7Legal 162.5 32.1Correctional services 3.4 0.7Workplace disruption 62.6 12.3Premature funerals 0.6 0.1Coroner 0.2 0.0
Total human costs 1,800.5 442.0Vehicle costs
Repairs 776.6 153.2Unavailability of vehicles 36.4 7.2Towing 8.6 1.7
Total vehicle costs 821.6 162.0General costs
Travel delays 288.9 57.0Insurance administration 185.1 36.5Police 14.8 2.9Property 6.0 1.2Fire 2.0 0.4
Total general costs 496.8 98.0Total costs 3,118.9 702.0Of which
Tangible 2,202.0 527.6Intangible 916.9 174.3
Total n.e.i.Tangible 1,329.6 262.2Intangible 353.6 69.7
Relevant costs as a proportion of GDP 0.27% 0.05%
61
It should be noted that, in the overall output tables presented later, some of the road accident cost components above are included in other broader cost categories (for example,
over to the aggregate tables.
Alcohol-attributable road accidents cost an estimated $3.1 billion in 2004/05, of which 71 per cent were tangible costs. Illicit drug-attributable road accidents cost $702 million of which 75 per cent were tangible costs.
As indicated earlier, any comparison of costs and GDP can include only those categories of cost which are included in the GDP calculation. The bottom line of Table 31 makes this comparison for road accidents, thus excluding the costs of labour in the household and all intangible costs. On this basis, alcohol-attributable accident costs represented 0.27 per cent of GDP and illicit drug-attributable accidents 0.05 per cent.
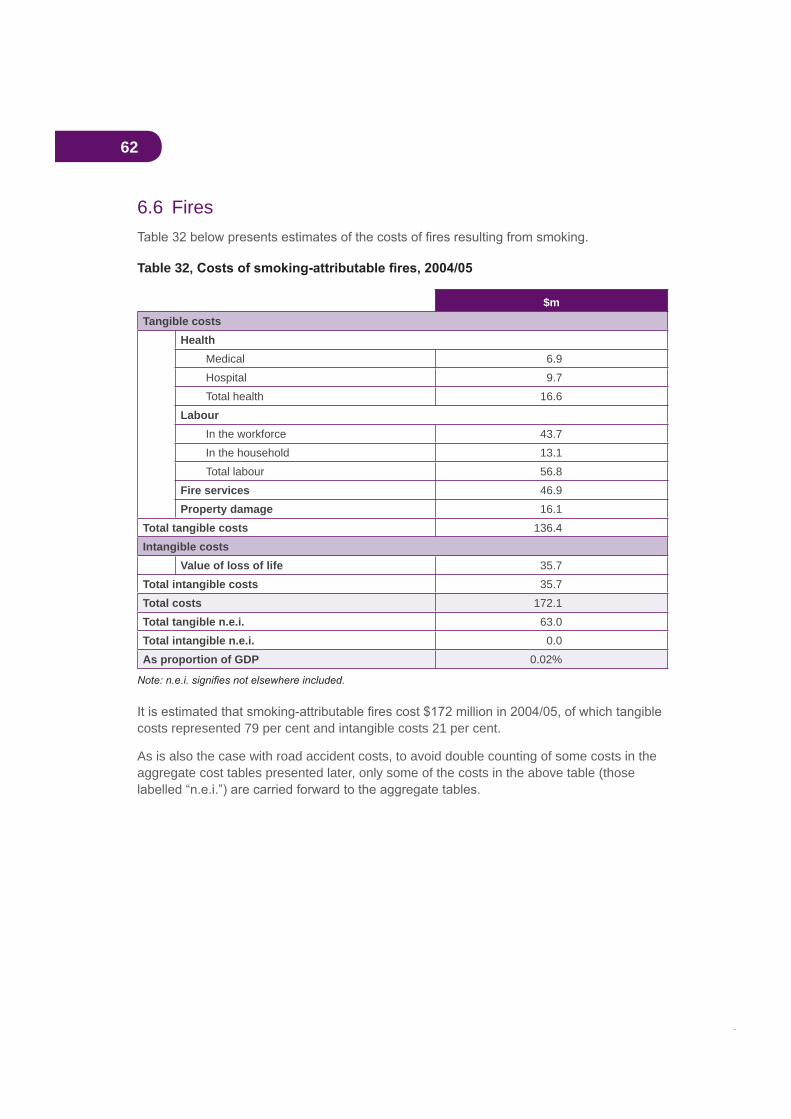
62
6.6 Fires
Table 32
$mTangible costs
HealthMedical 6.9Hospital 9.7Total health 16.6
LabourIn the workforce 43.7In the household 13.1Total labour 56.8
Fire services 46.9Property damage 16.1
Total tangible costs 136.4Intangible costs
Value of loss of life 35.7Total intangible costs 35.7Total costs 172.1Total tangible n.e.i. 63.0Total intangible n.e.i. 0.0As proportion of GDP 0.02%
costs represented 79 per cent and intangible costs 21 per cent.
As is also the case with road accident costs, to avoid double counting of some costs in the aggregate cost tables presented later, only some of the costs in the above table (those
63
7. Aggregate results7.1 Total costsThis section of the paper presents a summary of the overall social costs of drug abuse,
Table 33 presents a summary of tangible costs, Table 34 presents intangible costs and Table 35 presents total costs. Note that commentary on the costs attributable to individual drugs is complicated by the joint nature of some crime costs and by the adjustment to be made to the all drugs total for the interactive effects involved in the estimation of aetiological fractions for conditions attributable to more than one drug.
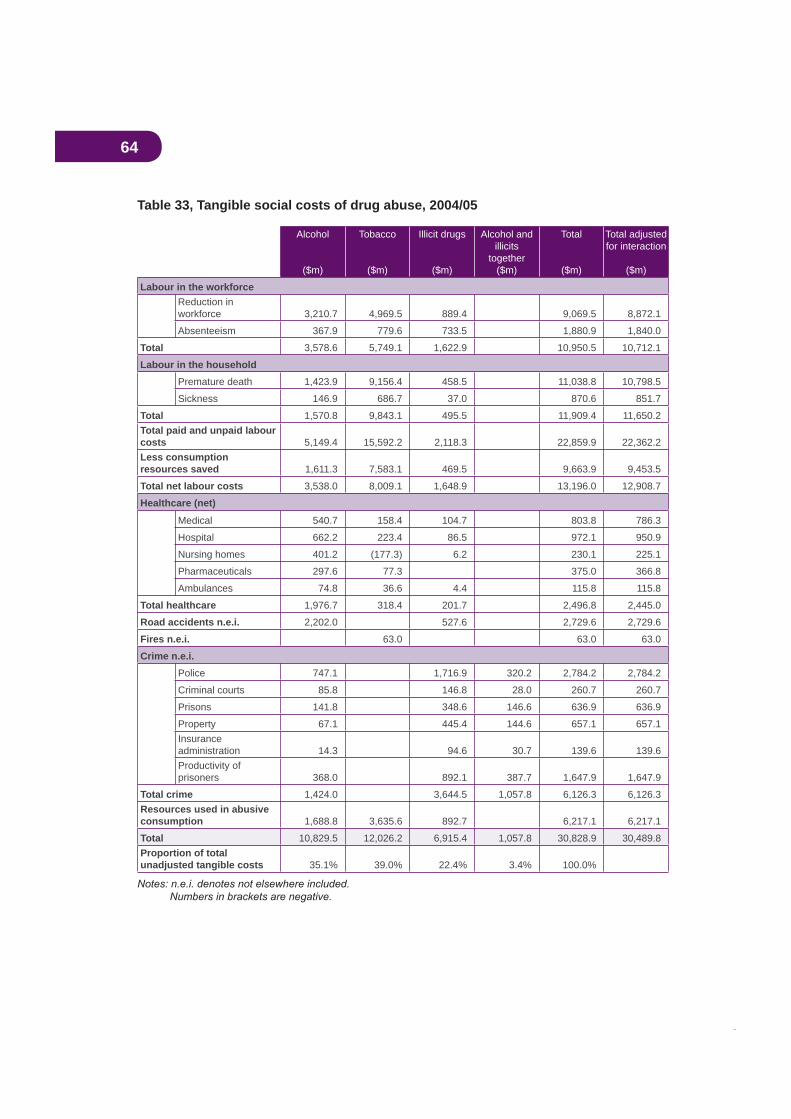
64
Table 33, Tangible social costs of drug abuse, 2004/05
Alcohol
($m)
Tobacco
($m)
Illicit drugs
($m)
Alcohol and illicits
together($m)
Total
($m)
Total adjusted for interaction
($m)
Labour in the workforceReduction in workforce 3,210.7 4,969.5 889.4 9,069.5 8,872.1
Absenteeism 367.9 779.6 733.5 1,880.9 1,840.0
Total 3,578.6 5,749.1 1,622.9 10,950.5 10,712.1
Labour in the householdPremature death 1,423.9 9,156.4 458.5 11,038.8 10,798.5
Sickness 146.9 686.7 37.0 870.6 851.7
Total 1,570.8 9,843.1 495.5 11,909.4 11,650.2Total paid and unpaid labour costs 5,149.4 15,592.2 2,118.3 22,859.9 22,362.2Less consumption resources saved 1,611.3 7,583.1 469.5 9,663.9 9,453.5
Total net labour costs 3,538.0 8,009.1 1,648.9 13,196.0 12,908.7
Healthcare (net)
Medical 540.7 158.4 104.7 803.8 786.3
Hospital 662.2 223.4 86.5 972.1 950.9
Nursing homes 401.2 (177.3) 6.2 230.1 225.1
Pharmaceuticals 297.6 77.3 375.0 366.8
Ambulances 74.8 36.6 4.4 115.8 115.8
Total healthcare 1,976.7 318.4 201.7 2,496.8 2,445.0
Road accidents n.e.i. 2,202.0 527.6 2,729.6 2,729.6
Fires n.e.i. 63.0 63.0 63.0
Crime n.e.i.Police 747.1 1,716.9 320.2 2,784.2 2,784.2
Criminal courts 85.8 146.8 28.0 260.7 260.7
Prisons 141.8 348.6 146.6 636.9 636.9
Property 67.1 445.4 144.6 657.1 657.1Insuranceadministration 14.3 94.6 30.7 139.6 139.6Productivity of prisoners 368.0 892.1 387.7 1,647.9 1,647.9
Total crime 1,424.0 3,644.5 1,057.8 6,126.3 6,126.3Resources used in abusive consumption 1,688.8 3,635.6 892.7 6,217.1 6,217.1
Total 10,829.5 12,026.2 6,915.4 1,057.8 30,828.9 30,489.8Proportion of total unadjusted tangible costs 35.1% 39.0% 22.4% 3.4% 100.0%
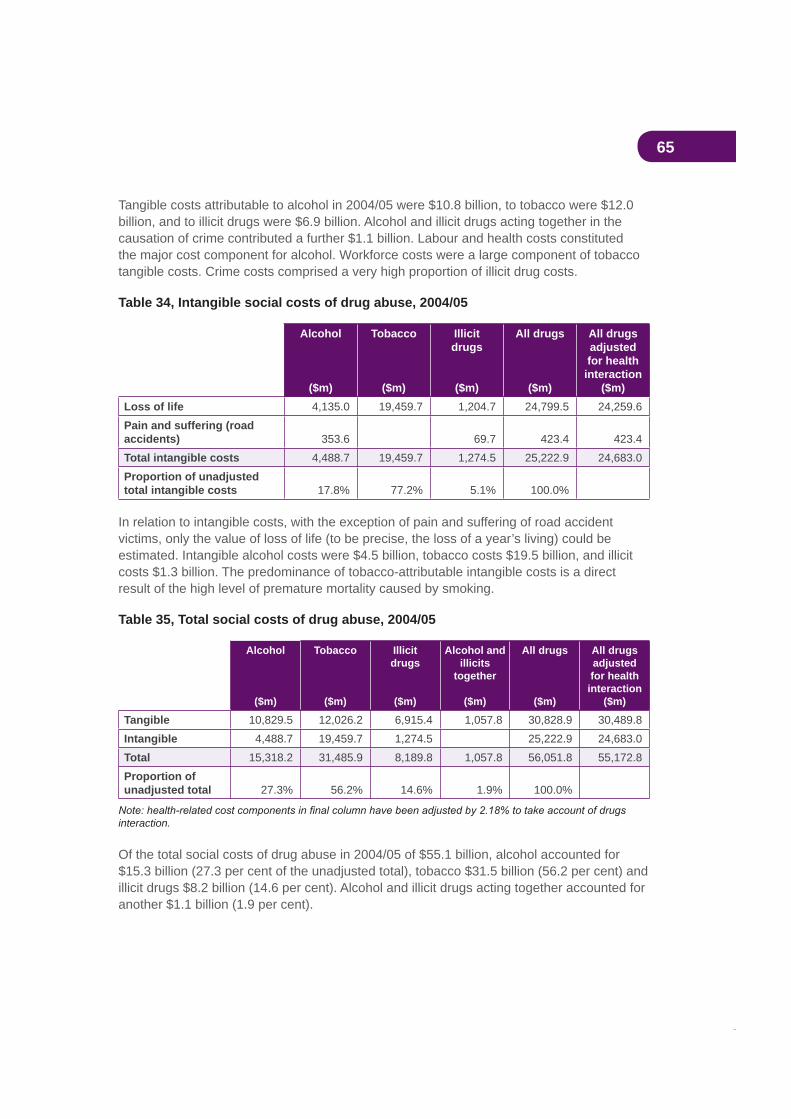
65
Tangible costs attributable to alcohol in 2004/05 were $10.8 billion, to tobacco were $12.0 billion, and to illicit drugs were $6.9 billion. Alcohol and illicit drugs acting together in the causation of crime contributed a further $1.1 billion. Labour and health costs constituted the major cost component for alcohol. Workforce costs were a large component of tobacco tangible costs. Crime costs comprised a very high proportion of illicit drug costs.
Table 34, Intangible social costs of drug abuse, 2004/05
Alcohol
($m)
Tobacco
($m)
Illicitdrugs
($m)
All drugs
($m)
All drugs adjustedfor health
interaction($m)
Loss of life 4,135.0 19,459.7 1,204.7 24,799.5 24,259.6Pain and suffering (road accidents) 353.6 69.7 423.4 423.4Total intangible costs 4,488.7 19,459.7 1,274.5 25,222.9 24,683.0Proportion of unadjusted total intangible costs 17.8% 77.2% 5.1% 100.0%
In relation to intangible costs, with the exception of pain and suffering of road accident victims, only the value of loss of life (to be precise, the loss of a year’s living) could be estimated. Intangible alcohol costs were $4.5 billion, tobacco costs $19.5 billion, and illicit costs $1.3 billion. The predominance of tobacco-attributable intangible costs is a direct result of the high level of premature mortality caused by smoking.
Table 35, Total social costs of drug abuse, 2004/05
Alcohol
($m)
Tobacco
($m)
Illicitdrugs
($m)
Alcohol and illicits
together
($m)
All drugs
($m)
All drugs adjustedfor health interaction
($m)
Tangible 10,829.5 12,026.2 6,915.4 1,057.8 30,828.9 30,489.8Intangible 4,488.7 19,459.7 1,274.5 25,222.9 24,683.0Total 15,318.2 31,485.9 8,189.8 1,057.8 56,051.8 55,172.8Proportion of unadjusted total 27.3% 56.2% 14.6% 1.9% 100.0%
interaction.
Of the total social costs of drug abuse in 2004/05 of $55.1 billion, alcohol accounted for $15.3 billion (27.3 per cent of the unadjusted total), tobacco $31.5 billion (56.2 per cent) and illicit drugs $8.2 billion (14.6 per cent). Alcohol and illicit drugs acting together accounted for another $1.1 billion (1.9 per cent).
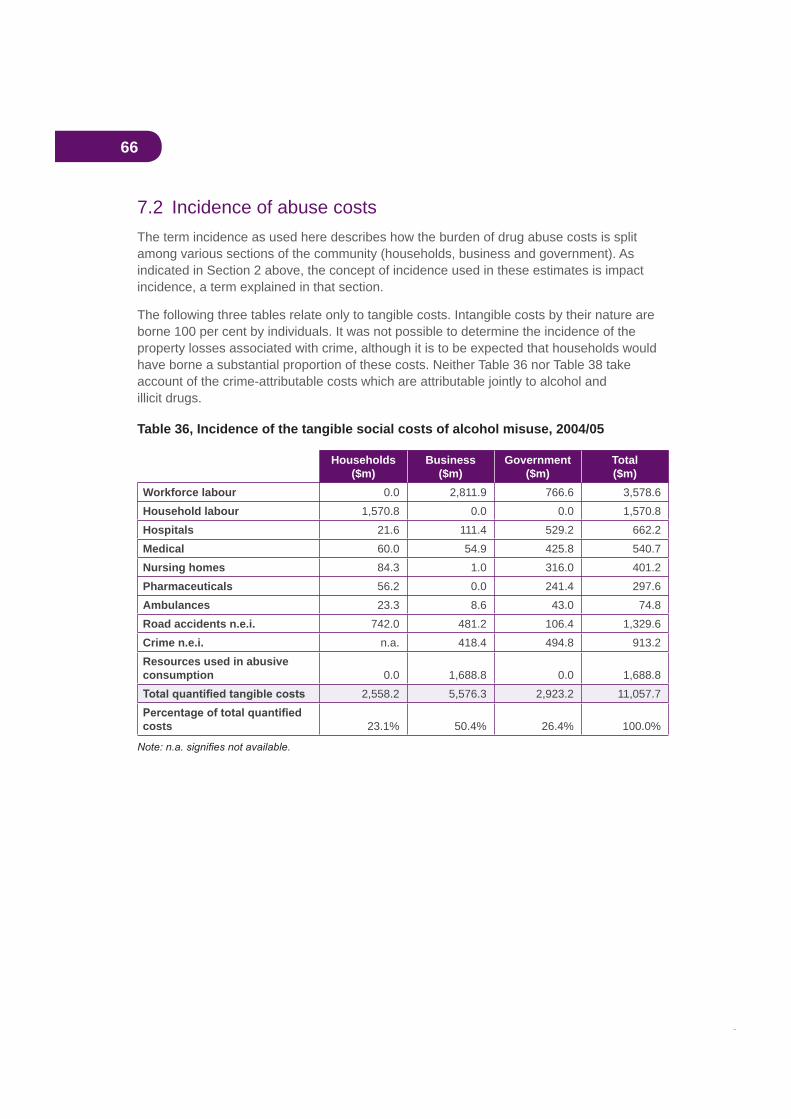
66
7.2 Incidence of abuse costsThe term incidence as used here describes how the burden of drug abuse costs is split among various sections of the community (households, business and government). As indicated in Section 2 above, the concept of incidence used in these estimates is impact incidence, a term explained in that section.
The following three tables relate only to tangible costs. Intangible costs by their nature are borne 100 per cent by individuals. It was not possible to determine the incidence of the property losses associated with crime, although it is to be expected that households would have borne a substantial proportion of these costs. Neither Table 36 nor Table 38 take account of the crime-attributable costs which are attributable jointly to alcohol and illicit drugs.
Table 36, Incidence of the tangible social costs of alcohol misuse, 2004/05
Households($m)
Business($m)
Government($m)
Total($m)
Workforce labour 0.0 2,811.9 766.6 3,578.6Household labour 1,570.8 0.0 0.0 1,570.8Hospitals 21.6 111.4 529.2 662.2Medical 60.0 54.9 425.8 540.7Nursing homes 84.3 1.0 316.0 401.2Pharmaceuticals 56.2 0.0 241.4 297.6Ambulances 23.3 8.6 43.0 74.8Road accidents n.e.i. 742.0 481.2 106.4 1,329.6Crime n.e.i. n.a. 418.4 494.8 913.2Resources used in abusive consumption 0.0 1,688.8 0.0 1,688.8
2,558.2 5,576.3 2,923.2 11,057.7
costs 23.1% 50.4% 26.4% 100.0%
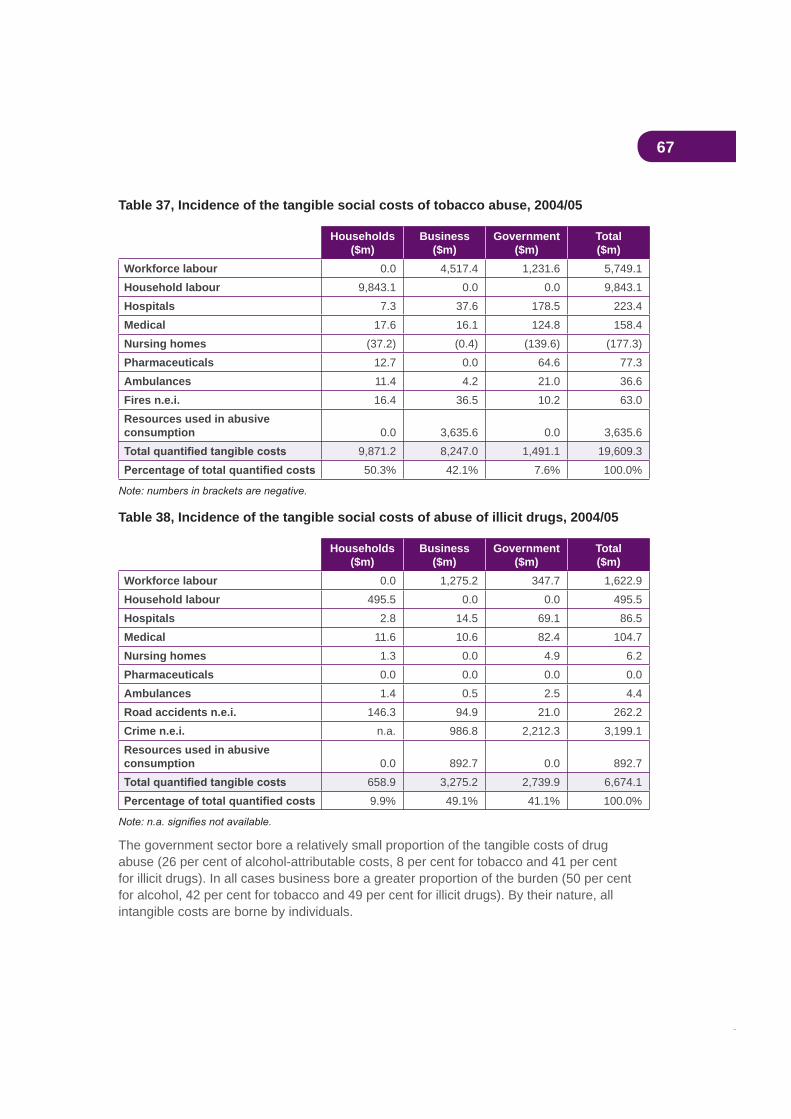
67
Table 37, Incidence of the tangible social costs of tobacco abuse, 2004/05
Households($m)
Business($m)
Government($m)
Total($m)
Workforce labour 0.0 4,517.4 1,231.6 5,749.1Household labour 9,843.1 0.0 0.0 9,843.1Hospitals 7.3 37.6 178.5 223.4Medical 17.6 16.1 124.8 158.4Nursing homes (37.2) (0.4) (139.6) (177.3)Pharmaceuticals 12.7 0.0 64.6 77.3Ambulances 11.4 4.2 21.0 36.6Fires n.e.i. 16.4 36.5 10.2 63.0Resources used in abusive consumption 0.0 3,635.6 0.0 3,635.6
9,871.2 8,247.0 1,491.1 19,609.350.3% 42.1% 7.6% 100.0%
Table 38, Incidence of the tangible social costs of abuse of illicit drugs, 2004/05
Households($m)
Business($m)
Government($m)
Total($m)
Workforce labour 0.0 1,275.2 347.7 1,622.9Household labour 495.5 0.0 0.0 495.5Hospitals 2.8 14.5 69.1 86.5Medical 11.6 10.6 82.4 104.7Nursing homes 1.3 0.0 4.9 6.2Pharmaceuticals 0.0 0.0 0.0 0.0Ambulances 1.4 0.5 2.5 4.4Road accidents n.e.i. 146.3 94.9 21.0 262.2Crime n.e.i. n.a. 986.8 2,212.3 3,199.1Resources used in abusive consumption 0.0 892.7 0.0 892.7
658.9 3,275.2 2,739.9 6,674.19.9% 49.1% 41.1% 100.0%
The government sector bore a relatively small proportion of the tangible costs of drug abuse (26 per cent of alcohol-attributable costs, 8 per cent for tobacco and 41 per cent for illicit drugs). In all cases business bore a greater proportion of the burden (50 per cent for alcohol, 42 per cent for tobacco and 49 per cent for illicit drugs). By their nature, all intangible costs are borne by individuals.

68
7.3 Budgetary implicationsThe following three tables present estimates of the budgetary implications of drug abuse—that is, of its impact upon public expenditures and revenues at both federal and state levels. It should be noted that the estimates here relate to the budgetary impact of drug abuse, not drug consumption. Furthermore, they incorporate estimates of the revenue losses resulting from drug-induced morbidity and premature mortality. Results are presented for the overall budgetary impact of drug abuse, as well as estimates for federal and state governments separately for each type of drug.
7.3.1 Alcohol
Table 39, Impact of alcohol misuse on the federal government budget, 2004/05
Outlays $mHealth
Hospitals 277.5
Medical 425.8
Nursing homes 300.5
Pharmaceuticals 241.4
Ambulances 8.7
Total health 1,253.9
Road accidents n.e.i. 18.6
Total outlays 1,272.6
Net revenue minus outlays 1,802.9
Receipts $mExcise tax
Beer 1,653.0
Spirits 739.0
Total excise tax 2,392.0
Customs dutiesBeer 83.0
Wine 5.0
Spirits 980.0
Total customs duties 1,068.0
Wine equalisation tax 676.0
Total alcohol revenue 4,136.0
LessRevenue forgone
Income tax 667.7
Indirect taxes 392.9
Total revenue forgone 1,060.6
Total net revenue 3,075.4
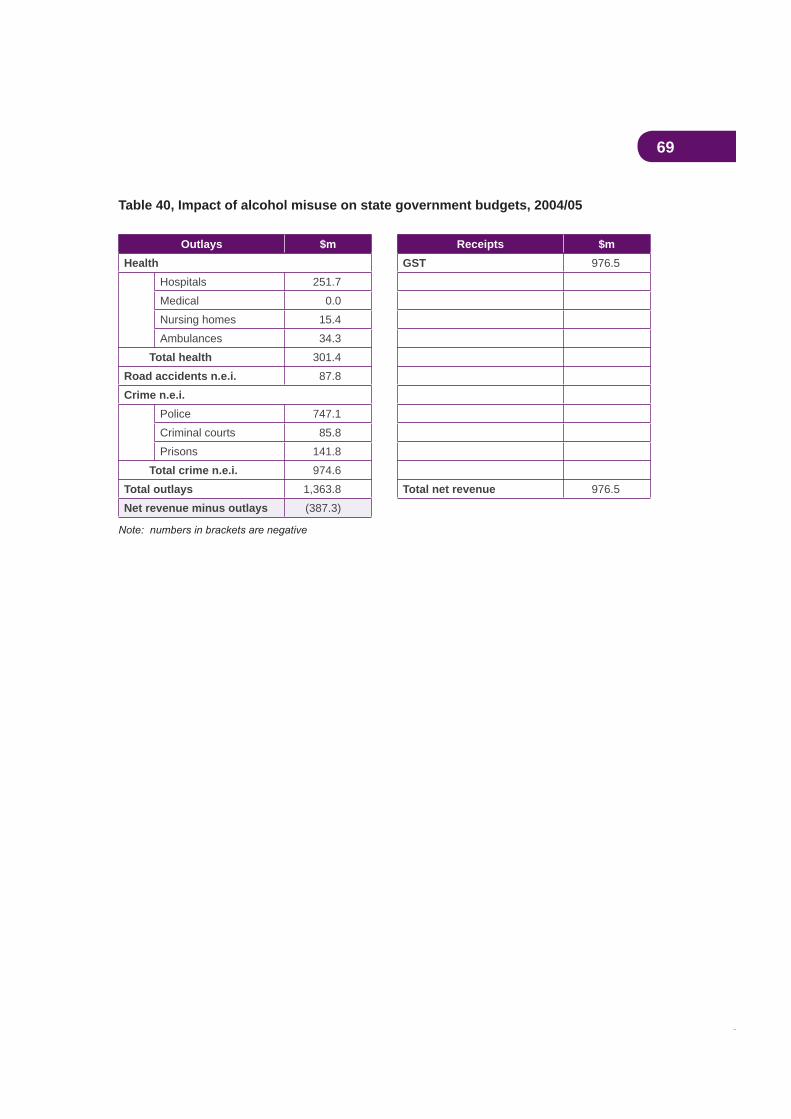
69
Table 40, Impact of alcohol misuse on state government budgets, 2004/05
Outlays $m Receipts $mHealth GST 976.5
Hospitals 251.7
Medical 0.0
Nursing homes 15.4
Ambulances 34.3
Total health 301.4
Road accidents n.e.i. 87.8
Crime n.e.i.Police 747.1
Criminal courts 85.8
Prisons 141.8
Total crime n.e.i. 974.6
Total outlays 1,363.8 Total net revenue 976.5
Net revenue minus outlays (387.3)
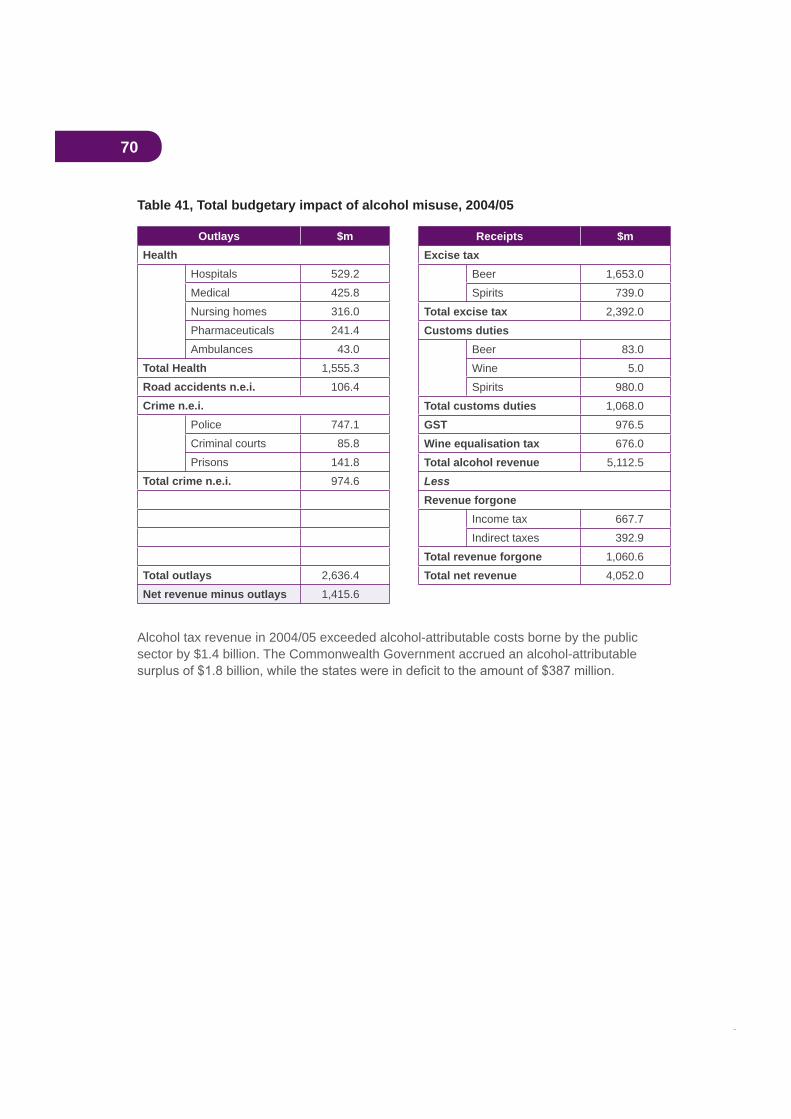
70
Table 41, Total budgetary impact of alcohol misuse, 2004/05
Outlays $mHealth
Hospitals 529.2
Medical 425.8
Nursing homes 316.0
Pharmaceuticals 241.4
Ambulances 43.0
Total Health 1,555.3
Road accidents n.e.i. 106.4
Crime n.e.i.Police 747.1
Criminal courts 85.8
Prisons 141.8
Total crime n.e.i. 974.6
Total outlays 2,636.4
Net revenue minus outlays 1,415.6
Alcohol tax revenue in 2004/05 exceeded alcohol-attributable costs borne by the public sector by $1.4 billion. The Commonwealth Government accrued an alcohol-attributable
Receipts $mExcise tax
Beer 1,653.0
Spirits 739.0
Total excise tax 2,392.0
Customs dutiesBeer 83.0
Wine 5.0
Spirits 980.0
Total customs duties 1,068.0
GST 976.5
Wine equalisation tax 676.0
Total alcohol revenue 5,112.5
LessRevenue forgone
Income tax 667.7
Indirect taxes 392.9
Total revenue forgone 1,060.6
Total net revenue 4,052.0
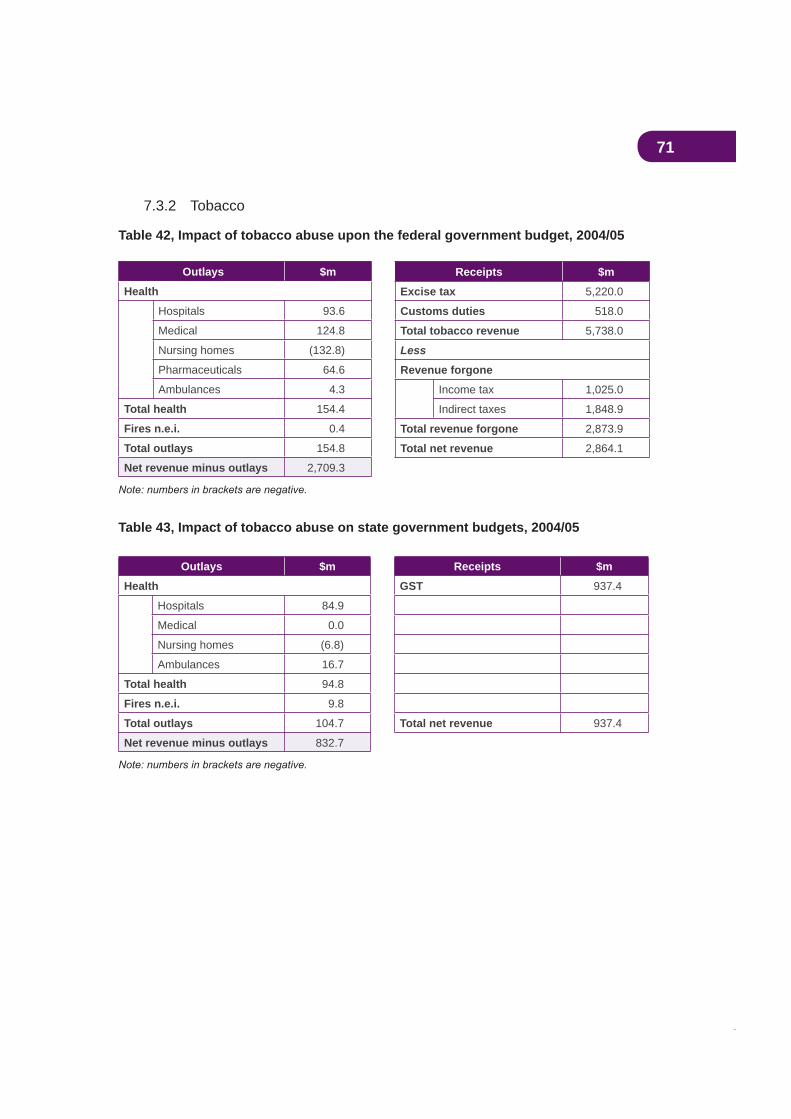
71
7.3.2 Tobacco
Table 42, Impact of tobacco abuse upon the federal government budget, 2004/05
Outlays $m
Health
Hospitals 93.6
Medical 124.8
Nursing homes (132.8)
Pharmaceuticals 64.6
Ambulances 4.3
Total health 154.4
Fires n.e.i. 0.4
Total outlays 154.8
Net revenue minus outlays 2,709.3
Table 43, Impact of tobacco abuse on state government budgets, 2004/05
Outlays $m Receipts $m
Health GST 937.4
Hospitals 84.9
Medical 0.0
Nursing homes (6.8)
Ambulances 16.7
Total health 94.8
Fires n.e.i. 9.8
Total outlays 104.7 Total net revenue 937.4
Net revenue minus outlays 832.7
Receipts $m
Excise tax 5,220.0
Customs duties 518.0
Total tobacco revenue 5,738.0
Less
Revenue forgone
Income tax 1,025.0
Indirect taxes 1,848.9
Total revenue forgone 2,873.9
Total net revenue 2,864.1
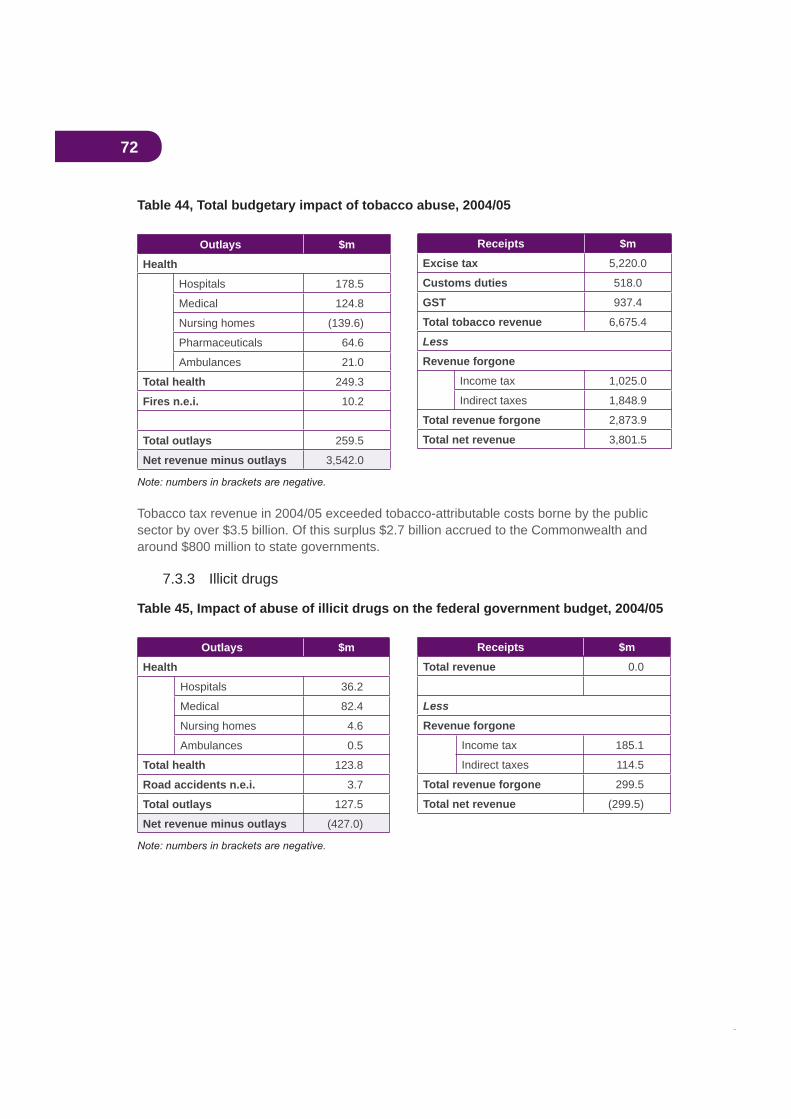
72
Table 44, Total budgetary impact of tobacco abuse, 2004/05
Outlays $m
Health
Hospitals 178.5
Medical 124.8
Nursing homes (139.6)
Pharmaceuticals 64.6
Ambulances 21.0
Total health 249.3
Fires n.e.i. 10.2
Total outlays 259.5
Net revenue minus outlays 3,542.0
Tobacco tax revenue in 2004/05 exceeded tobacco-attributable costs borne by the public sector by over $3.5 billion. Of this surplus $2.7 billion accrued to the Commonwealth and around $800 million to state governments.
7.3.3 Illicit drugs
Table 45, Impact of abuse of illicit drugs on the federal government budget, 2004/05
Outlays $m
Health
Hospitals 36.2
Medical 82.4
Nursing homes 4.6
Ambulances 0.5
Total health 123.8
Road accidents n.e.i. 3.7
Total outlays 127.5
Net revenue minus outlays (427.0)
Receipts $m
Excise tax 5,220.0
Customs duties 518.0
GST 937.4
Total tobacco revenue 6,675.4
Less
Revenue forgone
Income tax 1,025.0
Indirect taxes 1,848.9
Total revenue forgone 2,873.9
Total net revenue 3,801.5
Receipts $m
Total revenue 0.0
Less
Revenue forgone
Income tax 185.1
Indirect taxes 114.5
Total revenue forgone 299.5
Total net revenue (299.5)

73
Table 46, Impact of abuse of illicit drugs on state government budgets, 2004/05
Outlays $m Receipts $m
Health Revenue 0.0
Hospitals 32.9
Medical 0.0
Nursing homes 0.2
Ambulances 2.0
Total health 35.1
Road accidents n.e.i. 17.3
Crime n.e.i.
Police 1,716.9
Criminal courts 146.8
Prisons 348.6
Total crime n.e.i. 2,212.3
Total outlays 2,264.8 Total net revenue 0.0
Net revenue minus outlays (2,264.8)
Table 47, Total budgetary impact of illicit drugs abuse, 2004/05
Outlays $m Receipts $m
Health Revenue forgone 0.0
Hospitals 69.1 Income tax 185.1
Medical 82.4 Indirect taxes 114.5
Nursing homes 4.9 Total revenue forgone 299.5
Ambulances 2.5
Total health 158.9
Road accidents n.e.i. 21.0
Crime n.e.i.
Police 1,716.9
Criminal courts 146.8
Prisons 348.6
Total crime n.e.i. 2,212.3
Total outlays 2,392.2 Total net revenue (299.5)
Net revenue minus outlays (2,691.8)
74
By their nature, illicit drugs yield no tax revenue. Their production or importation by a clandestine industry renders taxation impossible. Indeed, overall tax revenue is reduced (by an estimated $299.5 million in 2004/05) because drug-attributable mortality and morbidity reduce revenue from general taxes on income and consumption. At the same time, the consumption of illicit drugs imposes substantial costs, particularly crime costs, on the public sector. In 2004/05 attributable public sector outlays together with revenue losses amounted to a total of almost $2.7 billion, of which 84 per cent was borne by state governments.
7.3.4 Summary of budgetary impacts
The 1999 Intergovernmental Agreement, which inter alia created the GST and removed the states’ abilities to tax tobacco and alcohol except through the GST (see Section 3), caused
from tobacco and alcohol.
7.4 Drug-attributable costs and gross domestic productEstimates of aggregate drug-attributable social costs tend to produce numbers which are very large in absolute terms. This study is no exception. Commentators often attempt to put these numbers in context by expressing them as a percentage of gross domestic product (GDP), which is a measure of the total value of national production or national income. Similarly, attempts to make international comparisons of the relative sizes of aggregate drug abuse costs in economies of very different sizes (for example, Australia and the USA) tend to be made by comparing aggregate costs expressed as a percentage of GDP.
One problem with this approach is that estimates of drug abuse costs contain certain (sometimes very large) components that are not measured in conventional national account measurements of GDP. In the present study these unmeasured components consist of all intangibles (loss of life, and pain and suffering) and production losses in the household (unpaid) sector. Thus, when total drug-attributable costs are compared with GDP, like is not being compared with like.
In order to address this problem, Table 48 below compares GDP at factor cost (that is, not including taxes and subsidies) with only those components of drug abuse costs which are conventionally measured in national accounts data.
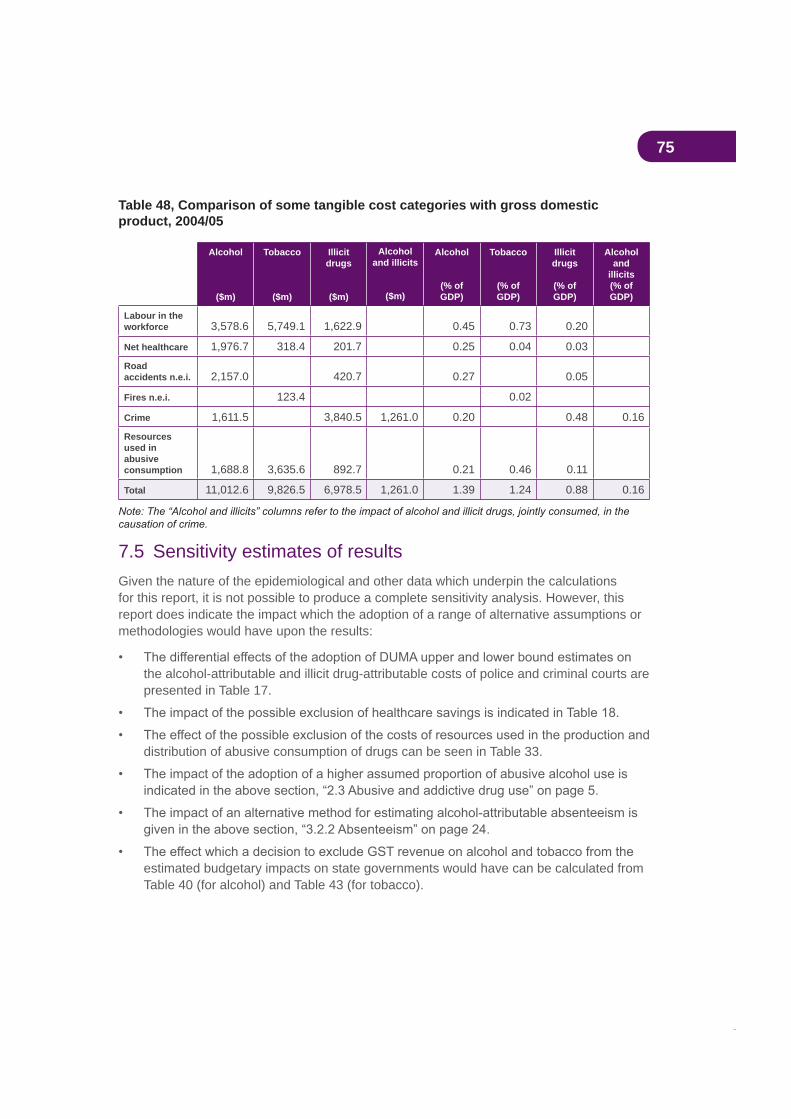
75
Table 48, Comparison of some tangible cost categories with gross domestic product, 2004/05
Alcohol
($m)
Tobacco
($m)
Illicitdrugs
($m)
Alcoholand illicits
($m)
Alcohol
(% of GDP)
Tobacco
(% of GDP)
Illicitdrugs
(% of GDP)
Alcoholand
illicits(% of GDP)
Labour in the workforce 3,578.6 5,749.1 1,622.9 0.45 0.73 0.20
Net healthcare 1,976.7 318.4 201.7 0.25 0.04 0.03
Roadaccidents n.e.i. 2,157.0 420.7 0.27 0.05
Fires n.e.i. 123.4 0.02
Crime 1,611.5 3,840.5 1,261.0 0.20 0.48 0.16
Resourcesused in abusiveconsumption 1,688.8 3,635.6 892.7 0.21 0.46 0.11
Total 11,012.6 9,826.5 6,978.5 1,261.0 1.39 1.24 0.88 0.16
7.5 Sensitivity estimates of resultsGiven the nature of the epidemiological and other data which underpin the calculations for this report, it is not possible to produce a complete sensitivity analysis. However, this report does indicate the impact which the adoption of a range of alternative assumptions or methodologies would have upon the results:
the alcohol-attributable and illicit drug-attributable costs of police and criminal courts are presented in Table 17.
distribution of abusive consumption of drugs can be seen in Table 33.
estimated budgetary impacts on state governments would have can be calculated from Table 40 (for alcohol) and Table 43 (for tobacco).

76
8. Comparability with previous social cost estimates
The present authors have previously estimated the social costs of drug abuse in Australia
try to calculate the rate of change of these costs over time by comparison between the four sets of estimates. However, this is an exercise which should be approached with caution.
Estimates of the social costs of drug abuse can change for a variety of reasons. The main reasons are:
1. Changes in the underlying available epidemiological information, as indicated by the attributable fractions (AFs). The AF for a particular illness or injury indicates the proportion of such cases with that condition in the population that can be causally attributed to consumption of the drug under consideration. The fraction has two components: the strength of the causal relationship between the drug consumption and the condition (the ‘relative risk’), and the prevalence of the consumption by the community of the drug under review. Changes in either or both components will affect the size of the AF, which will feed through to changes in the estimated costs. The estimated relative risk represents the current state of knowledge concerning the causal relationship between the drug consumed and the condition under review, and may change as new research evidence emerges. This may result from development of improved research knowledge rather than from a change in the actual cause of the condition under study. On the other hand, changes in prevalence rates will represent real changes in population exposure to the risk in question.
To illustrate this point, changes in the tobacco AFs for the present study are more a result of reductions in smoking prevalence than a change in information on smoking
alcohol is the major reason for the substantial increase in the estimated social costs of alcohol misuse.
2. Changes in the scope of estimates. As an illustration, a major reason for the increased social costs estimated for 1998/99, compared with earlier years, was the
consumption of alcohol or illicit drugs. With some relatively minor exceptions, the scope of the present study is similar to that of the 1998/99 research.
3. Changes in the information available for the estimation of some categories of cost. One of these changes in the present study relates to availability of improved estimates of workplace absenteeism attributable to alcohol consumption. The result is that the estimated costs of alcohol-attributable workplace absenteeism are much higher than in the 1998/99 study.
77
4. Changes in the costs and effectiveness of prevention and treatment programs.There are many instances of these types of changes. For example, there is now a much wider availability of both government-subsidised prescribed pharmaceuticals and over-the-counter nicotine therapies. Also, there has been increasing state expenditure on treatment programs, most of which have not been subject to economic evaluation. Rapid changes in the patterns of consumption of illicit drugs (see Table 6) have, as a public policy reaction, led to changes in prevention strategies.
5. Changes in the general level of prices and costs. During the period from 1998/99
product rose by 21 per cent (an indication of the change in the general level of prices and costs over this period). Comparison should be made between real changes
current price terms.
If movements in estimated costs resulted from changes in one or more of
the cost estimates over time would be comparable (after adjustment for general
On the other hand, if the changed social cost estimates resulted from changes in one or more of
the results over time will not be directly comparable.
In relation to the comparability of the 2004/05 estimates with those for 1998/99, there has
of the estimates of the social costs of the three drug categories has not changed greatly but the availability of information has improved in some areas, particularly for alcohol-attributable absenteeism and ambulance usage.
In summary, the 1998/99 and 2004/05 estimates for tobacco and illicit drugs are, after taking account of the increase in the general price level, broadly comparable. Those for alcohol are not directly comparable (this issue is discussed further in Section 9 below).
Accordingly, the basis for comparison of the 1998/99 and 2004/05 estimates of the social costs of tobacco is provided in Table 49 below. The same comparison for illicit drugs is provided in Table 50. No meaningful comparison of alcohol costs is possible. To eliminate the effects of the general increase in prices over the period, the 1998/99 cost estimates in these two tables are adjusted to 2004/05 prices by application of the change over that
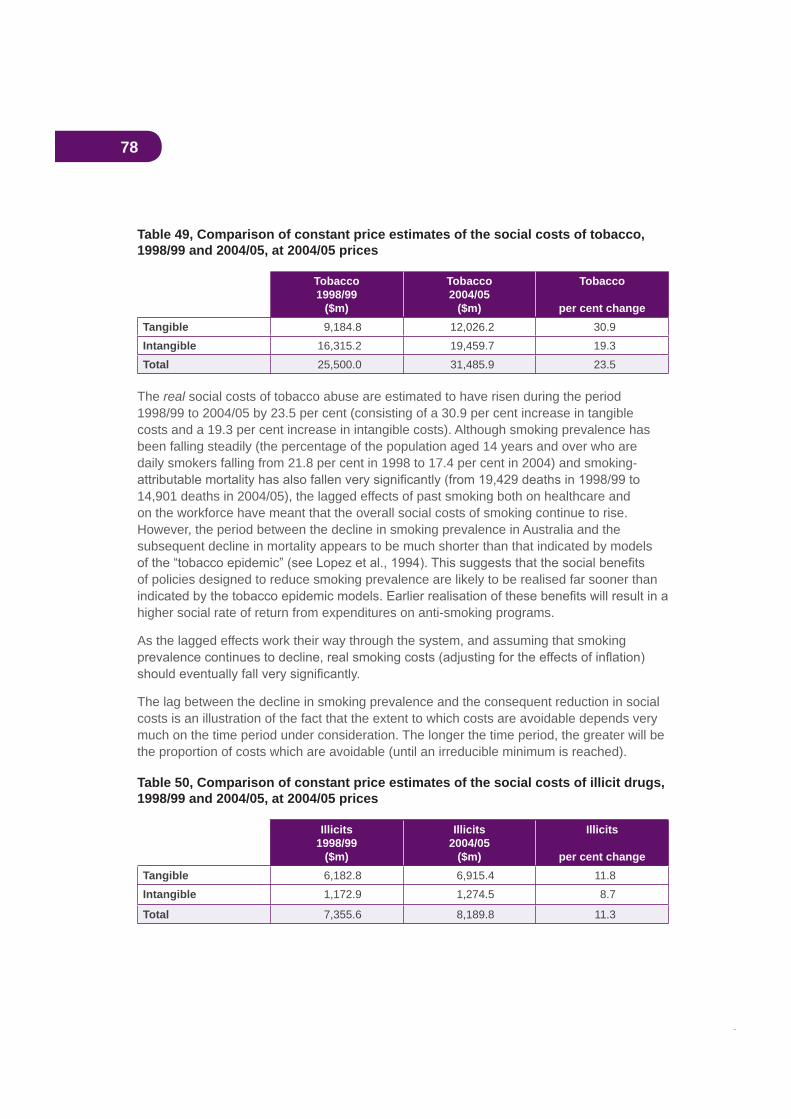
78
Table 49, Comparison of constant price estimates of the social costs of tobacco, 1998/99 and 2004/05, at 2004/05 prices
Tobacco1998/99
($m)
Tobacco2004/05
($m)
Tobacco
per cent changeTangible 9,184.8 12,026.2 30.9Intangible 16,315.2 19,459.7 19.3Total 25,500.0 31,485.9 23.5
The real social costs of tobacco abuse are estimated to have risen during the period 1998/99 to 2004/05 by 23.5 per cent (consisting of a 30.9 per cent increase in tangible costs and a 19.3 per cent increase in intangible costs). Although smoking prevalence has been falling steadily (the percentage of the population aged 14 years and over who are daily smokers falling from 21.8 per cent in 1998 to 17.4 per cent in 2004) and smoking-
14,901 deaths in 2004/05), the lagged effects of past smoking both on healthcare and on the workforce have meant that the overall social costs of smoking continue to rise. However, the period between the decline in smoking prevalence in Australia and the subsequent decline in mortality appears to be much shorter than that indicated by models
of policies designed to reduce smoking prevalence are likely to be realised far sooner than
higher social rate of return from expenditures on anti-smoking programs.
As the lagged effects work their way through the system, and assuming that smoking
The lag between the decline in smoking prevalence and the consequent reduction in social costs is an illustration of the fact that the extent to which costs are avoidable depends very much on the time period under consideration. The longer the time period, the greater will be the proportion of costs which are avoidable (until an irreducible minimum is reached).
Table 50, Comparison of constant price estimates of the social costs of illicit drugs, 1998/99 and 2004/05, at 2004/05 prices
Illicits1998/99
($m)
Illicits2004/05
($m)
Illicits
per cent changeTangible 6,182.8 6,915.4 11.8Intangible 1,172.9 1,274.5 8.7
Total 7,355.6 8,189.8 11.3

79
During the same period the real social costs of illicit drug use are estimated to have risen by 11.3 per cent (consisting of an 11.8 per cent increase in tangible costs and an 8.7 per cent increase in intangible costs). Between 1998/99 and 2004/05 the structure of the illicit drugs market changed very substantially, with a decline in the prevalence of use of some drugs
as to whether the increase in the real social costs of the abuse of illicit drugs resulted from an increased level of usage of illicit drugs or from other causes.
80
9. Future researchOver the years in which we have been involved in this work, data availability and reliability
are either no data or inadequate data and where the production of sound information would enhance the usefulness of social cost studies for measurement and evaluation of policy effectiveness. Several of these recommendations are carried forward from our previous
the ensuing period.
9.1 Re-estimation of the results using the human capital approach
It has been argued above that the demographic approach adopted for this study is preferable to the more widely-adopted human capital approach. These two approaches are compared in Section 2 above. The present authors have suggested that the demographic approach produces results whose interpretation is more straightforward and more easily
costs) of drug abuse, which should from a public policy viewpoint also be taken into account. The argument in favour of adopting the human capital approach is that, since this is the approach adopted in most international studies, its adoption in the Australian study would facilitate comparison with such studies in other countries.
As pointed out in Section 2 above, the data sets used in the two approaches are largely overlapping and it would be feasible to extend the present study to produce human capital-based estimates. It should be emphasised that, in this case, the results of the new study should be very carefully explained and interpreted.
9.2 Recalculation of the 1998/99 alcohol cost estimatesAs indicated above, the 2004/05 estimates of the social costs of alcohol are not comparable with the earlier estimates for 1998/99, for two important reasons:
1. The methodology for the estimation of the alcohol-attributable fractions has changed.
2. Much improved estimates of the impact of alcohol consumption on workplace absenteeism have become available.
For these two reasons the 1998/99 alcohol abuse costs presented in Collins and Lapsley
indicator of the real change in these costs between 1998/99 and 2004/05 it would be necessary to recalculate the earlier results incorporating the improved data now available. This would involve recalculation for 1998/99 of:

81
It can be expected that this recalculation would indicate substantially higher costs than those presented in Collins and Lapsley (2002).
It would be totally inappropriate to recalculate these 2004/05 results in line with the data
using data now acknowledged to be incorrect.
9.3 CrimeThere are several areas in which the availability of crime statistics could be improved if research resources were provided to the appropriate bodies.
The DUCO surveys provided very important information, but they were ‘one-offs’ and are now becoming dated. There is a case for their replication on a three-year cycle as these data cannot be obtained from administrative records, and criminal and drug use behaviours change. For example, recently there has been a decline in the use of heroin but a rise in methamphetamine. Similarly, there has been a decline in property crime but no decline in
of longitudinal data in the criminal justice sector, comparable to the investment in research and data in the health sector.
The collection of DUMA should be expanded. It is currently not collected across all jurisdictions and existing DUMA data show substantial variation across states. As a result current estimates of attributable crime could be biased by the current selection of states. It is recommended that funding for DUMA as an ongoing monitoring program should be ensured.
There are no panel data on the general population that focus on onset, persistence and desistance from crime and drug use. The National Drug Strategy Household Survey does not appear to be the appropriate vehicle as it is already too long and the inclusion of criminal
rate which is already down to 45 per cent.
Tobacco-attributable crime (including smuggling), and therefore its costs, remain
9.4 Workplace absenteeism and reduced workplace productivity attributable to tobacco and illicit drugs
Recent research at the National Centre for Education and Training on Addiction at Flinders University, based on data collected for the 2001 National Drug Strategy Household Survey, has provided the basis for improved estimates of workplace absenteeism attributable to the consumption of alcohol. Similar research in relation to absenteeism attributable to tobacco and to illicit drugs is recommended.
Once again, it has not been possible to identify research from which a reliable estimate of drug-attributable reductions in on-the-job productivity could be produced. These costs,
82
9.5 The value of household workThe Australian Bureau of Statistics data on the value of unpaid work in the household have proved very useful but are now becoming dated. An updating of this research is recommended.
Research conducted by the Queensland Fire and Rescue Service remains the only source
experience is typical of Australia as a whole.
9.7 EpidemiologyThe current research has demonstrated that estimates of the costs of alcohol and of illicit
9.8 PharmaceuticalsThe present study includes an estimate of the costs of some pharmaceuticals prescribed for drug-attributable conditions, but this is a considerable underestimate of the total costs. It would be desirable to have comprehensive studies of prescribed and across-the-counter pharmaceuticals for drug-attributable conditions. Data on drug-attributable primary care provision also would enable more comprehensive estimates of health costs.
9.9 Prescribed pharmaceuticalsFurther, more extensive, research is necessary in order to be able to quantify the costs associated with abusive consumption of prescribed pharmaceuticals.
9.10 LitterAll three categories of drugs (alcohol, tobacco and illicit drugs) impose litter costs. However, adequate data on the basis of which it would be possible to estimate drug-attributable litter costs remain unavailable.
9.11 AmbulancesData collected by the Western Australian Department of Health and, in the case of drug
estimates of drug-attributable ambulance costs. The collection by other states of ambulance data similar to the Western Australian data and the NSW drug overdose data would facilitate inter-state comparisons.

83
9.12 Research and education expenditures With the exception of research undertaken by Moore (2005) in relation to illicit drugs, there remains a lack of information on expenditures by the law enforcement, customs and education sectors on drug-related research and education.
9.13 Road accidentsThe Bureau of Transport and Regional Economics has produced three reports on road crash costs, the most recent being for the year 1996. This information is now becoming outdated and an updating would facilitate future studies of the costs of drug-attributable road accident costs.
9.14 Review of data needsIt was suggested by one of the reviewers of this report that, given the extensive data needs of research of this type and the data gaps which are acknowledged still to exist, an expert advisory meeting should be held to review future data needs. This would involve input from the various disciplines involved in this type of research. It would also involve advice from representatives of bodies using such research results and from those authorities who currently collect, collate and interpret existing data.
84
Bibliography
General referencesAustralian Institute of Health and Welfare (2000a),
Australian Institute of Health and Welfare (2000b), biennial health report.
Australia’s National Tobacco Campaign (2000), Volumes 1 and 2.
96(4) 675-700.
Bureau of Transport Economics (1998), accidents, paper prepared for the Road User Costs Steering Group, Austroads, September.
Collins, D.J. and Lapsley, H.M. (1991), National Campaign Against Drug Abuse Monograph Series No. 15.
Collins, D.J. and Lapsley, H.M. (1996), , National Drug Strategy Monograph Series No. 30,
http://www.health.gov.au/pubhlth/publicat/document/mono30.pdf.
further uses of estimates of the social costs of substance abuse”, Bulletin on Narcotics, Volume LII, Nos. 1 and 2, United Nations Drug Control Programme.
Collins, D.J. and Lapsley, H.M. (2002), , National Drug Strategy Monograph Series No. 49,
http://www.health.gov.au/pubhlth/publicat/document/mono49.pdf.
85
economic data to inform decisions in drug control”, Bulletin on Narcotics, Volume LII, Nos. 1 and 2, United Nations Drug Control Programme.
Collins, David; Lapsley, Helen; Brochu, Serge; Easton, Brian; Pérez-Gómez, Augusto; Rehm, Jürgen; and Single, Eric (2006),
, Health Canada, http://www.hc-sc.gc.ca/ahc-asc/alt_formats/hecs-sesc/pdf/activit/strateg/drugs-drogues/nat-res-rech/cost-cout-abus/costs-estimation-couts_e.pdf.
Policies”, in Abedian, Iraj; van der Merwe, Rowena; Wilkins, Nick; and Jha, Prabhat (eds.), , Applied Fiscal Research
Centre, University of Cape Town.
Commonwealth Department of Family and Community Services (2000), Substance Abuse in Australian Communities, Submission to the House of Representatives Standing Committee on Family and Community Affairs Inquiry, June.
Commonwealth Department of Health and Aged Care (2001), National Alcohol Strategy: A , published for the National Drug Strategy.
prepared for the Alcohol Advisory Council of New Zealand, the Health Research Council of New Zealand and the Public Health Commission, ,Department of Public Health, Wellington School of Medicine.
Addiction, 86, 957-966.
Junor, William; Collins, David; and Lapsley, Helen (2004), The macroeconomic and Report prepared
for the Cancer Council New South Wales, June.
tobacco use”, in Jha, P. and Chaloupka, F. (eds.) (2000), countries, Oxford University Press.
epidemic in developed countries”, Tobacco Control, 3;242-247.
British October., 84,1139-1150
Made More Useful for Illicit Drug Policy Analysis”,Policy, 5 (2), 75-85.
Productivity Commission (1999), .
86
associated with tobacco-related disease,” in G.B. Gori (ed.), Cigarette: The Banbury Cold Spring Harbor Laboratory.
Single, E., Collins, D., Easton, B., Harwood, H., Lapsley, H., Kopp, P., and Wilson, E. (2003),
World Health Organization.
Steering Committee for the Review of Commonwealth/State Service Provision (various years), and
, Productivity Commission, Canberra.
Illegal Drugs,”
CrimeAdhikari, Pramod and Summerill, Amber (2000),
, Australian Institute of Health and Welfare, Drug Statistics Series Number 6.
AUSTRAC (Australian Transaction Reports and Analysis Centre) (1995), .
Australian Bureau of Criminal Intelligence (various years).
, http://www.anao.gov.au.
. Audit Report No. 33 2005-06,http://www.anao.gov.au.
and Non-Reporting”, Trends and Issues in Crime and Criminal Justice, No. 171, October, Australian Institute of Criminology.
Trends and Issues in Crime and Criminal Justice, No. 68, March, Australian Institute of Criminology.
Composition of Australian Correctional Populations, 1988 and 1998”, Trends and Issues in Crime and Criminal Justice, No. 164, July, Australian Institute of Criminology.
Carcach, C. and Makkai, T. (2002), , Report to the Chief Commissioner, Victoria Police, October.
Committee on Data and Research for Policy on Illegal Drugs (2001), , Committee on Law and
Justice and Committee on National Statistics, National Research Council.
87
Commonwealth Attorney-General’s Department (2000),
Substance Abuse in Australia.
Dalrymple, Theodore (2006), bureaucracy, New York: Encounter Books.
Davies, John Booth (1992), , Harwood Academic Publishers.
Dubourg, Richard; Hamed, Joe; and Thorns, Jamie (2005), The economic and social costs
Ghodse, Hamid (1995), , second edition, University Press, Cambridge.
Godfrey, Christine; Eaton, Gail; McDougall, Cynthia; and Culyer, Anthony (2002), The, UK Home
Harrison, L. and Hughes, A. (eds.) (1997), , US Department of Health and Human
Services, National Institutes of Health, NIDA Research Monograph 167.
dependence screen for use with arrestees”, , vol.33, 29-44.
, No 63, Canberra: Australian Institute of Criminology.
Trends and Issues in Crime and Criminal Justice, No. 76, December, Australian Institute of Criminology.
Perpetrators”, Trends and Issues in Crime and Criminal Justice, No. 77, January, Australian Institute of Criminology.
Monitoring System”, Trends and Issues in Crime and Criminal Justice, No.109, April, Australian Institute of Criminology.
Makkai, Toni (1999b), ,Australian Institute of Criminology, Research and Public Policy Series, no 21.
Trends and Issues in Crime and Criminal Justice, No 185, December, Australian Institute of Criminology.
(2002), , Cambridge University Press.

88
fractions from the DUMA project” in Collins and Lapsley (2002).
, No 52, Canberra: Australian Institute of Criminology.
, 54, Canberra: Australian Institute of Criminology.
Matthews, Sharon; Chikritzhs, Tania; Catalanos, Paul; Stockwell, Tim; and Donath, Susan National
Alcohol Indicators Bulletin, No. 5, April, National Drug Research Institute, Perth.
Trends and Issues in Crime and Criminal Justice, No. 247, Canberra: Australian Institute of Criminology.
Trends and Issues in Crime and Criminal Justice, No. 260, Canberra: Australian Institute of Criminology.
Trends and Issues in Crime and Criminal Justice, No. 319, Canberra: Australian Institute of Criminology.
(DUMA): 2005 Annual Report on Drug Use Among Police Detainees”, Policy Series, No 70, Canberra: Australian Institute of Criminology.
Pernanen, K.; Brochu, S.; Cousineau, M.-M.; Cournoyer, L.G.; and Fu Sun (2000),
conceptualization, methods and internal consistency of estimates”, Bulletin on Narcotics,Volume LII, Nos. 1 and 2, United Nations Drug Control Programme.
Pernanen, K.; Cousineau, M-M; Brochu, S.; and Fu Sun (2002), , Canadian Centre on Substance
Abuse, www.ccsa.ca/docs/crime2002.pdf.
Poysner, Carmel; Makkai, Toni; Norman, Louise; and Mills, Leesa (2002). , Report to the National Drug Law
Enforcement Research Fund, April.
Stevenson, Richard J. and Forsythe, Lubica M.V. (1998), , New South Wales Bureau of
Crime Statistics and Research.
Walker, J. (forthcoming), E, report prepared for the Australian Institute of Criminology.
Lapsley (2002) op cit.

89
EpidemiologyAustralian Institute of Health and Welfare (2000), Statistics on drug use in Australia 1998.
Begg, Stephen; Vos, Theo; Barker, Bridget; Stevenson, Chris; Stanley, Lucy; and Lopez, Alan (2007) PHE 82, Australian Institute of Health and Welfare.
Chikritzhs, Tanya; Stockwell, Tim; Jonas, Helen; Stevenson, Chris; Cooper-Stanbury,
methodology for estimating alcohol-caused death, injury and illness in Australia”, Australian , 26,5, pp. 443-450.
English, D.R., Holman, C.D.J., et al. (1995), and mortality in Australia, 1995 edition, Commonwealth Department of Human Services and Health.
cancer as a cause of death”, , 17:429-435.
Holman C.D.J., Armstrong B.K. et al. (1990), and mortality in Australia 1989, Commonwealth Department of Community Services and Health.
Mathers, C.; Vos. T.; and Stevenson, C. (1999), Australia, PHE 17, Australian Institute of Health and Welfare.
National Health and Medical Research Council (1992),
.
Ridolfo, Bruno and Stevenson, Chris (2001), morbidity in Australia, 1998, Australian Institute of Health and Welfare, Drug Statistics Series No. 7.
90
FiresDavies, Chris (1997),
, Research Report No 49, Fire Management Branch, Department of Natural Resources and Environment, Victoria, October.
Queensland Fire and Rescue Service (2006), Spreadsheet—(private communication).
Health
examine non-fatal heroin overdoses”, ; 19:316-17.
Bittoun, Renée (2004), ,report prepared for the Commonwealth Department of Health and Ageing, Decemberhttp://www.health.gov.au/internet/wcms/publishing.nsf/content/phd-pub-tobacco-chopchop-cnt.htm/$FILE/chopchop.pdf.
in heroin supply on fatal and non-fatal drug overdoses in New South Wales, Australia”, , Volume 182, Number 1, 3 January.
Degenhardt, Louisa; Hall, Wayne; and Adelstein, Barbara-Ann (2000), Ambulance calls to ,
National Drug and Alcohol Research Centre Technical Report No. 94.
, vol. 19, 1, March.
Health Insurance Commission, .
May 19, 1, pp.417-420.
LitterEcorecycle, Victorian Government Litter Research, http://www.ecorecycle.vic.gov.au/litter/litter_research.asp.
Ecorecycle,
Grants: litter infrastructure 1997/98, Victorian Government Litter Researchhttp://www.ecorecycle.vic.gov.au/litter/litter_research.asp.
Keep Australia Beautiful, http://www.pc.gov.au/inquiry/49packag.chap5.pdfAugust 2000.
of tobacco use”, Tobacco Control, 8 (1), 75-80, Spring.
91
Paid and unpaid workforceAustralian Bureau of Statistics (2000), (5240.0).
Bush, Robert and Wooden, Mark (1994), , National Institute of Labour Studies,
Flinders University, South Australia, March.
Evidence”, , vol. 41,3.
the workplace in Scotland”, Tobacco Control, June, Vol. 9 No. 2.
Pidd, Kenneth J.; Berry, Jesia G.; Roche, Ann M.; and Harrison, James E. (2006),
importance of consumption patterns”, , Volume 185 Number 11/12, 4/18 December.
Pidd, Kenneth J.; Berry, Jesia G.; Harrison, James E.; Roche, Ann M.; Driscoll, Tim R and Newson, Rachel S. (2006), ,Australian Institute of Health and Welfare Injury Research and Statistics Series Number 28, June.
Webb, Gloria; Redman, Selina; Hennrikus, Deborah; Kelman, Richard; Gibberd, Robert; and
the occurrence of work injuries and related absences”, , Vol. 55, 4.
Public expendituresMoore, Timothy J. (2005),
Turning Point Alcohol and Drug Centre, Drug Policy Modelling Project Monograph 01.
Road accidentsAustroads Working Group (2000), , Austroads
Bureau of Transport Economics (2000), BTE Report 102, Canberra.
Drummer, O. (1994), Victorian
Institute of Forensic Pathology, Department of Forensic Pathology, Monash University.

92
State cost estimatesCollins, D.J. and Lapsley, H.M. (1999),
Victorian Smoking and Health Program, Melbourne.
Collins, D.J. and Lapsley, H.M (2001), Cancer
Foundation of Western Australia, Monograph series No. 1 2001.
Collins, D.J. and Lapsley, H.M. (2004), The Cancer Council Western Australia,
Monograph series Number 4, 2004.
Collins, D.J. and Lapsley, H.M. (2005), , Report prepared for the NSW Department of Health.
Collins, D.J. and Lapsley, H.M. (2006), , Report prepared for the Victorian Department of
Human Services.

93
Data sourcesAdhikari, Pramod and Summerill, Amber (2000),
, Australian Institute of Health and Welfare, Drug Statistics Series Number 6.
Australian Bureau of Criminal Intelligence (various years), .
Australian Bureau of Statistics, (4382.0.55.001).
Australian Bureau of Statistics, and Product (5206.0).
Australian Bureau of Statistics, Australian National Accounts: State Accounts (5242.0).
Australian Bureau of Statistics, (3101.0).
Australian Bureau of Statistics, (6302.0).
Australian Bureau of Statistics, (3303.0).
Australian Bureau of Statistics, (5651.0).
Australian Bureau of Statistics, Consumer Price Index (6401.0).
Australian Bureau of Statistics, (4512.0).
Australian Bureau of Statistics, , (4509.0).
Australian Bureau of Statistics, (3302.0).
Australian Bureau of Statistics, (6306.0).
Australian Bureau of Statistics, Population by Sex and Age: Australian States and Territories (3201.0).
Australian Bureau of Statistics, (4513.0).
Australian Bureau of Statistics, (4808.0).
Australian Bureau of Statistics, (6348.0).
Australian Bureau of Statistics, (8221.0).
Australian Bureau of Statistics, , States and Territories (8221.1 to 8221.7).
Australian Bureau of Statistics, (8202.0).
Australian Bureau of Statistics, (5236.0).
94
Australian Bureau of Statistics, Prisoners in Australia (4517.0).
Australian Bureau of Statistics, (4390.0).
Australian Bureau of Statistics, , Australia (4510.0).
Australian Bureau of Statistics, (9208.0).
Australian Bureau of Statistics, (5506.0).
Australian Bureau of Statistics, (6203.0).
Australian Bureau of Statistics, (5240.0).
Australian Bureau of Statistics, , (6342.0).
Australian Bureau of Statistics, , (1301.0).
Australian Customs Service, (various years).
Australian Institute of Health and Welfare,
Australian Institute of Health and Welfare (1999), , August.
Australian Institute of Health and Welfare (2000a), Statistics on drug use in Australia 1998.
Australian Institute of Health and Welfare (2000b), .
Australian Institute of Health and Welfare (2002a), .
Australian Institute of Health and Welfare (2002b), , May.
Australian Institute of Health and Welfare (2002c), .
Australian Institute of Health and Welfare (2005a),
Australian Institute of Health and Welfare (2005b),
Australian Institute of Health and Welfare (2005c), .
Australian Institute of Health and Welfare (2005d), .
Australian Institute of Health and Welfare (2006), ,Health and Welfare Expenditure Series Number 28.
Australian Institute of Health and Welfare (2007),
95
Taxation Statistics.
Australian Transport Safety Board (2005),
Australian Government Department of Health and Ageing (various years), .
Australian Government Department of Health and Ageing, , StatisticalSupplement.
Fitzsimmons, Gerard and Cooper-Stanbury, Mark (2000), , Australian Institute of Health and Welfare.
Health Insurance Commission,
Makkai, Toni (2000), ,Australian Institute of Criminology Research and Public Policy Series, No. 26.
Makkai, Toni and McGregor, Kiah (2001), , Australian Institute of Criminology Research
and Public Policy Series, No. 37.
Makkai, Toni and McGregor, Kiah (2002), , Australian Institute of Criminology Research
and Public Policy Series, No. 41.
Medicare Australia (various years), .
Medicare Australia (various years),
Miller, Megge and Draper, Glenn (2001), , Australian Institute of Health and Welfare.
.
Queensland Fire and Rescue Service (2006), Spreadsheet—, (private communication).
Steering Committee for the Review of Commonwealth/State Service Provision, (various years) and
, AusInfo.
Stevenson, Richard J. and Forsythe, Lubica M.V. (1998), , New South Wales Bureau of
Crime Statistics and Research.
Taylor, Natalie and Bareja, Michael (2005), , Australian Institute of Criminology Technical and Background Paper No. 13.
96
Appendix A, Demographic estimatesUse of aetiological fractions and demographic data to estimate the additional numbers of Australian males and females who would have been alive and enumerated in the Australian population in June 2005 had there been no use of illicit drugs, alcohol or tobacco.
This appendix was written by J.H. Pollard, Emeritus Professor of Actuarial Studies,
Macquarie University, who undertook the demographic calculations for this study.
IntroductionThe results of the calculations are shown in the attached tables. In each case:
Column (1) indicates the relevant age group;
Column (2) lists the mid-year 2005 population as estimated by the Australian Bureau of Statistics;
Column (3) lists the estimated mid-year population, had there been no use at any time of illicit drugs (but alcohol and tobacco were used at the same historic levels);
Column (4) lists the numbers of additional persons who would still be alive had there been no use of illicit drugs at any time; Column (4) = Column (3) - Column (2);
Column (5) lists the estimated mid-year population had there been no use of either illicit drugs or alcohol at any time (but tobacco was used at the same historic level);
Column (6) lists the numbers of additional persons who would still be alive had there been no use of alcohol at any time; Col. (6) = Col. (5) - Col. (3);
Column (7) lists the estimated mid-year population had there been no use of illicit drugs, alcohol or tobacco at any time;
Column (8) lists the numbers of additional persons who would still be alive had there been no use of tobacco at any time; Col. (8) = Col. (7) - Col. (5).
We note from column (7) that, in the absence of the use of illicit drugs, alcohol and tobacco, the 2005 male population would be 3.5 per cent higher than it is estimated to have been, and that the 2005 female population would be 1 per cent higher.
97
The dataThe aetiological fractions used in this report are those presented in English, Holman et al. (1995), Ridolfo and Stevenson (2001), and by Codde in Appendix C of this report. For the
to 1988 (but without illicit drug deaths prior to 1962) and those of Ridolfo and Stevenson in 1998, with intermediate fractions for the period 1989–1997. Those of Codde are assumed to apply in 2006, with intermediate fractions from 1999 and 2005.
The other data used in the calculations are as follows:
years in each decade (1950s, 1960s, 1970s, 1980s,1990s) and 2000-2003
These demographic data were all available from Australian Bureau of Statistics (ABS) publications.
MethodUsing the base 1947 population, the history of births, the above-mentioned life tables and the representative migration numbers, it was possible to project forward the Australian population from 1947 to 2005. The resultant estimates for 2005 were close to those provided by ABS.
illicit drug use nor alcohol use, and (c) no illicit drug use, nor alcohol use nor tobacco use.
year age groups.
As in previous reports, no attempt was made to quantify the births that did not take place because of lives lost through drug usage.
98
Adjustment of the mortality ratesUsing the aetiological fractions described above and applying them to the relevant causes
at each age attributable to illicit drug use, to alcohol use and to tobacco use. These proportions were then applied to the mortality rates in earlier epochs to determine the
This approach can be criticised on several counts. First, it is doubtful whether exactly the same fractions applied in earlier years, since usage of these drugs has changed over time, and other factors have had major impacts on the numbers dying from the various causes (road accident deaths, for example, have halved in the last decade, as a result of various measures, and circulatory system disease mortality has declined remarkably, presumably as a result of a number of lifestyle and medical changes). Second, the aetiological fractions ought to be applied to the deaths by cause in earlier epochs to derive mortality proportions relevant to those times. This second objection can be addressed, but any improvement in
It is important to note that the current Australian Burden of Disease (ABOD) study (see Begg et al.,with the previous study, with only an estimated 2,346 deaths being saved by alcohol in 2003, compared with 7,157 deaths saved in 1996. According to the authors of the current ABOD report, the previous study incorrectly estimated the number of people who abstain from alcohol or drink less than 0.25 drinks per day. In the absence of corrected aetiological fractions for the mid 1990s, the original fractions were incorporated in the projection as described above, and as a result the net numbers of alcohol-related deaths are believed to be underestimated. Further discussion of the issue and consequences is given in the main
.
In the absence of equivalent aetiological fractions for all earlier epochs, the above approach was considered the most reliable.
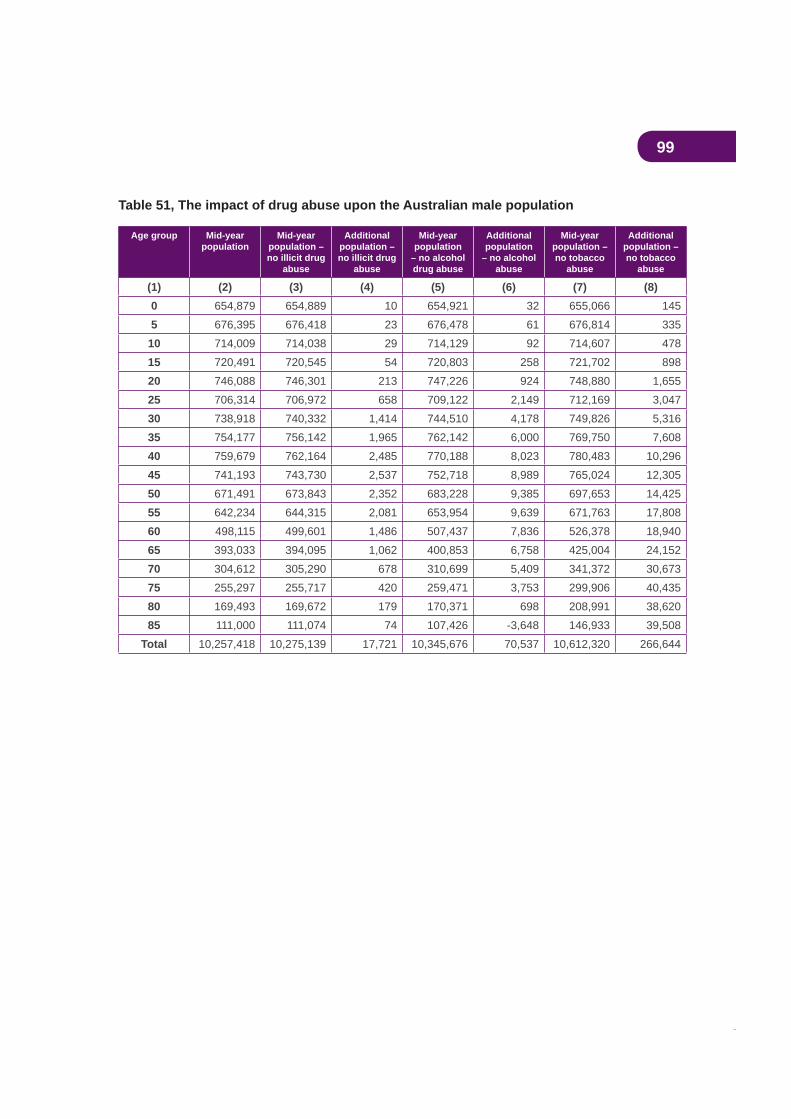
99
Table 51, The impact of drug abuse upon the Australian male population
Age group Mid-yearpopulation
Mid-yearpopulation – no illicit drug
abuse
Additionalpopulation – no illicit drug
abuse
Mid-yearpopulation
– no alcohol drug abuse
Additionalpopulation
– no alcohol abuse
Mid-yearpopulation – no tobacco
abuse
Additionalpopulation – no tobacco
abuse
(1) (2) (3) (4) (5) (6) (7) (8)0 654,879 654,889 10 654,921 32 655,066 1455 676,395 676,418 23 676,478 61 676,814 335
10 714,009 714,038 29 714,129 92 714,607 47815 720,491 720,545 54 720,803 258 721,702 89820 746,088 746,301 213 747,226 924 748,880 1,65525 706,314 706,972 658 709,122 2,149 712,169 3,04730 738,918 740,332 1,414 744,510 4,178 749,826 5,31635 754,177 756,142 1,965 762,142 6,000 769,750 7,60840 759,679 762,164 2,485 770,188 8,023 780,483 10,29645 741,193 743,730 2,537 752,718 8,989 765,024 12,30550 671,491 673,843 2,352 683,228 9,385 697,653 14,42555 642,234 644,315 2,081 653,954 9,639 671,763 17,80860 498,115 499,601 1,486 507,437 7,836 526,378 18,94065 393,033 394,095 1,062 400,853 6,758 425,004 24,15270 304,612 305,290 678 310,699 5,409 341,372 30,67375 255,297 255,717 420 259,471 3,753 299,906 40,43580 169,493 169,672 179 170,371 698 208,991 38,62085 111,000 111,074 74 107,426 -3,648 146,933 39,508
Total 10,257,418 10,275,139 17,721 10,345,676 70,537 10,612,320 266,644
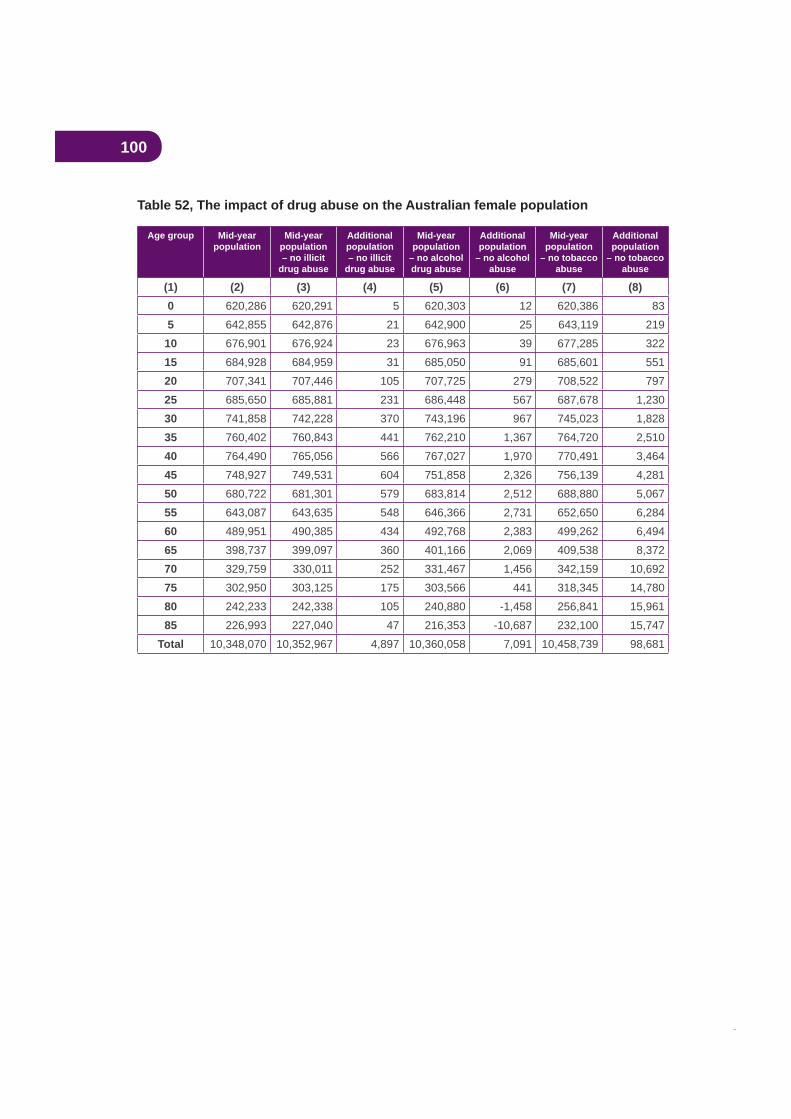
100
Table 52, The impact of drug abuse on the Australian female population
Age group Mid-yearpopulation
Mid-yearpopulation– no illicit
drug abuse
Additionalpopulation– no illicit
drug abuse
Mid-yearpopulation
– no alcohol drug abuse
Additionalpopulation
– no alcohol abuse
Mid-yearpopulation
– no tobacco abuse
Additionalpopulation
– no tobacco abuse
(1) (2) (3) (4) (5) (6) (7) (8)0 620,286 620,291 5 620,303 12 620,386 835 642,855 642,876 21 642,900 25 643,119 219
10 676,901 676,924 23 676,963 39 677,285 32215 684,928 684,959 31 685,050 91 685,601 55120 707,341 707,446 105 707,725 279 708,522 79725 685,650 685,881 231 686,448 567 687,678 1,23030 741,858 742,228 370 743,196 967 745,023 1,82835 760,402 760,843 441 762,210 1,367 764,720 2,51040 764,490 765,056 566 767,027 1,970 770,491 3,46445 748,927 749,531 604 751,858 2,326 756,139 4,28150 680,722 681,301 579 683,814 2,512 688,880 5,06755 643,087 643,635 548 646,366 2,731 652,650 6,28460 489,951 490,385 434 492,768 2,383 499,262 6,49465 398,737 399,097 360 401,166 2,069 409,538 8,37270 329,759 330,011 252 331,467 1,456 342,159 10,69275 302,950 303,125 175 303,566 441 318,345 14,78080 242,233 242,338 105 240,880 -1,458 256,841 15,96185 226,993 227,040 47 216,353 -10,687 232,100 15,747
Total 10,348,070 10,352,967 4,897 10,360,058 7,091 10,458,739 98,681
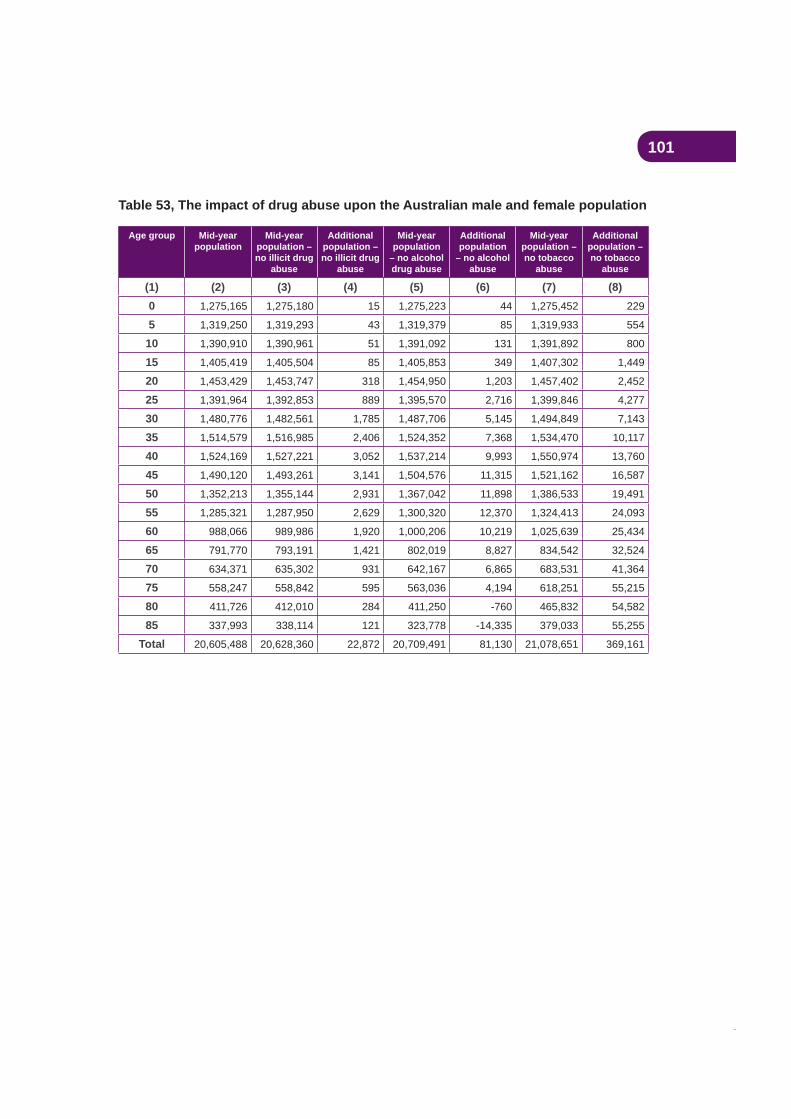
101
Table 53, The impact of drug abuse upon the Australian male and female population
Age group Mid-yearpopulation
Mid-yearpopulation – no illicit drug
abuse
Additionalpopulation – no illicit drug
abuse
Mid-yearpopulation
– no alcohol drug abuse
Additionalpopulation
– no alcohol abuse
Mid-yearpopulation – no tobacco
abuse
Additionalpopulation – no tobacco
abuse
(1) (2) (3) (4) (5) (6) (7) (8)0 1,275,165 1,275,180 15 1,275,223 44 1,275,452 229
5 1,319,250 1,319,293 43 1,319,379 85 1,319,933 554
10 1,390,910 1,390,961 51 1,391,092 131 1,391,892 800
15 1,405,419 1,405,504 85 1,405,853 349 1,407,302 1,449
20 1,453,429 1,453,747 318 1,454,950 1,203 1,457,402 2,452
25 1,391,964 1,392,853 889 1,395,570 2,716 1,399,846 4,277
30 1,480,776 1,482,561 1,785 1,487,706 5,145 1,494,849 7,143
35 1,514,579 1,516,985 2,406 1,524,352 7,368 1,534,470 10,117
40 1,524,169 1,527,221 3,052 1,537,214 9,993 1,550,974 13,760
45 1,490,120 1,493,261 3,141 1,504,576 11,315 1,521,162 16,587
50 1,352,213 1,355,144 2,931 1,367,042 11,898 1,386,533 19,491
55 1,285,321 1,287,950 2,629 1,300,320 12,370 1,324,413 24,093
60 988,066 989,986 1,920 1,000,206 10,219 1,025,639 25,434
65 791,770 793,191 1,421 802,019 8,827 834,542 32,524
70 634,371 635,302 931 642,167 6,865 683,531 41,364
75 558,247 558,842 595 563,036 4,194 618,251 55,215
80 411,726 412,010 284 411,250 -760 465,832 54,582
85 337,993 338,114 121 323,778 -14,335 379,033 55,255
Total 20,605,488 20,628,360 22,872 20,709,491 81,130 21,078,651 369,161
102
Appendix B, Drugs and crime: calculating attributable fractions from the DUMA and DUCO projectsThis appendix was written by Dr Toni Makkai, Director, Australian Institute of Criminology and Dr Jeromey Temple, Research Fellow, Research School of Social Sciences, Australian National University.
AcknowledgmentsNumerous agencies and individuals have contributed to the DUMA and DUCO collections and their support is gratefully acknowledged, as well as those many individuals who have voluntarily provided personal information on their drug and crime activities. In addition to the considerable ‘in-kind’ support provided to the projects by various police and juvenile
Australian and South Australian Governments. Neither the funding agencies, collectors, nor the various agencies involved bear any responsibility for the analyses or interpretations presented here. We would like to acknowledge the earlier work undertaken by Institute staff, Kiah McGregor and Paul Williams, upon which this update draws.
IntroductionIn 2002 the Australian Institute of Criminology produced a series of fractions for crime that could be attributed to drug use (see Makkai and McGregor, 2002 and Williams, 2002). This paper updates that information and as a result draws on the earlier work produced
and justice collections which do not allow us to produce attributable fractions that could be deemed as being ‘true’. In particular Australia does not produce annual national data on:
intoxicated with alcohol
dependency on an illegal substance.
limitations and are often not regularly published at a national level (see Makkai, 1999; Carcach, 1997; Carcach and Makkai, 2002; Pernanen, et al., 2002). This is compounded by measurement issues of intoxication and dependency (see Makkai, 2002; Pernanen et al., 2002). There is currently no reliable drug test that can determine levels of intoxication (see Poysner, Makkai, Norman and Mills, 2002) or dependency for illegal drugs such as heroin and cocaine.
103
There have been a number of studies in criminology that have shown discrepancies between self-reported use and drug testing results amongst police detainees and incarcerated detainees (Harrison and Hughes, 1997; Committee on Data and Research for Policy on Illegal Drugs, 2001). These studies have found that concordance between self-report and chemical testing for illegal drug use varies by socio-demographic characteristics and the particular drug involved (see McGregor and Makkai, 2003). There is also debate over whether self-reported attributions for drugs and offending are reliable (see Davies, 1992 and Dalrymple, 2006).
There are essentially three models or ideal types that are used to explain the causal links between drugs and crime (see Pernanen et al., 2002):
1. Psychopharmacological—this postulates that the person was intoxicated and the intoxication resulted in antisocial and criminal behaviour. This requires data on the level of intoxication at the time of offending and that the intoxication caused the behaviour.
2. Economic compulsive—this postulates the person has a drug dependency problem that ‘compelled’ the person to commit crimes to support the drug habit. Again this model requires that a causal link be demonstrated.
3. Systemic—the crimes result from engagement in ‘drug market’ activity such as
Model 1 is usually applied to violent and disorderly behaviour, most notably in the case of alcohol and stimulants such as amphetamines and cocaine.
Model 2 is usually applied to property crime most notably in the case of heroin and other illicit substances, but not usually alcohol or cannabis.
Model 3 involves two components – offending behaviour associated with a drug market
as this requires a causal component (see Pernanen et al., 2002, p. 82 for more detailed
100 percent on the basis that the crime would not have occurred if the activity had been
and tobacco, there continues to be illegal activity. Further, different forms of the substance
drugs will not make any difference to their illegal activity.
There are complications with these ideal types. A person may commit an armed robbery to
offence. Police arrest people for a wide range of infractions of the law that these theories do not cover. For example, driving without a licence or a breach of bail conditions. Determining the extent to which ‘crime’ is drug-related is complex and requires data at such a level of
and measurement are advanced in the criminal justice sector it remains necessary to rely on samples and to a large extent self-report data by offenders of their behaviour.
104
Data sources and key limitations: DUMA and DUCOThe data used in this paper come from the Drug Use Monitoring in Australia (DUMA) (see Mouzos, Smith and Hind, 2006) and the Drug Use Careers of Offenders (DUCO) projects (see Makkai and Payne, 2003; Johnson, 2004). DUMA is a regular quarterly monitoring system that has been operating since 1999. It surveys adult male and female persons brought to selected police stations for arrest purposes. DUCO was a one-off large scale survey of adult male and female offenders. Both collections have limitations. They are
of urinalysis testing. Neither data set is national, however both have the largest samples of their respective populations that are available for secondary analysis. DUMA data are
2002 and the female sample undertaken in 2003.
2006. DUCO relies on 2,135 sentenced adult male inmates in four jurisdictions and 467 sentenced adult female inmates in six jurisdictions.
Measuring offendingThere are three measures of offending—the number of offenders, the number of offending episodes and within that episode the number of offences. In any one year an offender may commit more than one offending episode. In addition, the number of charges can vary for
Further, not all charges will go to court, and not all charges that do go to court will result in
As there are hundreds of offences, for ease of interpretation these have been collapsed into
disorder, breaches and other offences. A most serious offence hierarchy, which ranges from violent to other offences, has been calculated. For DUMA the decision was made to take into account all arrests reported over the past 12 months, not just the most current offence. Potentially this overcomes the problem of relying on one arrest occasion as a
demonstrated that drug-using offenders report higher rates of offending than non-drug using
of crime that is drug-related, unless adjustments for multiple offences are made.
Increasingly police are issuing ‘street’-level cautions or notices to appear in court which do not involve bringing people to the police station or watchhouse. As a result the DUMA sample is likely to be skewed towards the more serious crimes. In the DUCO surveys only selected criminal histories were collected, so it is not possible to adjust for offending in the 12 months prior to the current offending episode that resulted in a term of imprisonment.

105
Measuring intoxication with DUMA dataIf a person has used a drug it does not automatically mean they are intoxicated, although clearly use is a prerequisite for intoxication. The DUMA study does not ask detainees if they were intoxicated at the time of arrest; it asks if they had been using any drugs at the time of arrest. Similarly, detainees are asked if they were using alcohol at the time of the arrest but not whether they were intoxicated. Both of these measures are problematic but they are the best available and are used as surrogates for intoxication. In all likelihood they overestimate the level of intoxication, particularly for alcohol.
DUCO did ask offenders if they were intoxicated at the time of committing the most serious offence for which they were incarcerated and this measure is used in the DUCO calculations.
Measuring causationThere is no measure or even approximation for causal behaviour for alcohol in DUMA. In terms of illicit drugs, detainees are asked to indicate in the past 12 months how many of
none of it. Previous experience with asking detainees to provide more detailed information, such as in percentage terms, resulted in unreliable data. The most liberal estimate is taken by assuming that if the detainees indicated some or more of their offending was drug-related they were assumed to be drug-related. DUCO relies upon individual offenders’ accounts of why they committed their crimes.
Measuring dependency
Furthermore, there has been relatively little work on validating standard dependency
physiological, behaviour and cognitive phenomena of variable intensity in which the use of a psychoactive drug (or drugs) takes on a high priority’ (Ghodse, 1995: 3). In the previous calculations the DUMA attributions relied on a single item that asked detainees whether they felt they needed or were dependent on [drugs] in the past 12 months.
In 2004, a six item scale to measure alcohol and illegal drug dependency was included. This scale had been developed for use with police detainees in the United States and the
DMS-IV (see Hoffman et al., 2003). If individuals answer yes to three of the six items they are considered to be dependent (Mouzos et al., 2006). This same scale was also replicated in the female DUCO sample and is used to measure dependency. The DUCO male sample relies on offenders’ self-reported motivations for their most serious offence. Such
Table 54 provides two pieces of information – the upper and lower estimates for attributions of offending activity to drug dependency and two sets of attributions using a single item versus a scale to measure dependency. Regardless of whether the single item or the scale
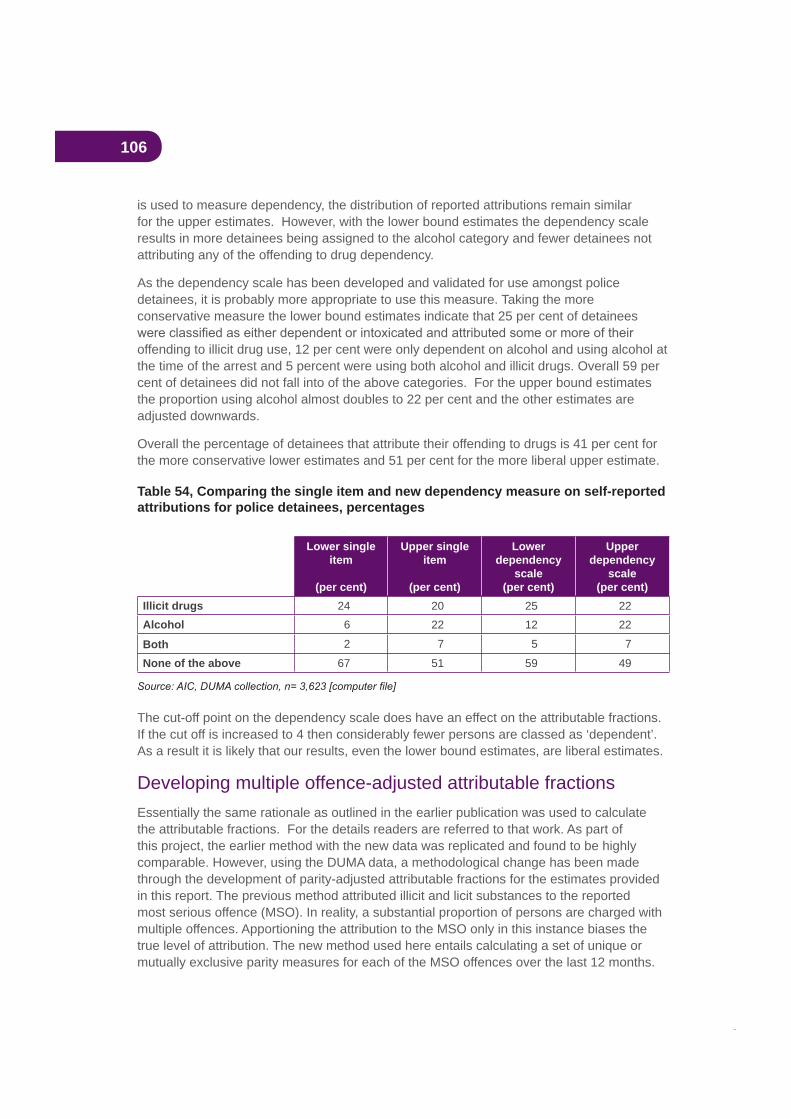
106
is used to measure dependency, the distribution of reported attributions remain similar for the upper estimates. However, with the lower bound estimates the dependency scale results in more detainees being assigned to the alcohol category and fewer detainees not attributing any of the offending to drug dependency.
As the dependency scale has been developed and validated for use amongst police detainees, it is probably more appropriate to use this measure. Taking the more conservative measure the lower bound estimates indicate that 25 per cent of detainees
offending to illicit drug use, 12 per cent were only dependent on alcohol and using alcohol at the time of the arrest and 5 percent were using both alcohol and illicit drugs. Overall 59 per cent of detainees did not fall into of the above categories. For the upper bound estimates the proportion using alcohol almost doubles to 22 per cent and the other estimates are adjusted downwards.
Overall the percentage of detainees that attribute their offending to drugs is 41 per cent for the more conservative lower estimates and 51 per cent for the more liberal upper estimate.
Table 54, Comparing the single item and new dependency measure on self-reported attributions for police detainees, percentages
Lower single item
(per cent)
Upper single item
(per cent)
Lowerdependency
scale(per cent)
Upperdependency
scale(per cent)
Illicit drugs 24 20 25 22Alcohol 6 22 12 22
Both 2 7 5 7
None of the above 67 51 59 49
The cut-off point on the dependency scale does have an effect on the attributable fractions. If the cut off is increased to 4 then considerably fewer persons are classed as ‘dependent’. As a result it is likely that our results, even the lower bound estimates, are liberal estimates.
Developing multiple offence-adjusted attributable fractions Essentially the same rationale as outlined in the earlier publication was used to calculate the attributable fractions. For the details readers are referred to that work. As part of this project, the earlier method with the new data was replicated and found to be highly comparable. However, using the DUMA data, a methodological change has been made through the development of parity-adjusted attributable fractions for the estimates provided in this report. The previous method attributed illicit and licit substances to the reported most serious offence (MSO). In reality, a substantial proportion of persons are charged with multiple offences. Apportioning the attribution to the MSO only in this instance biases the true level of attribution. The new method used here entails calculating a set of unique or mutually exclusive parity measures for each of the MSO offences over the last 12 months.
107
These are then combined to take into account parities across the offence categories producing multiple offence-adjusted attributions. Effectively, attributions for violent crime (the most serious offence category) remain unchanged but all the other attributions are adjusted by parities for lower order offending episodes.
Table 55 provides multiple offence-adjusted attributions by crime type. It is important to note that these attributable fractions are not for individual offenders. The 95 per cent
calculated. The range of the estimates can vary by as much as 11 percentage points for
In the 2002 calculations a theoretical decision was taken to attribute 100 per cent of drug and drink driving behaviour to substance use. In these calculations we have estimated attributions for crime type based on what offenders reported, which is consistent with the DUCO calculations.
Overall attribution tends to be highest for illicit drugs only, followed by alcohol only and then both. When the fractions are adjusted for levels of dependency, there are noticeable differences for the more liberal estimates, with alcohol being the highest category for violent, drink driving and disorder crime types.
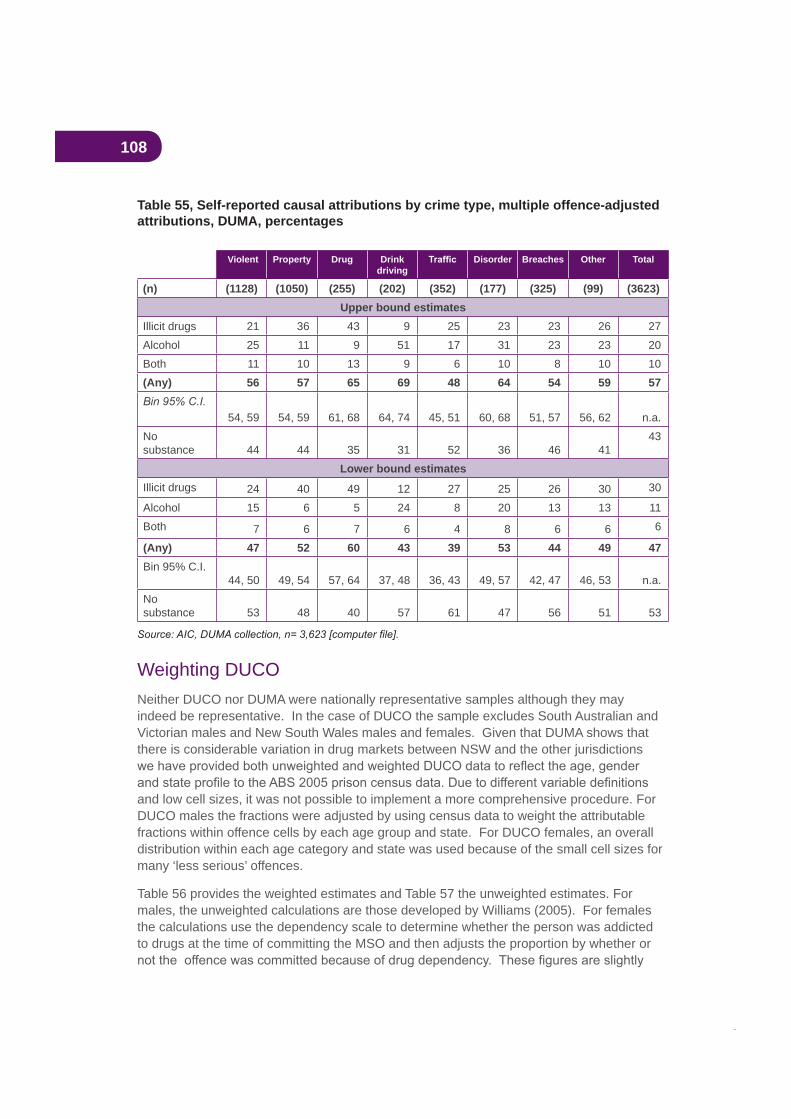
108
Table 55, Self-reported causal attributions by crime type, multiple offence-adjusted attributions, DUMA, percentages
Violent Property Drug Drinkdriving
Disorder Breaches Other Total
(n) (1128) (1050) (255) (202) (352) (177) (325) (99) (3623)Upper bound estimates
Illicit drugs 21 36 43 9 25 23 23 26 27Alcohol 25 11 9 51 17 31 23 23 20Both 11 10 13 9 6 10 8 10 10(Any) 56 57 65 69 48 64 54 59 57
54, 59 54, 59 61, 68 64, 74 45, 51 60, 68 51, 57 56, 62 n.a.Nosubstance 44 44 35 31 52 36 46 41
43
Lower bound estimatesIllicit drugs 24 40 49 12 27 25 26 30 30
Alcohol 15 6 5 24 8 20 13 13 11Both 7 6 7 6 4 8 6 6 6
(Any) 47 52 60 43 39 53 44 49 47Bin 95% C.I.
44, 50 49, 54 57, 64 37, 48 36, 43 49, 57 42, 47 46, 53 n.a.Nosubstance 53 48 40 57 61 47 56 51 53
Weighting DUCONeither DUCO nor DUMA were nationally representative samples although they may indeed be representative. In the case of DUCO the sample excludes South Australian and Victorian males and New South Wales males and females. Given that DUMA shows that there is considerable variation in drug markets between NSW and the other jurisdictions
and low cell sizes, it was not possible to implement a more comprehensive procedure. For DUCO males the fractions were adjusted by using census data to weight the attributable fractions within offence cells by each age group and state. For DUCO females, an overall distribution within each age category and state was used because of the small cell sizes for many ‘less serious’ offences.
Table 56 provides the weighted estimates and Table 57 the unweighted estimates. For males, the unweighted calculations are those developed by Williams (2005). For females the calculations use the dependency scale to determine whether the person was addicted to drugs at the time of committing the MSO and then adjusts the proportion by whether or
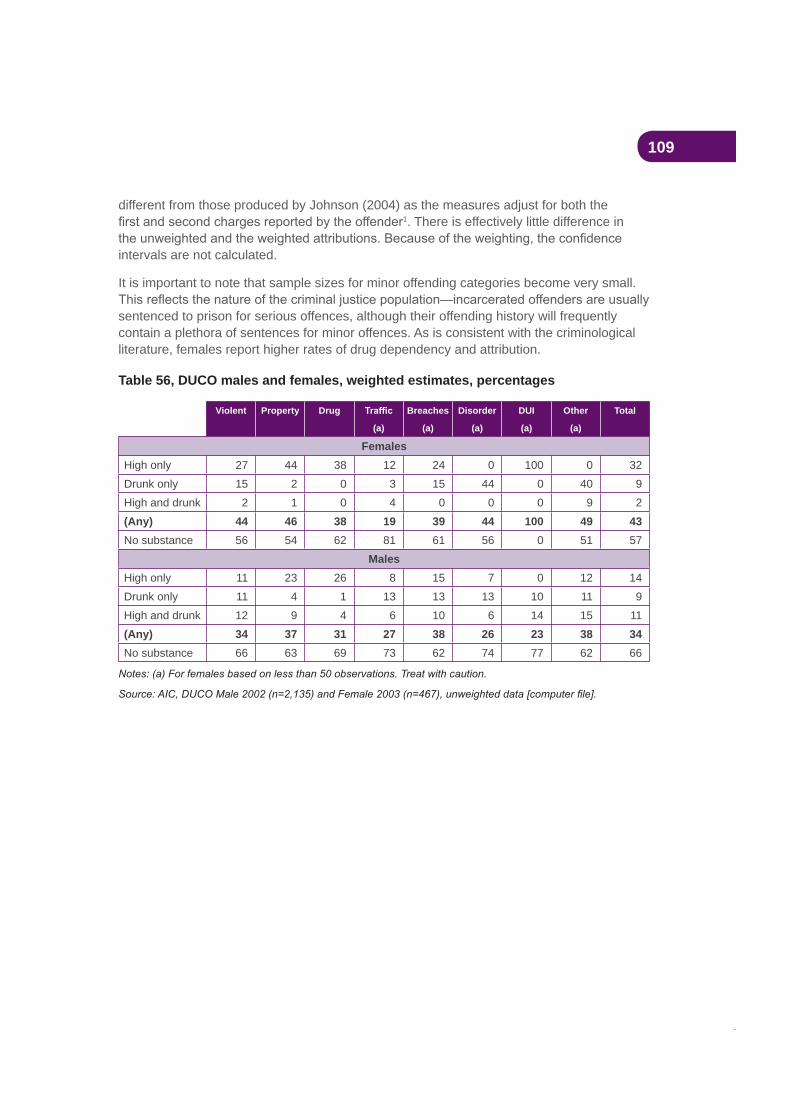
109
different from those produced by Johnson (2004) as the measures adjust for both the 1. There is effectively little difference in
intervals are not calculated.
It is important to note that sample sizes for minor offending categories become very small.
sentenced to prison for serious offences, although their offending history will frequently contain a plethora of sentences for minor offences. As is consistent with the criminological literature, females report higher rates of drug dependency and attribution.
Table 56, DUCO males and females, weighted estimates, percentages
Violent Property Drug
(a)
Breaches
(a)
Disorder
(a)
DUI
(a)
Other
(a)
Total
FemalesHigh only 27 44 38 12 24 0 100 0 32Drunk only 15 2 0 3 15 44 0 40 9High and drunk 2 1 0 4 0 0 0 9 2(Any) 44 46 38 19 39 44 100 49 43No substance 56 54 62 81 61 56 0 51 57
MalesHigh only 11 23 26 8 15 7 0 12 14Drunk only 11 4 1 13 13 13 10 11 9High and drunk 12 9 4 6 10 6 14 15 11(Any) 34 37 31 27 38 26 23 38 34No substance 66 63 69 73 62 74 77 62 66
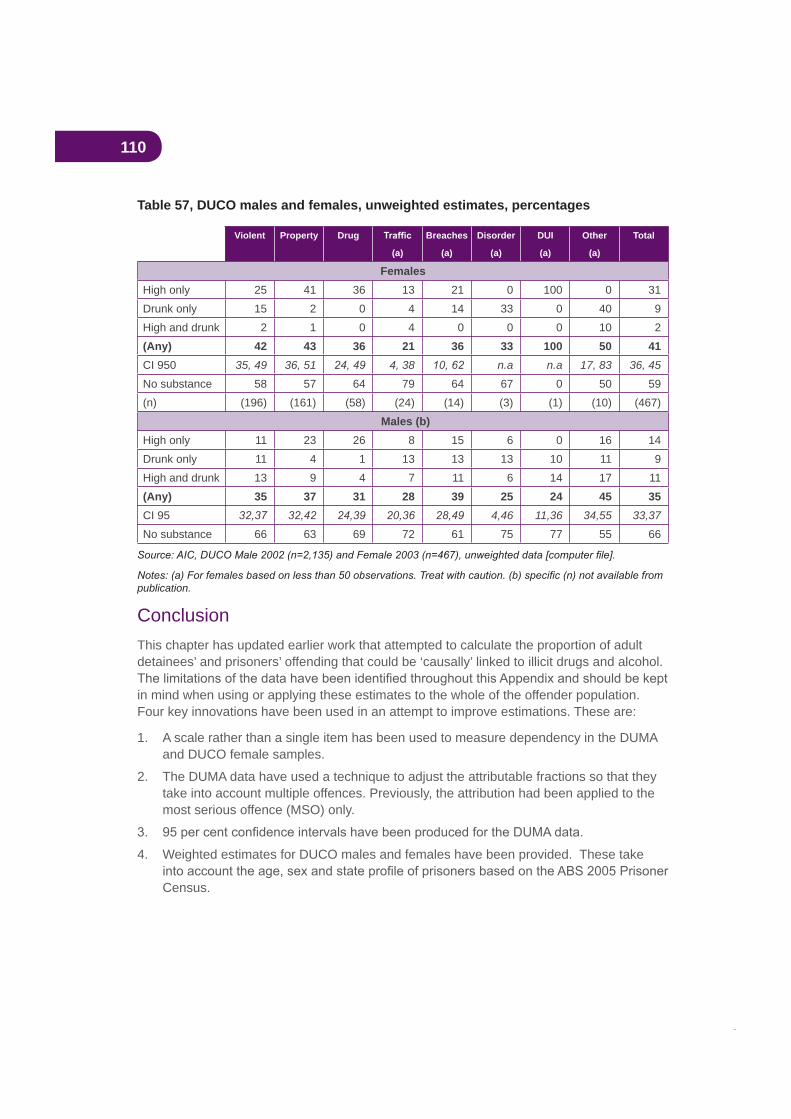
110
Table 57, DUCO males and females, unweighted estimates, percentages
Violent Property Drug
(a)
Breaches
(a)
Disorder
(a)
DUI
(a)
Other
(a)
Total
FemalesHigh only 25 41 36 13 21 0 100 0 31Drunk only 15 2 0 4 14 33 0 40 9High and drunk 2 1 0 4 0 0 0 10 2(Any) 42 43 36 21 36 33 100 50 41CI 950 35, 49 36, 51 4, 38 n.a n.a 17, 83 36, 45
No substance 58 57 64 79 64 67 0 50 59(n) (196) (161) (58) (24) (14) (3) (1) (10) (467)
Males (b)High only 11 23 26 8 15 6 0 16 14Drunk only 11 4 1 13 13 13 10 11 9High and drunk 13 9 4 7 11 6 14 17 11(Any) 35 37 31 28 39 25 24 45 35CI 95 4,46 11,36 34,55 33,37
No substance 66 63 69 72 61 75 77 55 66
publication.
ConclusionThis chapter has updated earlier work that attempted to calculate the proportion of adult detainees’ and prisoners’ offending that could be ‘causally’ linked to illicit drugs and alcohol.
in mind when using or applying these estimates to the whole of the offender population. Four key innovations have been used in an attempt to improve estimations. These are:
1. A scale rather than a single item has been used to measure dependency in the DUMA and DUCO female samples.
2. The DUMA data have used a technique to adjust the attributable fractions so that they take into account multiple offences. Previously, the attribution had been applied to the most serious offence (MSO) only.
4. Weighted estimates for DUCO males and females have been provided. These take
Census.
111
Overall, the estimates range from 41 per cent to 51 per cent for police detainees with
This is consistent with the DUMA estimates derived in 2002. When adjustments are made for multiple offences, the estimates increase slightly from a range of 47 to 57 per cent. For DUCO females 43 per cent are estimated to have committed their most serious offence because of substance abuse and for males the estimate is 34 per cent. There is far less variability across offending types than occurs for the DUMA sample.
112
ReferencesCarcach, C. (1997), ‘Reporting crime to the police’, Trends and Issues in Crime and Criminal Justice, no 68, Australian Institute of Criminology, Canberra.
Carcach, C. and Makkai, T. (2002), , Report to the Chief Commissioner, Victoria Police, October.
Committee on Data and Research for Policy on Illegal Drugs (2001), , Committee on Law and
Justice and Committee on National Statistics, National Research Council.
Dalrymple, Theodore (2006), bureaucracy, New York: Encounter Books.
Davies, John Booth (1992), , Harwood Academic Publishers.
Ghodse, Hamid (1995), , second edition, University Press, Cambridge.
Harrison, L. and Hughes, A. (eds.) (1997), , US Department of Health and Human
Services, National Institutes of Health, NIDA Research Monograph 167.
Hoffman, M., Hunt, D., Rhodes, W., and Riley, J. (2003), ‘UNCOPE: A brief substance dependence screen for use with arrestees’, , vol.33, 29-44.
Johnson, Holly (2004), ‘Drugs and Crime: A study of incarcerated female offenders’, , No 63, Canberra: Australian Institute of Criminology.
Makkai, T. and Payne, J. (2003), ‘Drugs and Crime: A study of incarcerated male offenders’ , No 52, Canberra: Australian Institute of Criminology.
Makkai, Toni and McGregor, Kiah, (2002), ‘Drugs and crime: calculating attributable fractions from the DUMA project’ in David Collins and Helen Lapsley (2002), Counting
, Canberra: Commonwealth Department of Health and Ageing.
Makkai, T., Radcliffe, J., Veraar, K., and Collins, L. (2004), ‘ACT Recidivist Offenders’, , 54, Canberra: Australian Institute of Criminology.
Makkai, Toni (1999), ‘Linking Drugs and Criminal Activity: Developing an Integrated Monitoring System’, Trends & Issues in Crime and Criminal Justice, No. 109, Canberra: Australian Institute of Criminology.
Makkai, Toni (2002), ‘Illicit Drugs and Crime’, in Graycar, Adam and Grabosky, Peter (eds.) (2002), , Cambridge University Press.
McGregor, K. and Makkai, T. (2003),’Self-reported drug use: how prevalent is under-Trends and Issues in Crime and Justice, No. 260, Canberra: Australian Institute
of Criminology.

113
Mouzos, Jenny; Smith, Lance; and Hind, Natalie (2006), ‘Drug Use Monitoring in Australia (DUMA): 2005 Annual Report on Drug Use Among Police Detainees’, Policy Series, No 70, Canberra: Australian Institute of Criminology.
Pernanen, K; Cousineau, M.; Brochu, S.; and Sun, F. (2002), Proportions of crimes associated with alcohol and other drugs in Canada, Toronto: Canadian Centre on Substance Abuse.
Posyer, Carmel; Makkai, Toni; Norman, Louise; and Mills, Leesa (2002), , Report to the National Drug Law
Enforcement Research Fund, April.
Williams, Paul (2002), ‘Aetiological fraction estimates of drug-related crime’, in David Collins and Helen Lapsley (2002),
Canberra: Commonwealth Department of Health and Ageing.
114
Appendix C, Estimation of drug-attributable casesThis appendix was written by Associate Professor Jim Codde, School of Population Health, University of Western Australia.
Population dataAustralian estimated resident population data for June 2004 used to calculate the drug-caused mortality rates shown in this report were obtained from the Australian Bureau of Statistics (ABS) publication Population by Age and Sex, Australian States and Territories,
(3201.0).
Mortality dataUnit record level national mortality data for 2004 were obtained from ABS,
(3302.0). The total number of deaths registered in that year was 132,508. The causes of death for this data were coded using ICD-10. Alcohol-caused and tobacco-caused deaths were determined on the basis of the major cause of death codes but for many illicit drug-
drug involved if possible.
Morbidity data
occurred in Australia between 1 July 2004 and 30 June 2005 were obtained from the Australian Institute of Health and Welfare (AIHW) after receiving permission from all states and territories. All of the 7 million records were coded to ICD-10-AM (Third Edition) and grouped to ANDRG Version 4.2. Approximate cost of hospitalisation due to drug abuse was determined from the ANDRGs and the National Hospital Costing Data (Round 8, ANDRG 4.2) produced by the Commonwealth Department of Health and Ageing2.
Estimation of drug-attributable casesConditions and diseases attributed to drug use are shown in Table 58 to Table 60 inclusive. Drug attributed cases were determined by multiplying these cases with an age-, sex- and
based on the original work of English et al. (1995)3 and subsequently updated by Ridolfo and Stevenson (2001)4. While, on the whole, the relative risks of diseases associated with drug usage remained the same, for some diseases the aetiologic fractions in these two reports differed due to the use of more current drug usage prevalence data (1989 and 1995 respectively). For the purpose of this report, it was decided to update the aetiologic fractions once more where possible using even more current prevalence information. Furthermore, there was a desire to link more closely with the Australian Burden of Disease (ABOD) work being undertaken by the University of Queensland and the Australian Government Department of Health and Ageing.

115
As such, a revised list of drug-related diseases and many of the aetiologic fractions cited in this report were based on a recent publication on the burden of disease and injury in Australia5. Due to a different focus, some drug-caused conditions were grouped into a broader category in the ABOD report. For the purposes of the current study, these diseases
comparison with the work of English et al. (1995) and Ridolfo and Stevenson (2001).
On the whole, the alcohol aetiologic fractions derived for the ABOD report (Begg et al., 2007) were based on prevalence information from the 2001 National Health Survey6
categorized into the four levels used by English et al., Ridolfo and Stevenson and the NHMRC’s recommendations on alcohol consumption. The relative risks and population attributable fractions were largely drawn from Ridolfo and Stevenson’s report. Due to the long lag time between exposure to tobacco smoke and the occurrence of cancer and chronic respiratory diseases, the proportion of disease attributable to smoking cannot be determined from current smoking prevalence. Consequently Begg et al. used a variety of techniques as outlined in their report. Similarly, determination of the aetiologic fractions associated with illicit drug use was based on a number of data sources that included the 2004 National Drug Strategy Household Survey7 and National Centre in HIV Epidemiology and Clinical Research8.
or derived from the ABOD report or personal communications with the authors. Using these aetiologic fractions, the number of cases attributable to drug usage was determined. Based on the derived fraction of cases, the number of potential years of life lost was estimated from death data using the method of Hakulinen and Teppo (1976)9. Similarly, the drug-caused fraction of hospital separations, bed days and hospital costs were determined from
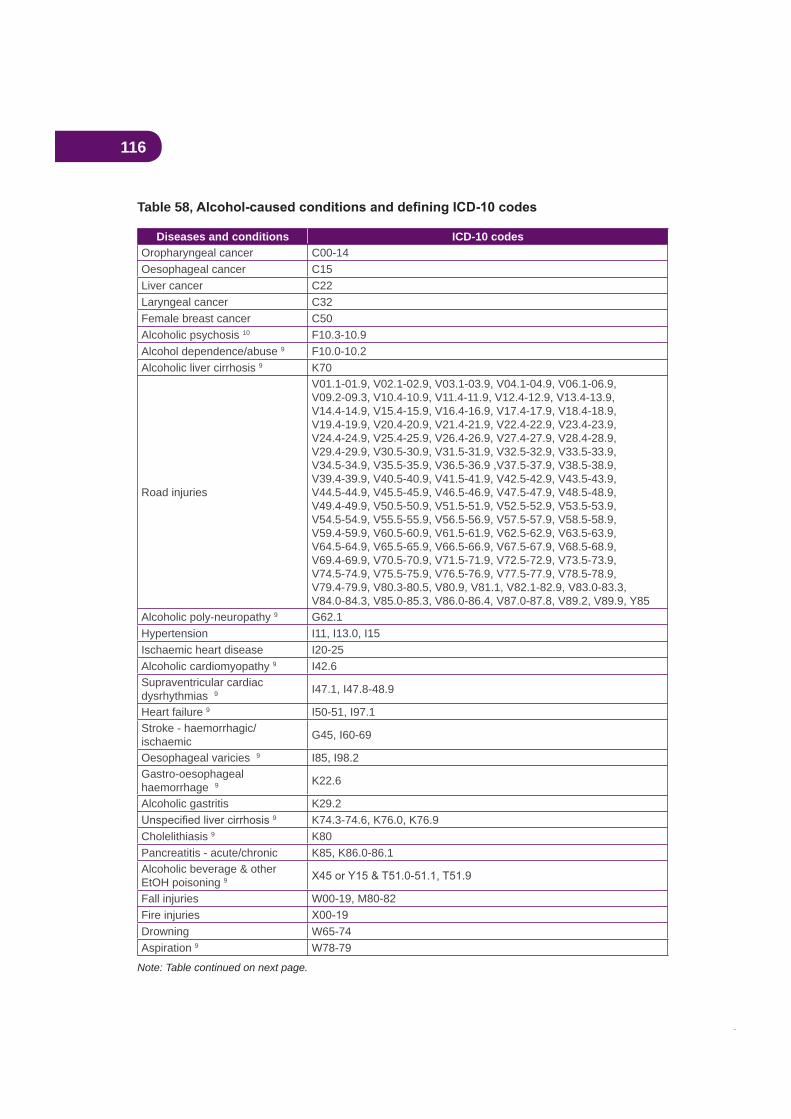
116
Table 58
Diseases and conditions ICD-10 codesOropharyngeal cancer C00-14Oesophageal cancer C15Liver cancer C22Laryngeal cancer C32Female breast cancer C50Alcoholic psychosis 10 F10.3-10.9Alcohol dependence/abuse 9 F10.0-10.2Alcoholic liver cirrhosis 9 K70
Road injuries
V01.1-01.9, V02.1-02.9, V03.1-03.9, V04.1-04.9, V06.1-06.9, V09.2-09.3, V10.4-10.9, V11.4-11.9, V12.4-12.9, V13.4-13.9, V14.4-14.9, V15.4-15.9, V16.4-16.9, V17.4-17.9, V18.4-18.9, V19.4-19.9, V20.4-20.9, V21.4-21.9, V22.4-22.9, V23.4-23.9, V24.4-24.9, V25.4-25.9, V26.4-26.9, V27.4-27.9, V28.4-28.9, V29.4-29.9, V30.5-30.9, V31.5-31.9, V32.5-32.9, V33.5-33.9, V34.5-34.9, V35.5-35.9, V36.5-36.9 ,V37.5-37.9, V38.5-38.9, V39.4-39.9, V40.5-40.9, V41.5-41.9, V42.5-42.9, V43.5-43.9, V44.5-44.9, V45.5-45.9, V46.5-46.9, V47.5-47.9, V48.5-48.9, V49.4-49.9, V50.5-50.9, V51.5-51.9, V52.5-52.9, V53.5-53.9, V54.5-54.9, V55.5-55.9, V56.5-56.9, V57.5-57.9, V58.5-58.9, V59.4-59.9, V60.5-60.9, V61.5-61.9, V62.5-62.9, V63.5-63.9, V64.5-64.9, V65.5-65.9, V66.5-66.9, V67.5-67.9, V68.5-68.9, V69.4-69.9, V70.5-70.9, V71.5-71.9, V72.5-72.9, V73.5-73.9, V74.5-74.9, V75.5-75.9, V76.5-76.9, V77.5-77.9, V78.5-78.9, V79.4-79.9, V80.3-80.5, V80.9, V81.1, V82.1-82.9, V83.0-83.3, V84.0-84.3, V85.0-85.3, V86.0-86.4, V87.0-87.8, V89.2, V89.9, Y85
Alcoholic poly-neuropathy 9 G62.1Hypertension I11, I13.0, I15Ischaemic heart disease I20-25Alcoholic cardiomyopathy 9 I42.6Supraventricular cardiac dysrhythmias 9 I47.1, I47.8-48.9
Heart failure 9 I50-51, I97.1Stroke - haemorrhagic/ischaemic G45, I60-69
Oesophageal varicies 9 I85, I98.2Gastro-oesophagealhaemorrhage 9 K22.6
Alcoholic gastritis K29.29 K74.3-74.6, K76.0, K76.9
Cholelithiasis 9 K80Pancreatitis - acute/chronic K85, K86.0-86.1Alcoholic beverage & other EtOH poisoning 9
Fall injuries W00-19, M80-82Fire injuriesDrowning W65-74Aspiration 9 W78-79
Note: Table continued on next page.
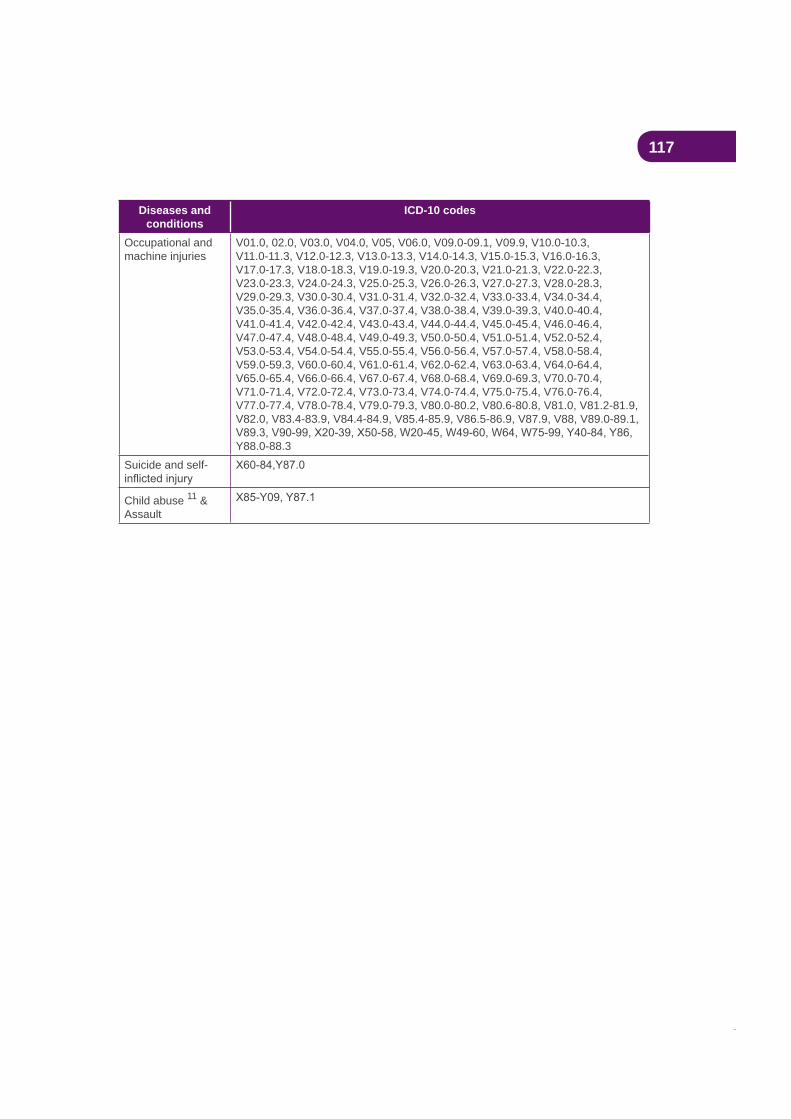
117
Diseases and conditions
ICD-10 codes
Occupational and machine injuries
V01.0, 02.0, V03.0, V04.0, V05, V06.0, V09.0-09.1, V09.9, V10.0-10.3, V11.0-11.3, V12.0-12.3, V13.0-13.3, V14.0-14.3, V15.0-15.3, V16.0-16.3, V17.0-17.3, V18.0-18.3, V19.0-19.3, V20.0-20.3, V21.0-21.3, V22.0-22.3, V23.0-23.3, V24.0-24.3, V25.0-25.3, V26.0-26.3, V27.0-27.3, V28.0-28.3, V29.0-29.3, V30.0-30.4, V31.0-31.4, V32.0-32.4, V33.0-33.4, V34.0-34.4, V35.0-35.4, V36.0-36.4, V37.0-37.4, V38.0-38.4, V39.0-39.3, V40.0-40.4, V41.0-41.4, V42.0-42.4, V43.0-43.4, V44.0-44.4, V45.0-45.4, V46.0-46.4, V47.0-47.4, V48.0-48.4, V49.0-49.3, V50.0-50.4, V51.0-51.4, V52.0-52.4, V53.0-53.4, V54.0-54.4, V55.0-55.4, V56.0-56.4, V57.0-57.4, V58.0-58.4, V59.0-59.3, V60.0-60.4, V61.0-61.4, V62.0-62.4, V63.0-63.4, V64.0-64.4, V65.0-65.4, V66.0-66.4, V67.0-67.4, V68.0-68.4, V69.0-69.3, V70.0-70.4, V71.0-71.4, V72.0-72.4, V73.0-73.4, V74.0-74.4, V75.0-75.4, V76.0-76.4, V77.0-77.4, V78.0-78.4, V79.0-79.3, V80.0-80.2, V80.6-80.8, V81.0, V81.2-81.9, V82.0, V83.4-83.9, V84.4-84.9, V85.4-85.9, V86.5-86.9, V87.9, V88, V89.0-89.1,
Y88.0-88.3Suicide and self-
Child abuse 11 & Assault

118
Table 59
Diseases and conditions ICD-10 codesOropharyngeal cancer C00-14Oesophageal cancer C15Stomach cancer C16Pancreatic cancer C25Laryngeal cancer C32Lung cancer C33-34Cervical cancer 12 C53, D06Endometrial cancer (protective) C54Bladder cancer C67Kidney cancer C64-66, C68Ischaemic heart disease I20-25Chronic obstructive pulmonary disease J40-44Tobacco abuse 13 F17, T65.2, Z72.0Parkinson’s disease (protective) G20-21Pulmonary circulation disease 12 I26.0, I27-28Cardiac dysrhythmias 12 I46-49Heart failure 12 I50-51, I97.1Stroke I60-69, G45Peripheral vascular disease I70.0-I70.8, I72-74Lower respiratory tract infection J10-13, J15-18, J20.0, J20.2-20.9, J21-22Crohn’s disease K50Ulcerative colitis K51Antepartum haemorrhage 11 O20, O44.1, O45-46, P02.0-02.1Low birthweight P05-07, P22SIDS R95Fire injuriesAsthma (under 15 years) J45-46Macular degeneration 14 H35.3-52.4Otitis media 13 H65-66
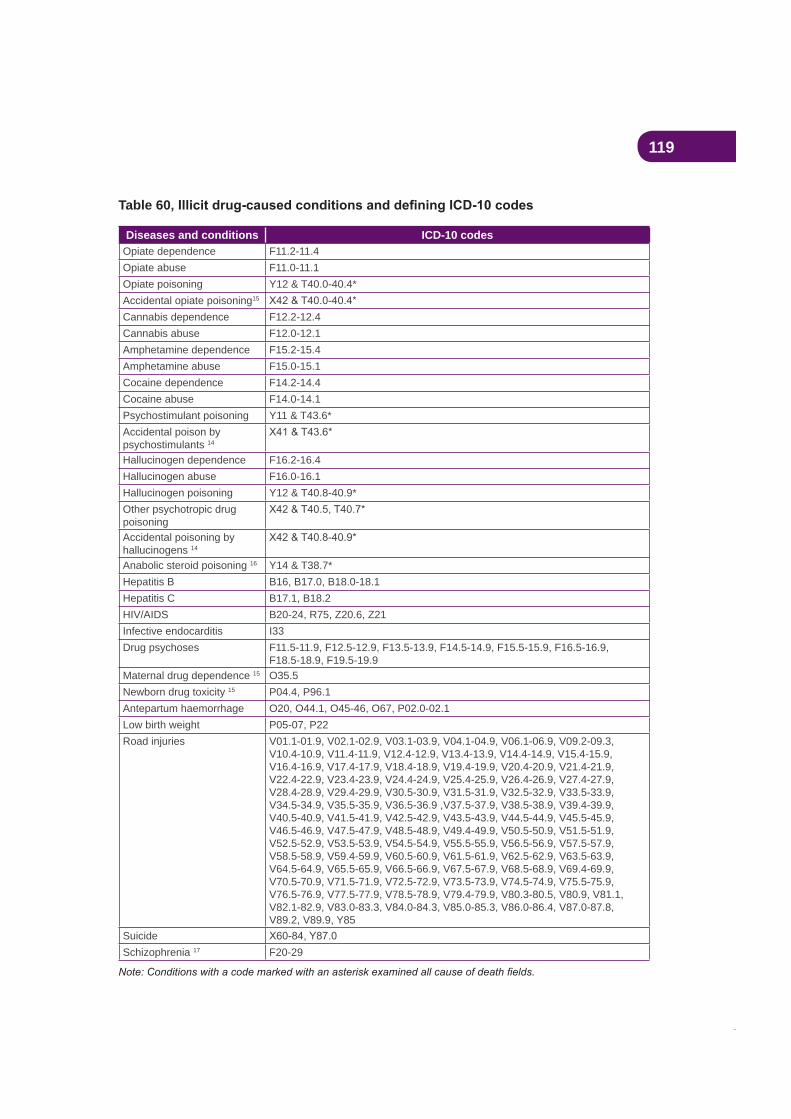
119
Table 60
Diseases and conditions ICD-10 codesOpiate dependence F11.2-11.4Opiate abuse F11.0-11.1Opiate poisoning Y12 & T40.0-40.4*Accidental opiate poisoning15
Cannabis dependence F12.2-12.4Cannabis abuse F12.0-12.1Amphetamine dependence F15.2-15.4Amphetamine abuse F15.0-15.1Cocaine dependence F14.2-14.4Cocaine abuse F14.0-14.1Psychostimulant poisoning Y11 & T43.6*Accidental poison by psychostimulants 14
Hallucinogen dependence F16.2-16.4Hallucinogen abuse F16.0-16.1Hallucinogen poisoning Y12 & T40.8-40.9*Other psychotropic drug poisoningAccidental poisoning by hallucinogens 14
Anabolic steroid poisoning 16 Y14 & T38.7*Hepatitis B B16, B17.0, B18.0-18.1Hepatitis C B17.1, B18.2HIV/AIDS B20-24, R75, Z20.6, Z21Infective endocarditis I33Drug psychoses F11.5-11.9, F12.5-12.9, F13.5-13.9, F14.5-14.9, F15.5-15.9, F16.5-16.9,
F18.5-18.9, F19.5-19.9Maternal drug dependence 15 O35.5Newborn drug toxicity 15 P04.4, P96.1Antepartum haemorrhage O20, O44.1, O45-46, O67, P02.0-02.1Low birth weight P05-07, P22Road injuries V01.1-01.9, V02.1-02.9, V03.1-03.9, V04.1-04.9, V06.1-06.9, V09.2-09.3,
V10.4-10.9, V11.4-11.9, V12.4-12.9, V13.4-13.9, V14.4-14.9, V15.4-15.9, V16.4-16.9, V17.4-17.9, V18.4-18.9, V19.4-19.9, V20.4-20.9, V21.4-21.9, V22.4-22.9, V23.4-23.9, V24.4-24.9, V25.4-25.9, V26.4-26.9, V27.4-27.9, V28.4-28.9, V29.4-29.9, V30.5-30.9, V31.5-31.9, V32.5-32.9, V33.5-33.9, V34.5-34.9, V35.5-35.9, V36.5-36.9 ,V37.5-37.9, V38.5-38.9, V39.4-39.9, V40.5-40.9, V41.5-41.9, V42.5-42.9, V43.5-43.9, V44.5-44.9, V45.5-45.9, V46.5-46.9, V47.5-47.9, V48.5-48.9, V49.4-49.9, V50.5-50.9, V51.5-51.9, V52.5-52.9, V53.5-53.9, V54.5-54.9, V55.5-55.9, V56.5-56.9, V57.5-57.9, V58.5-58.9, V59.4-59.9, V60.5-60.9, V61.5-61.9, V62.5-62.9, V63.5-63.9, V64.5-64.9, V65.5-65.9, V66.5-66.9, V67.5-67.9, V68.5-68.9, V69.4-69.9, V70.5-70.9, V71.5-71.9, V72.5-72.9, V73.5-73.9, V74.5-74.9, V75.5-75.9, V76.5-76.9, V77.5-77.9, V78.5-78.9, V79.4-79.9, V80.3-80.5, V80.9, V81.1, V82.1-82.9, V83.0-83.3, V84.0-84.3, V85.0-85.3, V86.0-86.4, V87.0-87.8, V89.2, V89.9, Y85
SuicideSchizophrenia 17 F20-29
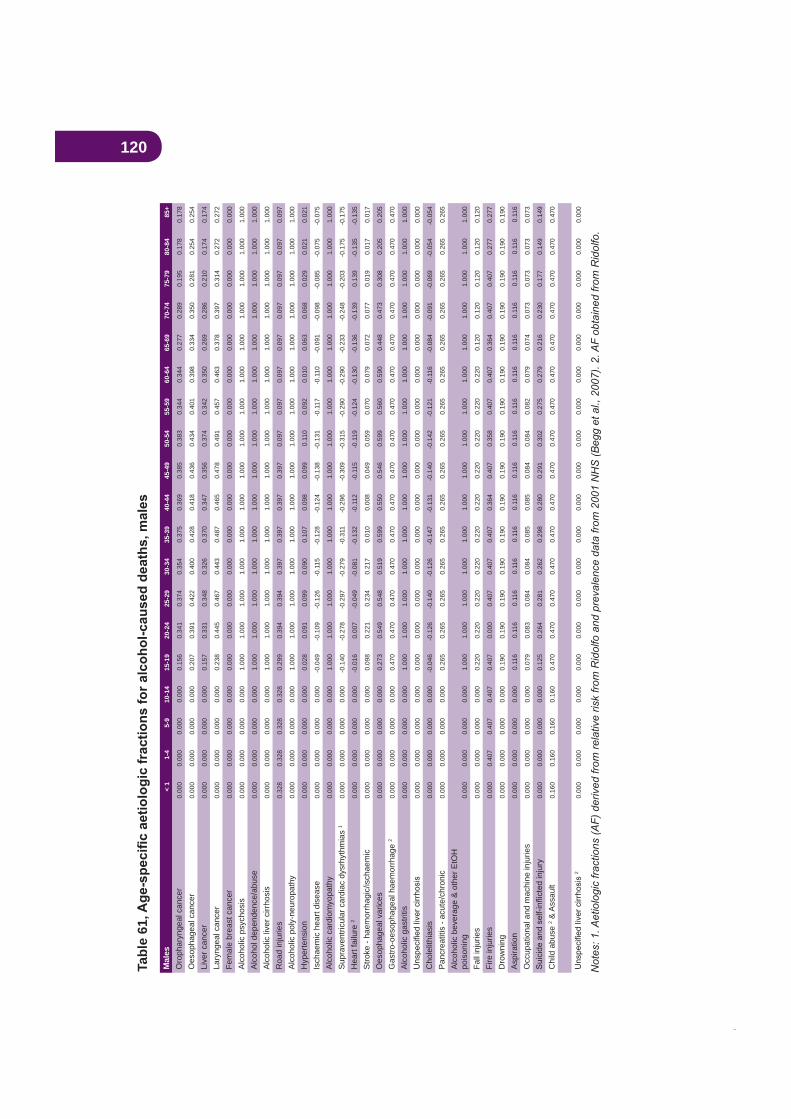
120Ta
ble
61M
ales
< 1
1-4
5-9
10-1
415
-19
20-2
425
-29
30-3
435
-39
40-4
445
-49
50-5
455
-59
60-6
465
-69
70-7
475
-79
80-8
485
+
Oro
phar
ynge
al c
ance
r0.
000
0.00
00.
000
0.00
00.
156
0.34
10.
374
0.35
40.
375
0.36
90.
385
0.38
30.
344
0.34
40.
277
0.28
90.
195
0.17
80.
178
Oes
opha
geal
can
cer
0.00
00.
000
0.00
00.
000
0.20
70.
391
0.42
20.
400
0.42
80.
418
0.43
60.
434
0.40
10.
398
0.33
40.
350
0.28
10.
254
0.25
4
Live
r can
cer
0.00
00.
000
0.00
00.
000
0.15
70.
331
0.34
80.
326
0.37
00.
347
0.35
60.
374
0.34
20.
350
0.26
90.
286
0.21
00.
174
0.17
4
Lary
ngea
l can
cer
0.00
00.
000
0.00
00.
000
0.23
80.
445
0.46
70.
443
0.48
70.
465
0.47
80.
491
0.45
70.
463
0.37
80.
397
0.31
40.
272
0.27
2
Fem
ale
brea
st c
ance
r0.
000
0.00
00.
000
0.00
00.
000
0.00
00.
000
0.00
00.
000
0.00
00.
000
0.00
00.
000
0.00
00.
000
0.00
00.
000
0.00
00.
000
Alc
ohol
ic p
sych
osis
0.00
00.
000
0.00
00.
000
1.00
01.
000
1.00
01.
000
1.00
01.
000
1.00
01.
000
1.00
01.
000
1.00
01.
000
1.00
01.
000
1.00
0
Alc
ohol
dep
ende
nce/
abus
e0.
000
0.00
00.
000
0.00
01.
000
1.00
01.
000
1.00
01.
000
1.00
01.
000
1.00
01.
000
1.00
01.
000
1.00
01.
000
1.00
01.
000
Alc
ohol
ic li
ver c
irrho
sis
0.00
00.
000
0.00
00.
000
1.00
01.
000
1.00
01.
000
1.00
01.
000
1.00
01.
000
1.00
01.
000
1.00
01.
000
1.00
01.
000
1.00
0
Roa
d in
jurie
s0.
328
0.32
80.
328
0.32
80.
299
0.39
40.
394
0.39
70.
397
0.39
70.
397
0.09
70.
097
0.09
70.
097
0.09
70.
097
0.09
70.
097
Alc
ohol
ic p
oly-
neur
opat
hy0.
000
0.00
00.
000
0.00
01.
000
1.00
01.
000
1.00
01.
000
1.00
01.
000
1.00
01.
000
1.00
01.
000
1.00
01.
000
1.00
01.
000
Hyp
erte
nsio
n0.
000
0.00
00.
000
0.00
00.
028
0.09
10.
099
0.09
00.
107
0.09
80.
099
0.11
00.
092
0.01
00.
063
0.06
80.
029
0.02
10.
021
Isch
aem
ic h
eart
dise
ase
0.00
00.
000
0.00
00.
000
-0.0
49-0
.109
-0.1
26-0
.115
-0.1
28-0
.124
-0.1
38-0
.131
-0.1
17-0
.110
-0.0
91-0
.098
-0.0
85-0
.075
-0.0
75
Alc
ohol
ic c
ardi
omyo
path
y0.
000
0.00
00.
000
0.00
01.
000
1.00
01.
000
1.00
01.
000
1.00
01.
000
1.00
01.
000
1.00
01.
000
1.00
01.
000
1.00
01.
000
Sup
rave
ntric
ular
car
diac
dys
rhyt
hmia
s 1
0.00
00.
000
0.00
00.
000
-0.1
40-0
.278
-0.2
97-0
.279
-0.3
11-0
.296
-0.3
09-0
.315
-0.2
90-0
.290
-0.2
33-0
.248
-0.2
03-0
.175
-0.1
75
Hea
rt fa
ilure
20.
000
0.00
00.
000
0.00
0-0
.016
0.00
7-0
.049
-0.0
81-0
.132
-0.1
12-0
.115
-0.1
19-0
.124
-0.1
30-0
.136
-0.1
390.
139
-0.1
35-0
.135
Stro
ke -
haem
orrh
agic
/isch
aem
ic0.
000
0.00
00.
000
0.00
00.
098
0.22
10.
234
0.21
70.
010
0.00
80.
049
0.05
90.
070
0.07
90.
072
0.07
70.
019
0.01
70.
017
Oes
opha
geal
var
ices
0.00
00.
000
0.00
00.
000
0.27
30.
549
0.54
80.
519
0.59
90.
550
0.54
60.
599
0.56
00.
590
0.44
80.
473
0.30
80.
205
0.20
5
Gas
tro-o
esop
hage
al h
aem
orrh
age
20.
000
0.00
00.
000
0.00
00.
470
0.47
00.
470
0.47
00.
470
0.47
00.
470
0.47
00.
470
0.47
00.
470
0.47
00.
470
0.47
00.
470
Alc
ohol
ic g
astri
tis0.
000
0.00
00.
000
0.00
01.
000
1.00
01.
000
1.00
01.
000
1.00
01.
000
1.00
01.
000
1.00
01.
000
1.00
01.
000
1.00
01.
000
0.00
00.
000
0.00
00.
000
0.00
00.
000
0.00
00.
000
0.00
00.
000
0.00
00.
000
0.00
00.
000
0.00
00.
000
0.00
00.
000
0.00
0
Cho
lelit
hias
is0.
000
0.00
00.
000
0.00
0-0
.046
-0.1
26-0
.140
-0.1
26-0
.147
-0.1
31-0
.140
-0.1
42-0
.121
-0.1
16-0
.084
-0.0
91-0
.069
-0.0
54-0
.054
Pan
crea
titis
- ac
ute/
chro
nic
0.00
00.
000
0.00
00.
000
0.26
50.
265
0.26
50.
265
0.26
50.
265
0.26
50.
265
0.26
50.
265
0.26
50.
265
0.26
50.
265
0.26
5
Alc
ohol
ic b
ever
age
& o
ther
EtO
H
pois
onin
g0.
000
0.00
00.
000
0.00
01.
000
1.00
01.
000
1.00
01.
000
1.00
01.
000
1.00
01.
000
1.00
01.
000
1.00
01.
000
1.00
01.
000
Fall
inju
ries
0.00
00.
000
0.00
00.
000
0.22
00.
220
0.22
00.
220
0.22
00.
220
0.22
00.
220
0.22
00.
220
0.12
00.
120
0.12
00.
120
0.12
0
Fire
inju
ries
0.00
00.
407
0.40
70.
407
0.40
70.
000
0.40
70.
407
0.40
70.
364
0.40
70.
358
0.40
70.
407
0.36
40.
407
0.40
70.
277
0.27
7
Dro
wni
ng0.
000
0.00
00.
000
0.00
00.
190
0.19
00.
190
0.19
00.
190
0.19
00.
190
0.19
00.
190
0.19
00.
190
0.19
00.
190
0.19
00.
190
Asp
iratio
n0.
000
0.00
00.
000
0.00
00.
116
0.11
60.
116
0.11
60.
116
0.11
60.
116
0.11
60.
116
0.11
60.
116
0.11
60.
116
0.11
60.
116
Occ
upat
iona
l and
mac
hine
inju
ries
0.00
00.
000
0.00
00.
000
0.07
90.
083
0.08
40.
084
0.08
50.
085
0.08
40.
084
0.08
20.
079
0.07
40.
073
0.07
30.
073
0.07
3
0.00
00.
000
0.00
00.
000
0.12
50.
264
0.28
10.
262
0.29
80.
280
0.29
10.
302
0.27
50.
279
0.21
60.
230
0.17
70.
149
0.14
9
Chi
ld a
buse
2 & A
ssau
lt0.
160
0.16
00.
160
0.16
00.
470
0.47
00.
470
0.47
00.
470
0.47
00.
470
0.47
00.
470
0.47
00.
470
0.47
00.
470
0.47
00.
470
20.
000
0.00
00.
000
0.00
00.
000
0.00
00.
000
0.00
00.
000
0.00
00.
000
0.00
00.
000
0.00
00.
000
0.00
00.
000
0.00
00.
000
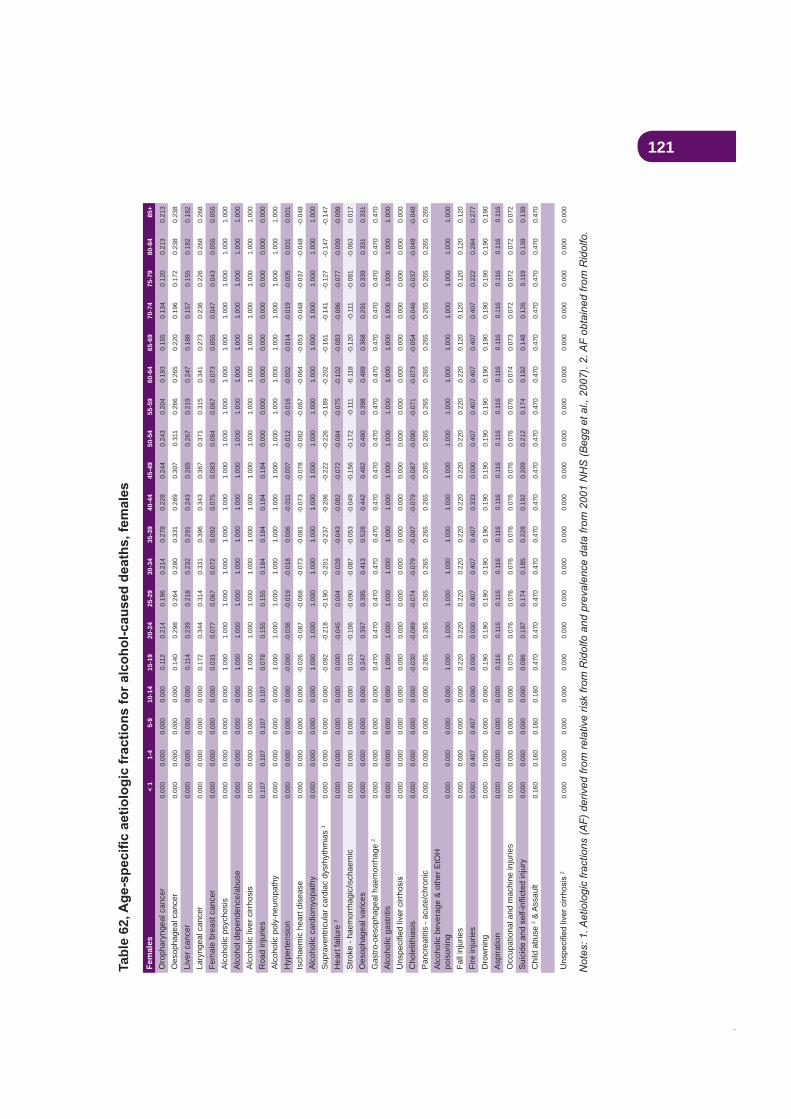
121Ta
ble
62
Fem
ales
< 1
1-4
5-9
10-1
415
-19
20-2
425
-29
30-3
435
-39
40-4
445
-49
50-5
455
-59
60-6
465
-69
70-7
475
-79
80-8
485
+
Oro
phar
ynge
al c
ance
r0.
000
0.00
00.
000
0.00
00.
112
0.21
40.
196
0.21
40.
278
0.22
80.
244
0.24
30.
204
0.19
30.
155
0.13
40.
120
0.21
30.
213
Oes
opha
geal
can
cer
0.00
00.
000
0.00
00.
000
0.14
00.
298
0.26
40.
280
0.33
10.
289
0.30
70.
311
0.26
60.
265
0.22
00.
196
0.17
20.
238
0.23
8
Live
r can
cer
0.00
00.
000
0.00
00.
000
0.11
40.
239
0.21
80.
232
0.29
10.
243
0.26
50.
267
0.21
90.
247
0.18
80.
157
0.15
50.
182
0.18
2
Lary
ngea
l can
cer
0.00
00.
000
0.00
00.
000
0.17
20.
344
0.31
40.
331
0.39
60.
343
0.36
70.
371
0.31
50.
341
0.27
30.
236
0.22
60.
268
0.26
8
Fem
ale
brea
st c
ance
r0.
000
0.00
00.
000
0.00
00.
031
0.07
70.
067
0.07
20.
092
0.07
50.
083
0.08
40.
067
0.07
30.
055
0.04
70.
043
0.05
50.
055
Alc
ohol
ic p
sych
osis
0.00
00.
000
0.00
00.
000
1.00
01.
000
1.00
01.
000
1.00
01.
000
1.00
01.
000
1.00
01.
000
1.00
01.
000
1.00
01.
000
1.00
0
Alc
ohol
dep
ende
nce/
abus
e0.
000
0.00
00.
000
0.00
01.
000
1.00
01.
000
1.00
01.
000
1.00
01.
000
1.00
01.
000
1.00
01.
000
1.00
01.
000
1.00
01.
000
Alc
ohol
ic li
ver c
irrho
sis
0.00
00.
000
0.00
00.
000
1.00
01.
000
1.00
01.
000
1.00
01.
000
1.00
01.
000
1.00
01.
000
1.00
01.
000
1.00
01.
000
1.00
0
Roa
d in
jurie
s0.
107
0.10
70.
107
0.10
70.
078
0.15
50.
155
0.18
40.
184
0.18
40.
184
0.00
00.
000
0.00
00.
000
0.00
00.
000
0.00
00.
000
Alc
ohol
ic p
oly-
neur
opat
hy0.
000
0.00
00.
000
0.00
01.
000
1.00
01.
000
1.00
01.
000
1.00
01.
000
1.00
01.
000
1.00
01.
000
1.00
01.
000
1.00
01.
000
Hyp
erte
nsio
n0.
000
0.00
00.
000
0.00
0-0
.000
-0.0
36-0
.019
-0.0
180.
006
-0.0
11-0
.007
-0.0
12-0
.016
-0.0
02-0
.014
-0.0
19-0
.005
0.00
10.
001
Isch
aem
ic h
eart
dise
ase
0.00
00.
000
0.00
00.
000
-0.0
26-0
.087
-0.0
68-0
.073
-0.0
81-0
.073
-0.0
78-0
.082
-0.0
67-0
.064
-0.0
53-0
.048
-0.0
37-0
.048
-0.0
48
Alc
ohol
ic c
ardi
omyo
path
y0.
000
0.00
00.
000
0.00
01.
000
1.00
01.
000
1.00
01.
000
1.00
01.
000
1.00
01.
000
1.00
01.
000
1.00
01.
000
1.00
01.
000
Sup
rave
ntric
ular
car
diac
dys
rhyt
hmia
s 1
0.00
00.
000
0.00
00.
000
-0.0
92-0
.218
-0.1
90-0
.201
-0.2
37-0
.206
-0.2
22-0
.226
-0.1
89-0
.202
-0.1
61-0
.141
-0.1
27-0
.147
-0.1
47
Hea
rt fa
ilure
20.
000
0.00
00.
000
0.00
00.
000
-0.0
450.
004
0.02
8-0
.043
-0.0
82-0
.072
-0.0
84-0
.075
-0.1
02-0
.083
-0.0
86-0
.077
-0.0
99-0
.099
Stro
ke -
haem
orrh
agic
/isch
aem
ic0.
000
0.00
00.
000
0.00
00.
033
-0.1
06-0
.090
-0.0
87-0
.053
-0.0
49-0
.156
-0.1
72-0
.111
-0.1
18-0
.120
-0.1
11-0
.081
-0.0
630.
017
Oes
opha
geal
var
ices
0.00
00.
000
0.00
00.
000
0.24
70.
397
0.39
50.
413
0.52
80.
442
0.48
20.
480
0.39
80.
489
0.36
80.
291
0.33
90.
331
0.33
1
Gas
tro-o
esop
hage
al h
aem
orrh
age
20.
000
0.00
00.
000
0.00
00.
470
0.47
00.
470
0.47
00.
470
0.47
00.
470
0.47
00.
470
0.47
00.
470
0.47
00.
470
0.47
00.
470
Alc
ohol
ic g
astri
tis0.
000
0.00
00.
000
0.00
01.
000
1.00
01.
000
1.00
01.
000
1.00
01.
000
1.00
01.
000
1.00
01.
000
1.00
01.
000
1.00
01.
000
0.00
00.
000
0.00
00.
000
0.00
00.
000
0.00
00.
000
0.00
00.
000
0.00
00.
000
0.00
00.
000
0.00
00.
000
0.00
00.
000
0.00
0
Cho
lelit
hias
is0.
000
0.00
00.
000
0.00
0-0
.030
-0.0
89-0
.074
-0.0
79-0
.097
-0.0
79-0
.087
-0.0
90-0
.071
-0.0
73-0
.054
-0.0
46-0
.037
-0.0
48-0
.048
Pan
crea
titis
- ac
ute/
chro
nic
0.00
00.
000
0.00
00.
000
0.26
50.
265
0.26
50.
265
0.26
50.
265
0.26
50.
265
0.26
50.
265
0.26
50.
265
0.26
50.
265
0.26
5
Alc
ohol
ic b
ever
age
& o
ther
EtO
H
pois
onin
g0.
000
0.00
00.
000
0.00
01.
000
1.00
01.
000
1.00
01.
000
1.00
01.
000
1.00
01.
000
1.00
01.
000
1.00
01.
000
1.00
01.
000
Fall
inju
ries
0.00
00.
000
0.00
00.
000
0.22
00.
220
0.22
00.
220
0.22
00.
220
0.22
00.
220
0.22
00.
220
0.12
00.
120
0.12
00.
120
0.12
0
Fire
inju
ries
0.00
00.
407
0.40
70.
000
0.00
00.
000
0.40
70.
407
0.40
70.
333
0.00
00.
407
0.40
70.
407
0.40
70.
407
0.22
20.
284
0.27
7
Dro
wni
ng0.
000
0.00
00.
000
0.00
00.
190
0.19
00.
190
0.19
00.
190
0.19
00.
190
0.19
00.
190
0.19
00.
190
0.19
00.
190
0.19
00.
190
Asp
iratio
n0.
000
0.00
00.
000
0.00
00.
116
0.11
60.
116
0.11
60.
116
0.11
60.
116
0.11
60.
116
0.11
60.
116
0.11
60.
116
0.11
60.
116
Occ
upat
iona
l and
mac
hine
inju
ries
0.00
00.
000
0.00
00.
000
0.07
50.
076
0.07
60.
076
0.07
60.
076
0.07
60.
076
0.07
60.
074
0.07
30.
072
0.07
20.
072
0.07
2
0.00
00.
000
0.00
00.
000
0.08
60.
197
0.17
40.
185
0.22
80.
192
0.20
90.
212
0.17
40.
192
0.14
80.
126
0.11
90.
139
0.13
9
Chi
ld a
buse
2 & A
ssau
lt0.
160
0.16
00.
160
0.16
00.
470
0.47
00.
470
0.47
00.
470
0.47
00.
470
0.47
00.
470
0.47
00.
470
0.47
00.
470
0.47
00.
470
20.
000
0.00
00.
000
0.00
00.
000
0.00
00.
000
0.00
00.
000
0.00
00.
000
0.00
00.
000
0.00
00.
000
0.00
00.
000
0.00
00.
000
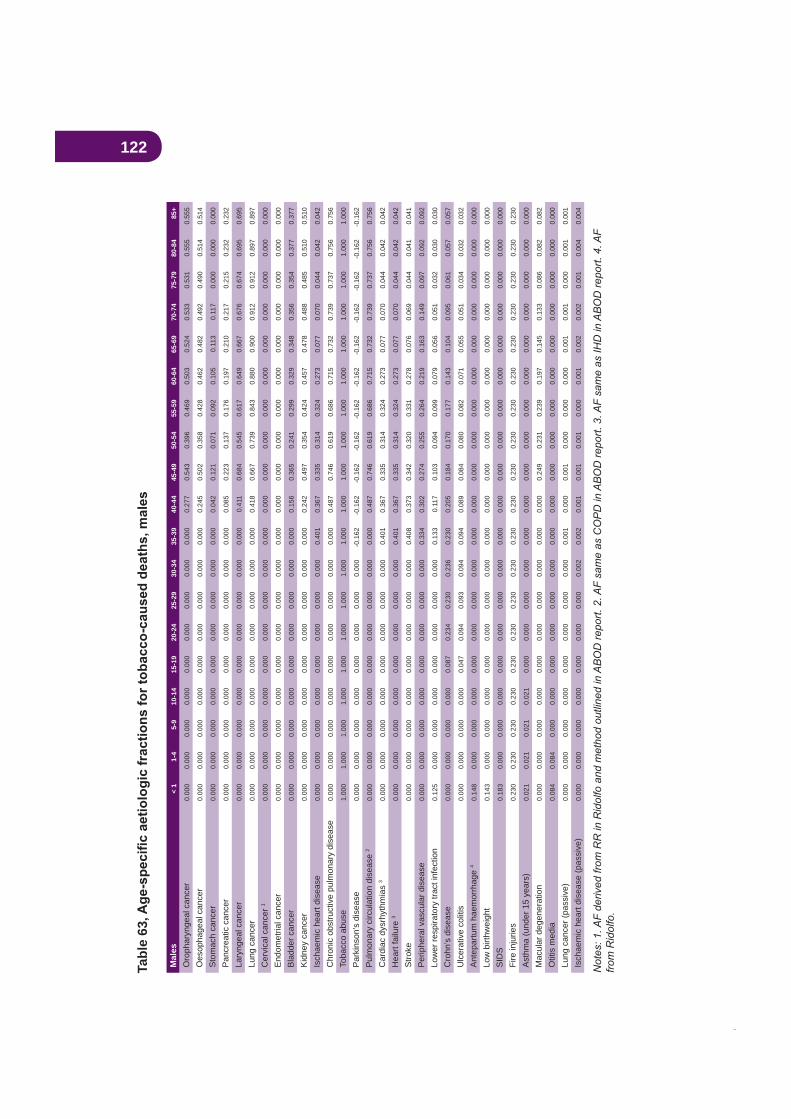
122M
ales
< 1
1-4
5-9
10-1
415
-19
20-2
425
-29
30-3
435
-39
40-4
445
-49
50-5
455
-59
60-6
465
-69
70-7
475
-79
80-8
485
+
Oro
phar
ynge
al c
ance
r0.
000
0.00
00.
000
0.00
00.
000
0.00
00.
000
0.00
00.
000
0.27
70.
543
0.39
60.
469
0.50
30.
524
0.53
30.
531
0.55
50.
555
Oes
opha
geal
can
cer
0.00
00.
000
0.00
00.
000
0.00
00.
000
0.00
00.
000
0.00
00.
245
0.50
20.
358
0.42
80.
462
0.48
20.
492
0.49
00.
514
0.51
4
Sto
mac
h ca
ncer
0.00
00.
000
0.00
00.
000
0.00
00.
000
0.00
00.
000
0.00
00.
042
0.12
10.
071
0.09
20.
105
0.11
30.
117
0.00
00.
000
0.00
0
Pan
crea
tic c
ance
r0.
000
0.00
00.
000
0.00
00.
000
0.00
00.
000
0.00
00.
000
0.08
50.
223
0.13
70.
176
0.19
70.
210
0.21
70.
215
0.23
20.
232
Lary
ngea
l can
cer
0.00
00.
000
0.00
00.
000
0.00
00.
000
0.00
00.
000
0.00
00.
411
0.68
40.
545
0.61
70.
649
0.66
70.
676
0.67
40.
695
0.69
5
Lung
can
cer
0.00
00.
000
0.00
00.
000
0.00
00.
000
0.00
00.
000
0.00
00.
418
0.66
70.
739
0.84
30.
880
0.90
00.
912
0.91
20.
897
0.89
7
Cer
vica
l can
cer 1
0.00
00.
000
0.00
00.
000
0.00
00.
000
0.00
00.
000
0.00
00.
000
0.00
00.
000
0.00
00.
000
0.00
00.
000
0.00
00.
000
0.00
0
End
omet
rial c
ance
r0.
000
0.00
00.
000
0.00
00.
000
0.00
00.
000
0.00
00.
000
0.00
00.
000
0.00
00.
000
0.00
00.
000
0.00
00.
000
0.00
00.
000
Bla
dder
can
cer
0.00
00.
000
0.00
00.
000
0.00
00.
000
0.00
00.
000
0.00
00.
156
0.36
50.
241
0.29
90.
329
0.34
80.
356
0.35
40.
377
0.37
7
Kid
ney
canc
er0.
000
0.00
00.
000
0.00
00.
000
0.00
00.
000
0.00
00.
000
0.24
20.
497
0.35
40.
424
0.45
70.
478
0.48
80.
485
0.51
00.
510
Isch
aem
ic h
eart
dise
ase
0.00
00.
000
0.00
00.
000
0.00
00.
000
0.00
00.
000
0.40
10.
367
0.33
50.
314
0.32
40.
273
0.07
70.
070
0.04
40.
042
0.04
2
Chr
onic
obs
truct
ive
pulm
onar
y di
seas
e0.
000
0.00
00.
000
0.00
00.
000
0.00
00.
000
0.00
00.
000
0.48
70.
746
0.61
90.
686
0.71
50.
732
0.73
90.
737
0.75
60.
756
Toba
cco
abus
e1.
000
1.00
01.
000
1.00
01.
000
1.00
01.
000
1.00
01.
000
1.00
01.
000
1.00
01.
000
1.00
01.
000
1.00
01.
000
1.00
01.
000
Par
kins
on’s
dis
ease
0.00
00.
000
0.00
00.
000
0.00
00.
000
0.00
00.
000
-0.1
62-0
.162
-0.1
62-0
.162
-0.1
62-0
.162
-0.1
62-0
.162
-0.1
62-0
.162
-0.1
62
Pul
mon
ary
circ
ulat
ion
dise
ase
20.
000
0.00
00.
000
0.00
00.
000
0.00
00.
000
0.00
00.
000
0.48
70.
746
0.61
90.
686
0.71
50.
732
0.73
90.
737
0.75
60.
756
Car
diac
dys
rhyt
hmia
s 3
0.00
00.
000
0.00
00.
000
0.00
00.
000
0.00
00.
000
0.40
10.
367
0.33
50.
314
0.32
40.
273
0.07
70.
070
0.04
40.
042
0.04
2
Hea
rt fa
ilure
30.
000
0.00
00.
000
0.00
00.
000
0.00
00.
000
0.00
00.
401
0.36
70.
335
0.31
40.
324
0.27
30.
077
0.07
00.
044
0.04
20.
042
Stro
ke0.
000
0.00
00.
000
0.00
00.
000
0.00
00.
000
0.00
00.
408
0.37
30.
342
0.32
00.
331
0.27
80.
076
0.06
90.
044
0.04
10.
041
Per
iphe
ral v
ascu
lar d
isea
se0.
000
0.00
00.
000
0.00
00.
000
0.00
00.
000
0.00
00.
334
0.30
20.
274
0.25
50.
264
0.21
90.
163
0.14
90.
097
0.09
20.
092
Low
er re
spira
tory
trac
t inf
ectio
n0.
125
0.00
00.
000
0.00
00.
000
0.00
00.
000
0.00
00.
133
0.11
70.
103
0.09
40.
099
0.07
90.
056
0.05
10.
032
0.03
00.
030
Cro
hn’s
dis
ease
0.00
00.
000
0.00
00.
000
0.08
70.
234
0.23
00.
236
0.23
00.
205
0.18
40.
170
0.17
70.
143
0.10
40.
095
0.06
10.
057
0.05
7
Ulc
erat
ive
colit
is
0.00
00.
000
0.00
00.
000
0.04
70.
094
0.09
30.
094
0.09
40.
089
0.08
40.
080
0.08
20.
071
0.05
50.
051
0.03
40.
032
0.03
2
Ant
epar
tum
hae
mor
rhag
e 4
0.14
80.
000
0.00
00.
000
0.00
00.
000
0.00
00.
000
0.00
00.
000
0.00
00.
000
0.00
00.
000
0.00
00.
000
0.00
00.
000
0.00
0
Low
birt
hwei
ght
0.14
30.
000
0.00
00.
000
0.00
00.
000
0.00
00.
000
0.00
00.
000
0.00
00.
000
0.00
00.
000
0.00
00.
000
0.00
00.
000
0.00
0
SID
S0.
183
0.00
00.
000
0.00
00.
000
0.00
00.
000
0.00
00.
000
0.00
00.
000
0.00
00.
000
0.00
00.
000
0.00
00.
000
0.00
00.
000
Fire
inju
ries
0.23
00.
230
0.23
00.
230
0.23
00.
230
0.23
00.
230
0.23
00.
230
0.23
00.
230
0.23
00.
230
0.23
00.
230
0.23
00.
230
0.23
0
Ast
hma
(und
er 1
5 ye
ars)
0.02
10.
021
0.02
10.
021
0.00
00.
000
0.00
00.
000
0.00
00.
000
0.00
00.
000
0.00
00.
000
0.00
00.
000
0.00
00.
000
0.00
0
Mac
ular
deg
ener
atio
n0.
000
0.00
00.
000
0.00
00.
000
0.00
00.
000
0.00
00.
000
0.00
00.
249
0.23
10.
239
0.19
70.
145
0.13
30.
086
0.08
20.
082
Otit
is m
edia
0.08
40.
084
0.00
00.
000
0.00
00.
000
0.00
00.
000
0.00
00.
000
0.00
00.
000
0.00
00.
000
0.00
00.
000
0.00
00.
000
0.00
0
Lung
can
cer (
pass
ive)
0.00
00.
000
0.00
00.
000
0.00
00.
000
0.00
00.
000
0.00
10.
000
0.00
10.
000
0.00
00.
000
0.00
10.
001
0.00
00.
001
0.00
1
Isch
aem
ic h
eart
dise
ase
(pas
sive
)0.
000
0.00
00.
000
0.00
00.
000
0.00
00.
000
0.00
20.
002
0.00
10.
001
0.00
10.
000
0.00
10.
002
0.00
20.
001
0.00
40.
004
Tabl
e 63
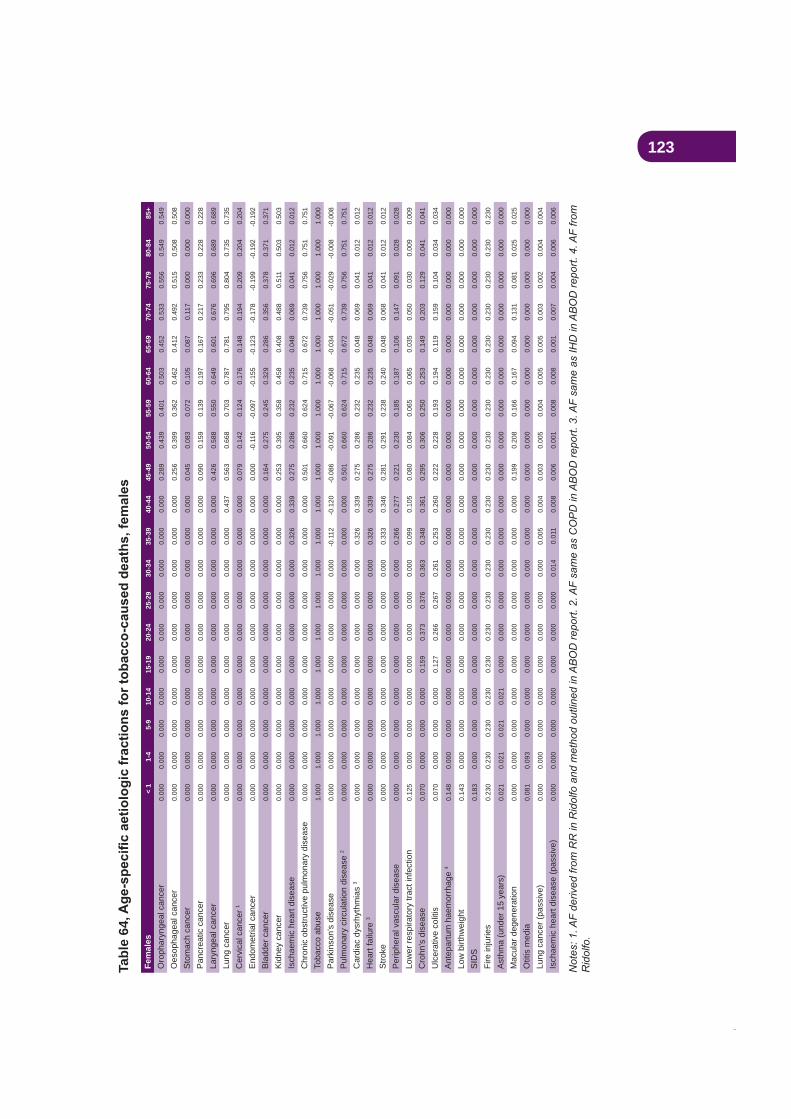
123Ta
ble
64Fe
mal
es<
11-
45-
910
-14
15-1
920
-24
25-2
930
-34
35-3
940
-44
45-4
950
-54
55-5
960
-64
65-6
970
-74
75-7
980
-84
85+
Oro
phar
ynge
al c
ance
r0.
000
0.00
00.
000
0.00
00.
000
0.00
00.
000
0.00
00.
000
0.00
00.
289
0.43
90.
401
0.50
30.
452
0.53
30.
556
0.54
90.
549
Oes
opha
geal
can
cer
0.00
00.
000
0.00
00.
000
0.00
00.
000
0.00
00.
000
0.00
00.
000
0.25
60.
399
0.36
20.
462
0.41
20.
492
0.51
50.
508
0.50
8
Sto
mac
h ca
ncer
0.00
00.
000
0.00
00.
000
0.00
00.
000
0.00
00.
000
0.00
00.
000
0.04
50.
083
0.07
20.
105
0.08
70.
117
0.00
00.
000
0.00
0
Pan
crea
tic c
ance
r0.
000
0.00
00.
000
0.00
00.
000
0.00
00.
000
0.00
00.
000
0.00
00.
090
0.15
90.
139
0.19
70.
167
0.21
70.
233
0.22
80.
228
Lary
ngea
l can
cer
0.00
00.
000
0.00
00.
000
0.00
00.
000
0.00
00.
000
0.00
00.
000
0.42
60.
588
0.55
00.
649
0.60
10.
676
0.69
60.
689
0.68
9
Lung
can
cer
0.00
00.
000
0.00
00.
000
0.00
00.
000
0.00
00.
000
0.00
00.
437
0.56
30.
668
0.70
30.
787
0.78
10.
795
0.80
40.
735
0.73
5
Cer
vica
l can
cer 1
0.00
00.
000
0.00
00.
000
0.00
00.
000
0.00
00.
000
0.00
00.
000
0.07
90.
142
0.12
40.
176
0.14
80.
194
0.20
90.
204
0.20
4
End
omet
rial c
ance
r0.
000
0.00
00.
000
0.00
00.
000
0.00
00.
000
0.00
00.
000
0.00
00.
000
-0.1
16-0
.097
-0.1
55-0
.123
-0.1
78-0
.199
-0.1
92-0
.192
Bla
dder
can
cer
0.00
00.
000
0.00
00.
000
0.00
00.
000
0.00
00.
000
0.00
00.
000
0.16
40.
275
0.24
50.
329
0.28
60.
356
0.37
80.
371
0.37
1
Kid
ney
canc
er0.
000
0.00
00.
000
0.00
00.
000
0.00
00.
000
0.00
00.
000
0.00
00.
253
0.39
50.
358
0.45
80.
408
0.48
80.
511
0.50
30.
503
Isch
aem
ic h
eart
dise
ase
0.00
00.
000
0.00
00.
000
0.00
00.
000
0.00
00.
000
0.32
60.
339
0.27
50.
286
0.23
20.
235
0.04
80.
069
0.04
10.
012
0.01
2
Chr
onic
obs
truct
ive
pulm
onar
y di
seas
e0.
000
0.00
00.
000
0.00
00.
000
0.00
00.
000
0.00
00.
000
0.00
00.
501
0.66
00.
624
0.71
50.
672
0.73
90.
756
0.75
10.
751
Toba
cco
abus
e1.
000
1.00
01.
000
1.00
01.
000
1.00
01.
000
1.00
01.
000
1.00
01.
000
1.00
01.
000
1.00
01.
000
1.00
01.
000
1.00
01.
000
Par
kins
on’s
dis
ease
0.00
00.
000
0.00
00.
000
0.00
00.
000
0.00
00.
000
-0.1
12-0
.120
-0.0
86-0
.091
-0.0
67-0
.068
-0.0
34-0
.051
-0.0
29-0
.008
-0.0
08
Pul
mon
ary
circ
ulat
ion
dise
ase
20.
000
0.00
00.
000
0.00
00.
000
0.00
00.
000
0.00
00.
000
0.00
00.
501
0.66
00.
624
0.71
50.
672
0.73
90.
756
0.75
10.
751
Car
diac
dys
rhyt
hmia
s 3
0.00
00.
000
0.00
00.
000
0.00
00.
000
0.00
00.
000
0.32
60.
339
0.27
50.
286
0.23
20.
235
0.04
80.
069
0.04
10.
012
0.01
2
Hea
rt fa
ilure
30.
000
0.00
00.
000
0.00
00.
000
0.00
00.
000
0.00
00.
326
0.33
90.
275
0.28
60.
232
0.23
50.
048
0.06
90.
041
0.01
20.
012
Stro
ke0.
000
0.00
00.
000
0.00
00.
000
0.00
00.
000
0.00
00.
333
0.34
60.
281
0.29
10.
238
0.24
00.
048
0.06
80.
041
0.01
20.
012
Per
iphe
ral v
ascu
lar d
isea
se0.
000
0.00
00.
000
0.00
00.
000
0.00
00.
000
0.00
00.
266
0.27
70.
221
0.23
00.
185
0.18
70.
106
0.14
70.
091
0.02
80.
028
Low
er re
spira
tory
trac
t inf
ectio
n0.
125
0.00
00.
000
0.00
00.
000
0.00
00.
000
0.00
00.
099
0.10
50.
080
0.08
40.
065
0.06
50.
035
0.05
00.
030
0.00
90.
009
Cro
hn’s
dis
ease
0.07
00.
000
0.00
00.
000
0.15
90.
373
0.37
60.
363
0.34
80.
361
0.29
50.
306
0.25
00.
253
0.14
90.
203
0.12
90.
041
0.04
1
Ulc
erat
ive
colit
is
0.07
00.
000
0.00
00.
000
0.12
70.
266
0.26
70.
261
0.25
30.
260
0.22
20.
228
0.19
30.
194
0.11
90.
159
0.10
40.
034
0.03
4
Ant
epar
tum
hae
mor
rhag
e 4
0.14
80.
000
0.00
00.
000
0.00
00.
000
0.00
00.
000
0.00
00.
000
0.00
00.
000
0.00
00.
000
0.00
00.
000
0.00
00.
000
0.00
0
Low
birt
hwei
ght
0.14
30.
000
0.00
00.
000
0.00
00.
000
0.00
00.
000
0.00
00.
000
0.00
00.
000
0.00
00.
000
0.00
00.
000
0.00
00.
000
0.00
0
SID
S0.
183
0.00
00.
000
0.00
00.
000
0.00
00.
000
0.00
00.
000
0.00
00.
000
0.00
00.
000
0.00
00.
000
0.00
00.
000
0.00
00.
000
Fire
inju
ries
0.23
00.
230
0.23
00.
230
0.23
00.
230
0.23
00.
230
0.23
00.
230
0.23
00.
230
0.23
00.
230
0.23
00.
230
0.23
00.
230
0.23
0
Ast
hma
(und
er 1
5 ye
ars)
0.02
10.
021
0.02
10.
021
0.00
00.
000
0.00
00.
000
0.00
00.
000
0.00
00.
000
0.00
00.
000
0.00
00.
000
0.00
00.
000
0.00
0
Mac
ular
deg
ener
atio
n0.
000
0.00
00.
000
0.00
00.
000
0.00
00.
000
0.00
00.
000
0.00
00.
199
0.20
80.
166
0.16
70.
094
0.13
10.
081
0.02
50.
025
Otit
is m
edia
0.08
10.
093
0.00
00.
000
0.00
00.
000
0.00
00.
000
0.00
00.
000
0.00
00.
000
0.00
00.
000
0.00
00.
000
0.00
00.
000
0.00
0
Lung
can
cer (
pass
ive)
0.00
00.
000
0.00
00.
000
0.00
00.
000
0.00
00.
000
0.00
50.
004
0.00
30.
005
0.00
40.
005
0.00
50.
003
0.00
20.
004
0.00
4
Isch
aem
ic h
eart
dise
ase
(pas
sive
)0.
000
0.00
00.
000
0.00
00.
000
0.00
00.
000
0.01
40.
011
0.00
80.
006
0.00
10.
008
0.00
80.
001
0.00
70.
004
0.00
60.
006

124Fe
mal
es<
11-
45-
910
-14
15-1
920
-24
25-2
930
-34
35-3
940
-44
45-4
950
-54
55-5
960
-64
65-6
970
-74
75-7
980
-84
85+
Opi
ate
depe
nden
ce0.
000
0.00
00.
000
0.00
01.
000
1.00
01.
000
1.00
01.
000
1.00
01.
000
1.00
01.
000
1.00
01.
000
1.00
01.
000
1.00
01.
000
Opi
ate
abus
e0.
000
0.00
00.
000
0.00
01.
000
1.00
01.
000
1.00
01.
000
1.00
01.
000
1.00
01.
000
1.00
01.
000
1.00
01.
000
1.00
01.
000
Opi
ate
pois
onin
g0.
000
0.00
00.
000
0.00
01.
000
1.00
01.
000
1.00
01.
000
1.00
01.
000
1.00
01.
000
1.00
01.
000
1.00
01.
000
1.00
01.
000
Acc
iden
tal o
piat
e po
ison
ing
0.00
00.
000
0.00
00.
000
1.00
01.
000
1.00
01.
000
1.00
01.
000
1.00
01.
000
1.00
01.
000
1.00
01.
000
1.00
01.
000
1.00
0
Can
nabi
s de
pend
ence
0.00
00.
000
0.00
00.
000
1.00
01.
000
1.00
01.
000
1.00
01.
000
1.00
01.
000
1.00
01.
000
1.00
01.
000
1.00
01.
000
1.00
0
Can
nabi
s ab
use
0.00
00.
000
0.00
00.
000
1.00
01.
000
1.00
01.
000
1.00
01.
000
1.00
01.
000
1.00
01.
000
1.00
01.
000
1.00
01.
000
1.00
0
Am
phet
amin
e de
pend
ence
0.00
00.
000
0.00
00.
000
1.00
01.
000
1.00
01.
000
1.00
01.
000
1.00
01.
000
1.00
01.
000
1.00
01.
000
1.00
01.
000
1.00
0
Am
phet
amin
e ab
use
0.00
00.
000
0.00
00.
000
1.00
01.
000
1.00
01.
000
1.00
01.
000
1.00
01.
000
1.00
01.
000
1.00
01.
000
1.00
01.
000
1.00
0
Coc
aine
dep
ende
nce
0.00
00.
000
0.00
00.
000
1.00
01.
000
1.00
01.
000
1.00
01.
000
1.00
01.
000
1.00
01.
000
1.00
01.
000
1.00
01.
000
1.00
0
Coc
aine
abu
se0.
000
0.00
00.
000
0.00
01.
000
1.00
01.
000
1.00
01.
000
1.00
01.
000
1.00
01.
000
1.00
01.
000
1.00
01.
000
1.00
01.
000
Psy
chos
timul
ant p
oiso
ning
0.00
00.
000
0.00
00.
000
1.00
01.
000
1.00
01.
000
1.00
01.
000
1.00
01.
000
1.00
01.
000
1.00
01.
000
1.00
01.
000
1.00
0
Acc
iden
tal p
oiso
n by
psy
chos
timul
ants
0.00
00.
000
0.00
00.
000
1.00
01.
000
1.00
01.
000
1.00
01.
000
1.00
01.
000
1.00
01.
000
1.00
01.
000
1.00
01.
000
1.00
0
Hal
luci
noge
n de
pend
ence
0.00
00.
000
0.00
00.
000
1.00
01.
000
1.00
01.
000
1.00
01.
000
1.00
01.
000
1.00
01.
000
1.00
01.
000
1.00
01.
000
1.00
0
Hal
luci
noge
n ab
use
0.00
00.
000
0.00
00.
000
1.00
01.
000
1.00
01.
000
1.00
01.
000
1.00
01.
000
1.00
01.
000
1.00
01.
000
1.00
01.
000
1.00
0
Hal
luci
noge
n po
ison
ing
0.00
00.
000
0.00
00.
000
1.00
01.
000
1.00
01.
000
1.00
01.
000
1.00
01.
000
1.00
01.
000
1.00
01.
000
1.00
01.
000
1.00
0
Oth
er p
sych
otro
pic
drug
poi
soni
ng0.
000
0.00
00.
000
0.00
01.
000
1.00
01.
000
1.00
01.
000
1.00
01.
000
1.00
01.
000
1.00
01.
000
1.00
01.
000
1.00
01.
000
Acc
iden
tal p
oiso
ning
by
hallu
cino
gens
0.00
00.
000
0.00
00.
000
1.00
01.
000
1.00
01.
000
1.00
01.
000
1.00
01.
000
1.00
01.
000
1.00
01.
000
1.00
01.
000
1.00
0
Ana
bolic
ste
roid
poi
soni
ng0.
000
0.00
00.
000
0.00
01.
000
1.00
01.
000
1.00
01.
000
1.00
01.
000
1.00
01.
000
1.00
01.
000
1.00
01.
000
1.00
01.
000
Hep
atiti
s B
0.00
00.
000
0.00
00.
000
0.52
30.
523
0.52
30.
523
0.52
30.
523
0.52
30.
523
0.52
30.
523
0.52
30.
523
0.52
30.
523
0.52
3
Hep
atiti
s C
0.00
00.
000
0.00
00.
000
0.88
60.
886
0.88
60.
886
0.88
60.
886
0.88
60.
886
0.88
60.
886
0.88
60.
886
0.88
60.
886
0.88
6
HIV
/AID
S0.
000
0.00
00.
000
0.00
00.
370
0.37
00.
000
0.37
00.
333
0.66
70.
370
0.37
00.
370
0.37
00.
370
0.37
00.
370
0.37
00.
370
Infe
ctiv
e en
doca
rditi
s0.
000
0.00
00.
000
0.00
00.
140
0.14
00.
140
0.14
00.
140
0.14
00.
140
0.00
00.
000
0.00
00.
000
0.00
00.
000
0.00
00.
000
Dru
g ps
ycho
ses
0.00
00.
000
0.00
00.
000
1.00
01.
000
1.00
01.
000
1.00
01.
000
1.00
01.
000
1.00
01.
000
1.00
01.
000
1.00
01.
000
1.00
0
Mat
erna
l dru
g de
pend
ence
0.00
00.
000
0.00
00.
000
1.00
01.
000
1.00
01.
000
1.00
01.
000
1.00
01.
000
1.00
01.
000
1.00
01.
000
1.00
01.
000
1.00
0
New
born
dru
g to
xici
ty1.
000
0.00
00.
000
0.00
00.
000
0.00
00.
000
0.00
00.
000
0.00
00.
000
0.00
00.
000
0.00
00.
000
0.00
00.
000
0.00
00.
000
Ant
epar
tum
hae
mor
rhag
e0.
000
0.00
00.
000
0.00
00.
045
0.07
10.
054
0.04
40.
026
0.01
70.
003
0.00
00.
000
0.00
00.
000
0.00
00.
000
0.00
00.
000
Low
birt
hwei
ght
0.00
90.
000
0.00
00.
000
0.00
00.
000
0.00
00.
000
0.00
00.
000
0.00
00.
000
0.00
00.
000
0.00
00.
000
0.00
00.
000
0.00
0
Roa
d in
jurie
s0.
000
0.00
00.
000
0.00
00.
055
0.05
50.
055
0.05
50.
055
0.05
50.
055
0.05
50.
055
0.05
50.
055
0.05
50.
055
0.05
50.
055
Sui
cide
0.00
00.
000
0.00
00.
000
0.09
00.
090
0.09
00.
090
0.09
00.
090
0.09
00.
090
0.09
00.
090
0.09
00.
090
0.09
00.
090
0.09
0
Sch
izop
hren
ia0.
000
0.00
00.
000
0.00
00.
036
0.03
40.
056
0.03
90.
034
0.01
90.
009
0.00
70.
001
0.00
00.
001
0.00
00.
000
0.00
00.
000
0.00
00.
000
0.00
00.
000
1.00
01.
000
1.00
01.
000
1.00
01.
000
1.00
01.
000
1.00
01.
000
1.00
01.
000
1.00
01.
000
1.00
0
Tabl
e 65
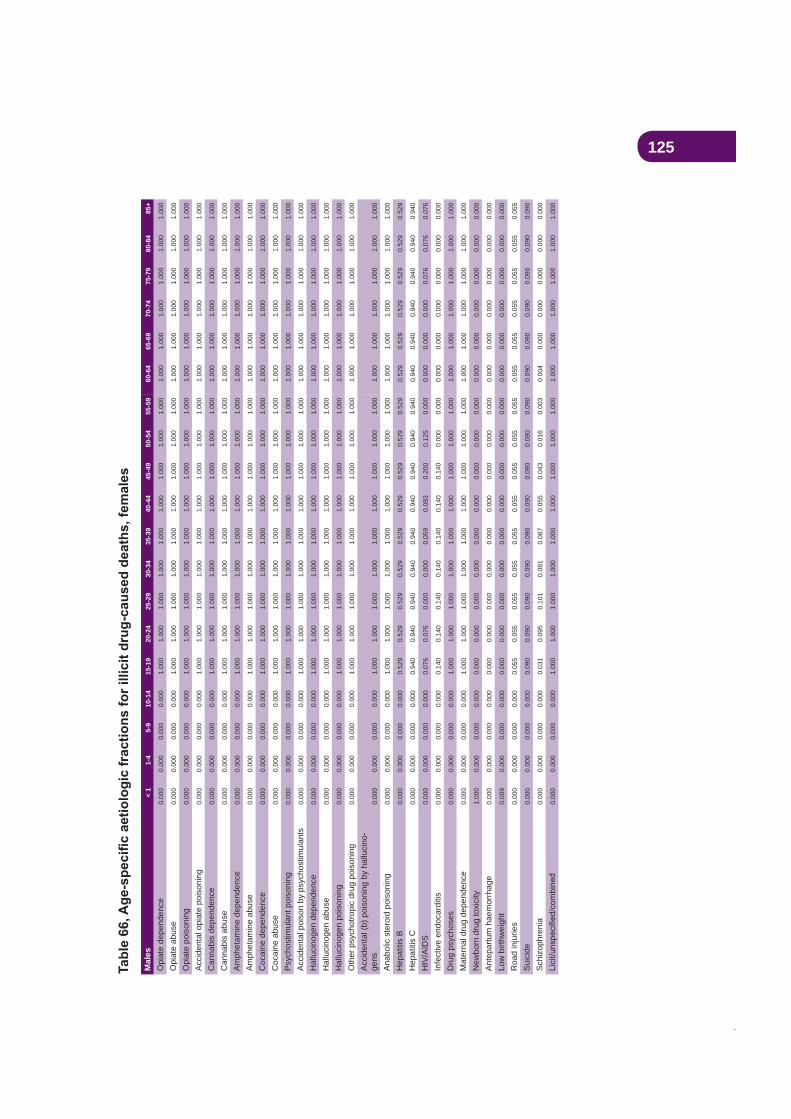
125M
ales
< 1
1-4
5-9
10-1
415
-19
20-2
425
-29
30-3
435
-39
40-4
445
-49
50-5
455
-59
60-6
465
-69
70-7
475
-79
80-8
485
+
Opi
ate
depe
nden
ce0.
000
0.00
00.
000
0.00
01.
000
1.00
01.
000
1.00
01.
000
1.00
01.
000
1.00
01.
000
1.00
01.
000
1.00
01.
000
1.00
01.
000
Opi
ate
abus
e0.
000
0.00
00.
000
0.00
01.
000
1.00
01.
000
1.00
01.
000
1.00
01.
000
1.00
01.
000
1.00
01.
000
1.00
01.
000
1.00
01.
000
Opi
ate
pois
onin
g0.
000
0.00
00.
000
0.00
01.
000
1.00
01.
000
1.00
01.
000
1.00
01.
000
1.00
01.
000
1.00
01.
000
1.00
01.
000
1.00
01.
000
Acc
iden
tal o
piat
e po
ison
ing
0.00
00.
000
0.00
00.
000
1.00
01.
000
1.00
01.
000
1.00
01.
000
1.00
01.
000
1.00
01.
000
1.00
01.
000
1.00
01.
000
1.00
0
Can
nabi
s de
pend
ence
0.00
00.
000
0.00
00.
000
1.00
01.
000
1.00
01.
000
1.00
01.
000
1.00
01.
000
1.00
01.
000
1.00
01.
000
1.00
01.
000
1.00
0
Can
nabi
s ab
use
0.00
00.
000
0.00
00.
000
1.00
01.
000
1.00
01.
000
1.00
01.
000
1.00
01.
000
1.00
01.
000
1.00
01.
000
1.00
01.
000
1.00
0
Am
phet
amin
e de
pend
ence
0.00
00.
000
0.00
00.
000
1.00
01.
000
1.00
01.
000
1.00
01.
000
1.00
01.
000
1.00
01.
000
1.00
01.
000
1.00
01.
000
1.00
0
Am
phet
amin
e ab
use
0.00
00.
000
0.00
00.
000
1.00
01.
000
1.00
01.
000
1.00
01.
000
1.00
01.
000
1.00
01.
000
1.00
01.
000
1.00
01.
000
1.00
0
Coc
aine
dep
ende
nce
0.00
00.
000
0.00
00.
000
1.00
01.
000
1.00
01.
000
1.00
01.
000
1.00
01.
000
1.00
01.
000
1.00
01.
000
1.00
01.
000
1.00
0
Coc
aine
abu
se0.
000
0.00
00.
000
0.00
01.
000
1.00
01.
000
1.00
01.
000
1.00
01.
000
1.00
01.
000
1.00
01.
000
1.00
01.
000
1.00
01.
000
Psy
chos
timul
ant p
oiso
ning
0.00
00.
000
0.00
00.
000
1.00
01.
000
1.00
01.
000
1.00
01.
000
1.00
01.
000
1.00
01.
000
1.00
01.
000
1.00
01.
000
1.00
0
Acc
iden
tal p
oiso
n by
psy
chos
timul
ants
0.00
00.
000
0.00
00.
000
1.00
01.
000
1.00
01.
000
1.00
01.
000
1.00
01.
000
1.00
01.
000
1.00
01.
000
1.00
01.
000
1.00
0
Hal
luci
noge
n de
pend
ence
0.00
00.
000
0.00
00.
000
1.00
01.
000
1.00
01.
000
1.00
01.
000
1.00
01.
000
1.00
01.
000
1.00
01.
000
1.00
01.
000
1.00
0
Hal
luci
noge
n ab
use
0.00
00.
000
0.00
00.
000
1.00
01.
000
1.00
01.
000
1.00
01.
000
1.00
01.
000
1.00
01.
000
1.00
01.
000
1.00
01.
000
1.00
0
Hal
luci
noge
n po
ison
ing
0.00
00.
000
0.00
00.
000
1.00
01.
000
1.00
01.
000
1.00
01.
000
1.00
01.
000
1.00
01.
000
1.00
01.
000
1.00
01.
000
1.00
0
Oth
er p
sych
otro
pic
drug
poi
soni
ng0.
000
0.00
00.
000
0.00
01.
000
1.00
01.
000
1.00
01.
000
1.00
01.
000
1.00
01.
000
1.00
01.
000
1.00
01.
000
1.00
01.
000
Acc
iden
tal (
b) p
oiso
ning
by
hallu
cino
-ge
ns0.
000
0.00
00.
000
0.00
01.
000
1.00
01.
000
1.00
01.
000
1.00
01.
000
1.00
01.
000
1.00
01.
000
1.00
01.
000
1.00
01.
000
Ana
bolic
ste
roid
poi
soni
ng0.
000
0.00
00.
000
0.00
01.
000
1.00
01.
000
1.00
01.
000
1.00
01.
000
1.00
01.
000
1.00
01.
000
1.00
01.
000
1.00
01.
000
Hep
atiti
s B
0.00
00.
000
0.00
00.
000
0.52
90.
529
0.52
90.
529
0.52
90.
529
0.52
90.
529
0.52
90.
529
0.52
90.
529
0.52
90.
529
0.52
9
Hep
atiti
s C
0.00
00.
000
0.00
00.
000
0.94
00.
940
0.94
00.
940
0.94
00.
940
0.94
00.
940
0.94
00.
940
0.94
00.
940
0.94
00.
940
0.94
0
HIV
/AID
S0.
000
0.00
00.
000
0.00
00.
076
0.07
60.
000
0.00
00.
059
0.08
30.
200
0.12
50.
000
0.00
00.
000
0.00
00.
076
0.07
60.
076
Infe
ctiv
e en
doca
rditi
s0.
000
0.00
00.
000
0.00
00.
140
0.14
00.
140
0.14
00.
140
0.14
00.
140
0.00
00.
000
0.00
00.
000
0.00
00.
000
0.00
00.
000
Dru
g ps
ycho
ses
0.00
00.
000
0.00
00.
000
1.00
01.
000
1.00
01.
000
1.00
01.
000
1.00
01.
000
1.00
01.
000
1.00
01.
000
1.00
01.
000
1.00
0
Mat
erna
l dru
g de
pend
ence
0.00
00.
000
0.00
00.
000
1.00
01.
000
1.00
01.
000
1.00
01.
000
1.00
01.
000
1.00
01.
000
1.00
01.
000
1.00
01.
000
1.00
0
New
born
dru
g to
xici
ty1.
000
0.00
00.
000
0.00
00.
000
0.00
00.
000
0.00
00.
000
0.00
00.
000
0.00
00.
000
0.00
00.
000
0.00
00.
000
0.00
00.
000
Ant
epar
tum
hae
mor
rhag
e0.
000
0.00
00.
000
0.00
00.
000
0.00
00.
000
0.00
00.
000
0.00
00.
000
0.00
00.
000
0.00
00.
000
0.00
00.
000
0.00
00.
000
Low
birt
hwei
ght
0.00
90.
000
0.00
00.
000
0.00
00.
000
0.00
00.
000
0.00
00.
000
0.00
00.
000
0.00
00.
000
0.00
00.
000
0.00
00.
000
0.00
0
Roa
d in
jurie
s0.
000
0.00
00.
000
0.00
00.
055
0.05
50.
055
0.05
50.
055
0.05
50.
055
0.05
50.
055
0.05
50.
055
0.05
50.
055
0.05
50.
055
Sui
cide
0.00
00.
000
0.00
00.
000
0.09
00.
090
0.09
00.
090
0.09
00.
090
0.09
00.
090
0.09
00.
090
0.09
00.
090
0.09
00.
090
0.09
0
Sch
izop
hren
ia0.
000
0.00
00.
000
0.00
00.
031
0.09
50.
101
0.08
10.
087
0.05
50.
043
0.01
60.
003
0.00
40.
000
0.00
00.
000
0.00
00.
000
0.00
00.
000
0.00
00.
000
1.00
01.
000
1.00
01.
000
1.00
01.
000
1.00
01.
000
1.00
01.
000
1.00
01.
000
1.00
01.
000
1.00
0
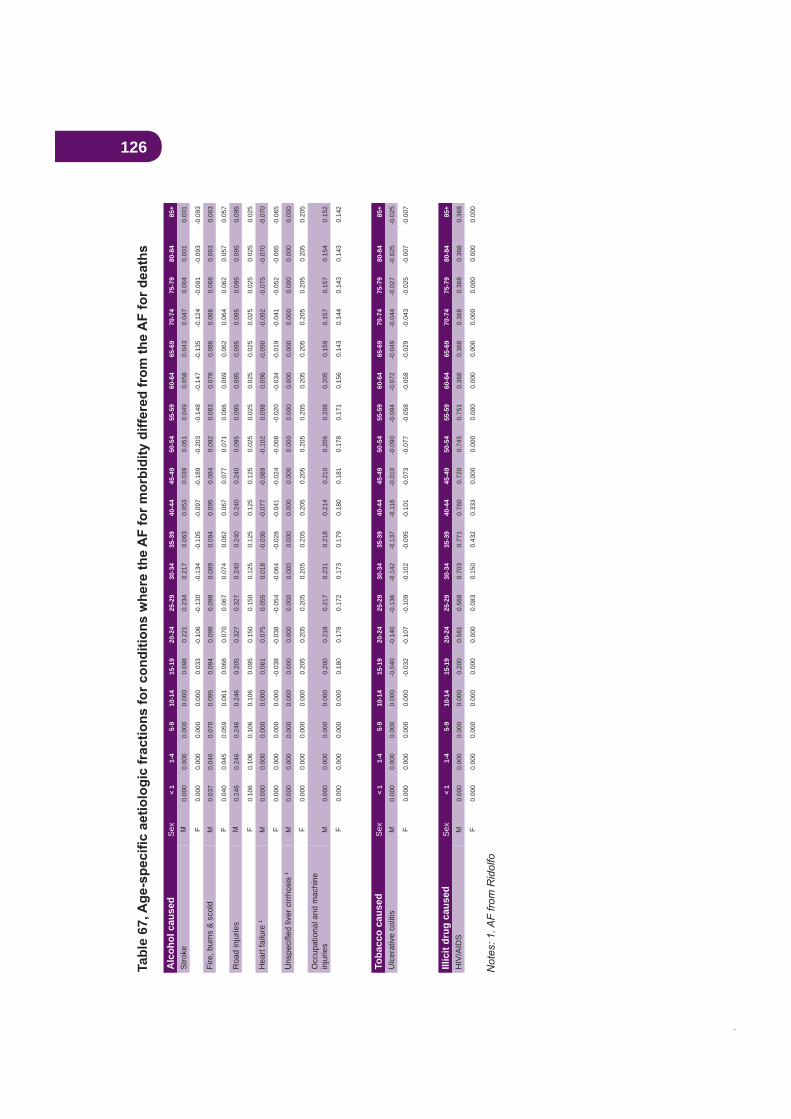
126Ta
ble
67
Alc
ohol
cau
sed
Sex
< 1
1-4
5-9
10-1
415
-19
20-2
425
-29
30-3
435
-39
40-4
445
-49
50-5
455
-59
60-6
465
-69
70-7
475
-79
80-8
485
+
Stro
keM
0.00
00.
000
0.00
00.
000
0.09
80.
221
0.23
40.
217
0.06
30.
053
0.03
90.
051
0.04
90.
058
0.04
30.
047
0.00
40.
001
0.00
1
F0.
000
0.00
00.
000
0.00
00.
033
-0.1
06-0
.130
-0.1
34-0
.105
-0.0
97-0
.189
-0.2
03-0
.148
-0.1
47-0
.135
-0.1
24-0
.091
-0.0
93-0
.093
Fire
, bur
ns &
sco
ldM
0.03
70.
046
0.07
00.
095
0.09
40.
098
0.09
80.
089
0.09
40.
095
0.08
40.
092
0.08
30.
078
0.08
60.
086
0.06
80.
063
0.06
3
F0.
040
0.04
50.
059
0.06
10.
068
0.07
00.
067
0.07
40.
062
0.06
70.
077
0.07
10.
066
0.06
90.
062
0.06
40.
062
0.05
70.
057
Roa
d in
jurie
sM
0.24
60.
246
0.24
60.
246
0.20
50.
327
0.32
70.
240
0.24
00.
240
0.24
00.
095
0.09
50.
095
0.09
50.
095
0.09
50.
095
0.09
5
F0.
106
0.10
60.
106
0.10
60.
095
0.15
00.
150
0.12
50.
125
0.12
50.
125
0.02
50.
025
0.02
50.
025
0.02
50.
025
0.02
50.
025
Hea
rt fa
ilure
1M
0.00
00.
000
0.00
00.
000
0.06
10.
075
0.05
50.
018
-0.0
36-0
.077
-0.0
89-0
.102
0.09
80.
096
-0.0
90-0
.092
-0.0
75-0
.070
-0.0
70
F0.
000
0.00
00.
000
0.00
0-0
.038
-0.0
38-0
.054
-0.0
64-0
.028
-0.0
41-0
.024
-0.0
08-0
.020
-0.0
34-0
.019
-0.0
41-0
.052
-0.0
65-0
.065
1M
0.00
00.
000
0.00
00.
000
0.00
00.
000
0.00
00.
000
0.00
00.
000
0.00
00.
000
0.00
00.
000
0.00
00.
000
0.00
00.
000
0.00
0
F0.
000
0.00
00.
000
0.00
00.
205
0.20
50.
205
0.20
50.
205
0.20
50.
205
0.20
50.
205
0.20
50.
205
0.20
50.
205
0.20
50.
205
Occ
upat
iona
l and
mac
hine
in
jurie
sM
0.00
00.
000
0.00
00.
000
0.20
00.
218
0.21
70.
231
0.21
80.
214
0.21
00.
206
0.20
80.
205
0.15
90.
157
0.15
70.
154
0.15
2
F0.
000
0.00
00.
000
0.00
00.
180
0.17
80.
172
0.17
30.
179
0.18
00.
181
0.17
80.
171
0.15
60.
143
0.14
40.
143
0.14
30.
142
Toba
cco
caus
edS
ex<
11-
45-
910
-14
15-1
920
-24
25-2
930
-34
35-3
940
-44
45-4
950
-54
55-5
960
-64
65-6
970
-74
75-7
980
-84
85+
Ulc
erat
ive
colit
isM
0.00
00.
000
0.00
00.
000
-0.0
40-0
.140
-0.1
36-0
.142
-0.1
37-0
.116
-0.0
10-0
.090
-0.0
94-0
.072
-0.0
49-0
.044
-0.0
27-0
.025
-0.0
25
F0.
000
0.00
00.
000
0.00
0-0
.032
-0.1
07-0
.109
-0.1
02-0
.095
-0.1
01-0
.073
-0.0
77-0
.058
-0.0
58-0
.029
-0.0
43-0
.025
-0.0
07-0
.007
Illic
it dr
ug c
ause
dS
ex<
11-
45-
910
-14
15-1
920
-24
25-2
930
-34
35-3
940
-44
45-4
950
-54
55-5
960
-64
65-6
970
-74
75-7
980
-84
85+
HIV
/AID
SM
0.00
00.
000
0.00
00.
000
0.20
00.
581
0.56
80.
703
0.77
10.
760
0.72
00.
745
0.75
10.
368
0.36
80.
368
0.36
80.
368
0.36
8
F0.
000
0.00
00.
000
0.00
00.
000
0.00
00.
083
0.15
00.
432
0.33
30.
000
0.00
00.
000
0.00
00.
000
0.00
00.
000
0.00
00.
000
127
Footnotes to appendicesAppendix B
1 Unlike DUMA which collects details on all charges and then creates a most serious offence
Williams (2005) original estimates without any adjustments.
Appendix C
2 http://www.health.gov.au/internet/wcms/publishing.nsf/Content/health-casemix-costing-fc_r8
3 English D.R., Holman C.D.J., Milne E., Winter M.G., Hulse G.K., Codde J.P., Bower C.I., Corti B., de Klerk N., Knuiman M.W., Kurinczuk J.J., Lewin G.F., Ryan G.A.
1995 edition, Commonwealth Dept of Human Services and Health, Canberra, 1995.
4 Ridolfo B, Stevenson C. Australia, 1998. AIHW Cat No. PHE 29, Canberra (Drug Statistics Series no. 7), 2001.
5 Begg, S., Vos, T., Goss, J., Barker, B., Stevenson, C., Stanley, L., and Lopez, A. (2007), . PHE 82, Australian Institute of Health
and Welfare.
6 Australian Bureau of Statistics, 2001 National Health Survey, Catalogue: 4364.0, 2002.
7 2004 National Drug Strategy Household Survey, AIHW Cat No. PHE 66 (Drug Statistics Series No. 16), 2005,
8 http://web.med.unsw.edu.au/nchecr/
9
cancer as a cause of death”. Int J Cancer, 17:429-435.
10 In the ABOD methodology, these conditions are viewed as drug-caused but grouped into a broader category of diseases and not shown separately; ICD-10 codes from Ridolfo.
11 In the ABOD methodology, child abuse (aged < 15 years) is not included in the ‘Assault’
12 Not viewed as a tobacco-caused disease in ABOD but included in this study due to evidence from the US Surgeon General’s report; ICD-10 codes from Ridolfo.
13 In the ABOD methodology, these conditions are viewed as drug-caused but grouped into a broader category of diseases and not shown separately; ICD-10 codes from Ridolfo.
14 Added by ABOD based on evidence released since Ridolfo’s report.
15
16 Not included by ABOD; ICD-10 codes from Ridolfo.
17 New from the ABOD report.