Embed Size (px)
DESCRIPTION
Biocon Investors Presentation July 2013
Citation preview

Innovative Science Affordable Medicine
www.biocon.com
Investor Presentation July 2013

Certain statements in this release concerning our future growth prospects are forward-looking
statements, which are subject to a number of risks, uncertainties and assumptions that could cause
actual results to differ materially from those contemplated in such forward-looking statements.
Important factors that could cause actual results to differ materially from our expectations include,
amongst others general economic and business conditions in India, our ability to successfully
implement our strategy, our research and development efforts, our growth and expansion plans and
technological changes, changes in the value of the Rupee and other currencies, changes in the Indian
and international interest rates, change in laws and regulations that apply to the Indian and global
biotechnology and pharmaceuticals industries, increasing competition in and the conditions of the
Indian biotechnology and pharmaceuticals industries, changes in political conditions in India and
changes in the foreign exchange control regulations in India. Neither the company, nor its directors and
any of the affiliates have any obligation to update or otherwise revise any statements reflecting
circumstances arising after this date or to reflect the occurrence of underlying events, even if the
underlying assumptions do not come to fruition.
Safe Harbor
2
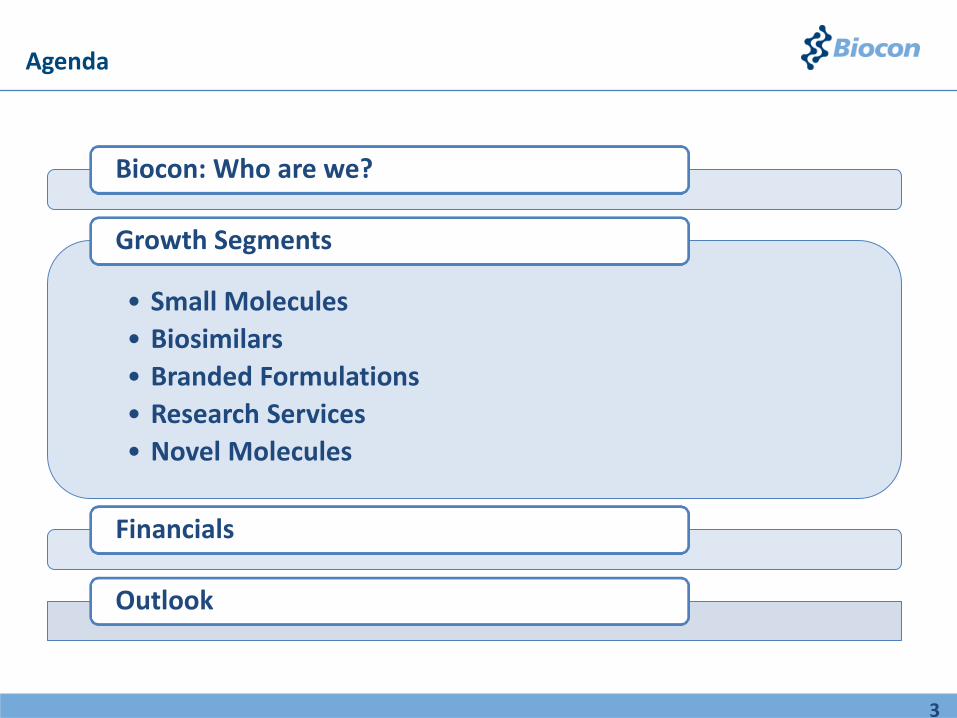
Biocon: Who are we?
• Small Molecules
• Biosimilars
• Branded Formulations
• Research Services
• Novel Molecules
Growth Segments
Financials
Outlook
Agenda
3

Biocon: Who are We?
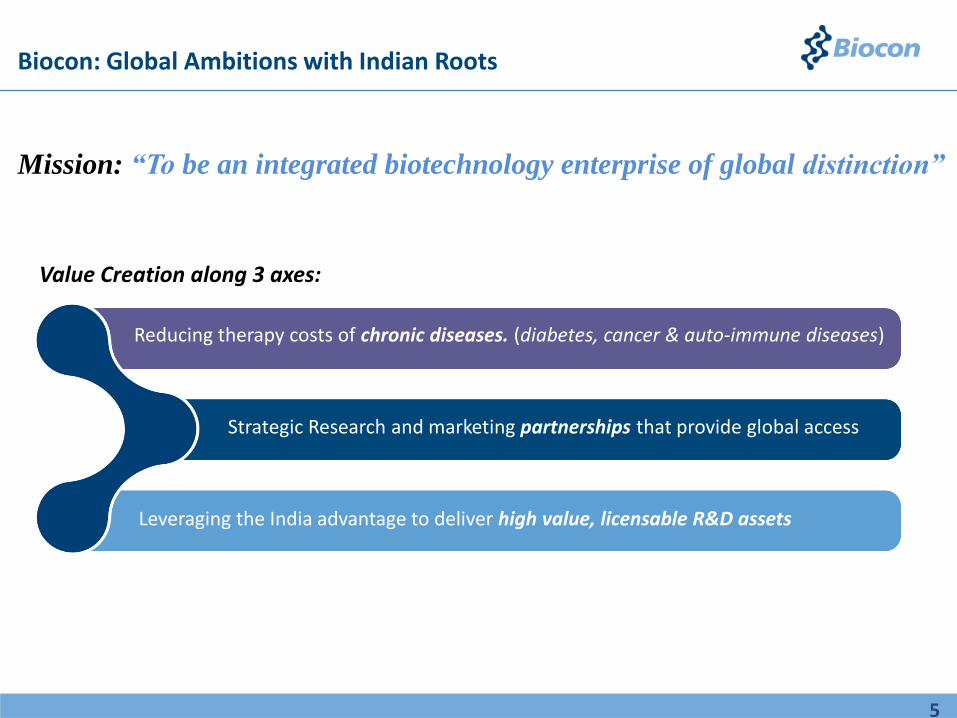
Biocon: Global Ambitions with Indian Roots
Mission: “To be an integrated biotechnology enterprise of global distinction”
Value Creation along 3 axes:
Leveraging the India advantage to deliver high value, licensable R&D assets
Strategic Research and marketing partnerships that provide global access
Reducing therapy costs of chronic diseases. (diabetes, cancer & auto-immune diseases)
5

Evolving with the Times
1978 -1999
1999 - 2004
2004 - 2009
2009 – 2014
2014 & Beyond
An Enzymes Company Revenue: ` 32 Crores
Building the India Business and expertise in biologics Revenue: ` 1,194 Crores
People: 3,500+
Investment intensive phase with focus on R&D, capacity &
partnership execution Revenue (FY 13): ` 2,538 Crores
People: 6,700+
Transforming into a Biopharma company
Revenues: ` 549 Crores
People: 700+
Unwavering focus through the years on Innovation & Difficult to make, niche products to create tangible differentiators for sustainable growth
6
Poised for a global platform with launch of finished formulations & biosimilars in regulated
markets
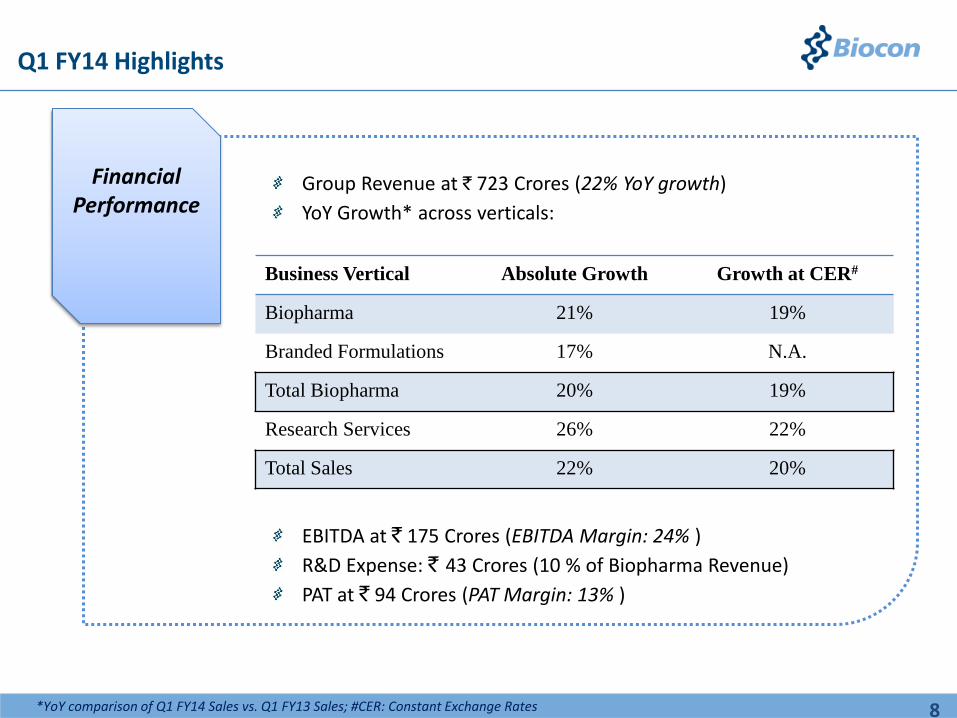
Group Revenue at ` 723 Crores (22% YoY growth)
YoY Growth* across verticals:
EBITDA at ` 175 Crores (EBITDA Margin: 24% )
R&D Expense: ` 43 Crores (10 % of Biopharma Revenue)
PAT at ` 94 Crores (PAT Margin: 13% )
Financial Performance
Q1 FY14 Highlights
8 *YoY comparison of Q1 FY14 Sales vs. Q1 FY13 Sales; #CER: Constant Exchange Rates
Business Vertical Absolute Growth Growth at CER#
Biopharma 21% 19%
Branded Formulations 17% N.A.
Total Biopharma 20% 19%
Research Services 26% 22%
Total Sales 22% 20%
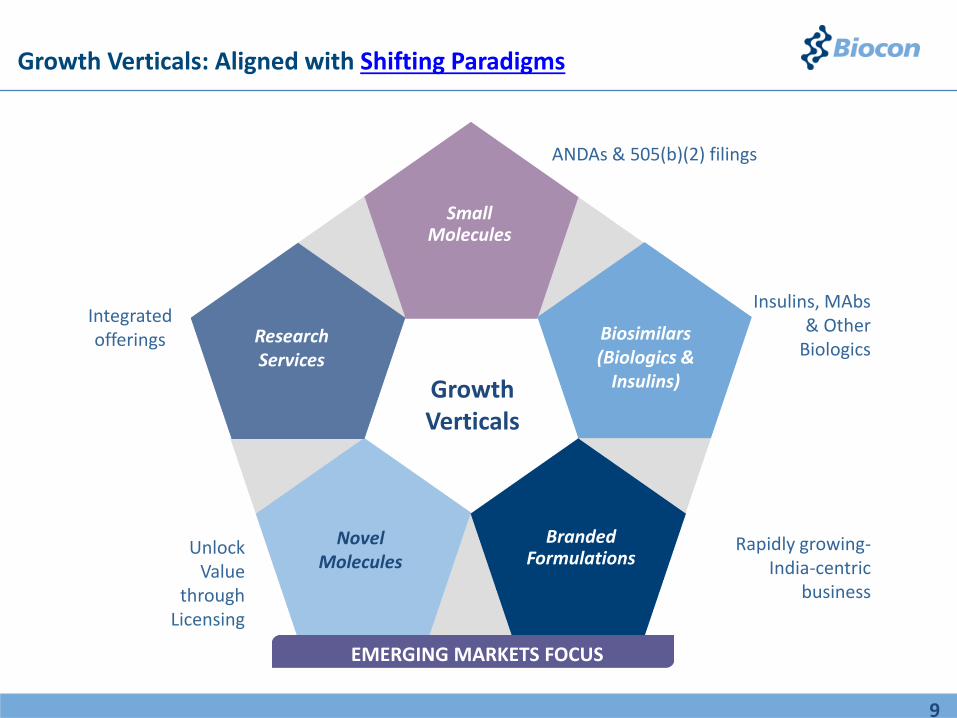
Novel Molecules
Unlock Value
through Licensing
Growth Verticals
ANDAs & 505(b)(2) filings
Small Molecules
Research Services
Integrated offerings
Insulins, MAbs & Other
Biologics Biosimilars (Biologics &
Insulins)
Rapidly growing- India-centric
business
Branded Formulations
EMERGING MARKETS FOCUS EMERGING MARKETS FOCUS
Growth Verticals: Aligned with Shifting Paradigms
9

Aligning For Growth: Reorganizing for greater synergy
Function Based Organization -----> Business Units
Sustaining the Entrepreneurial Spirit: Agility in decision making Responsibility with Accountability Greater Synergy amongst functions: Aligning people to the greater goal
Marketing
Finance
Manufacturing
Small Molecules
Generic Insulins
Biosimilar MAbs
… …
Earlier Organization Structure New Organization Structure
10
R&D Branded Formulations

Growth Segments: Snapshot
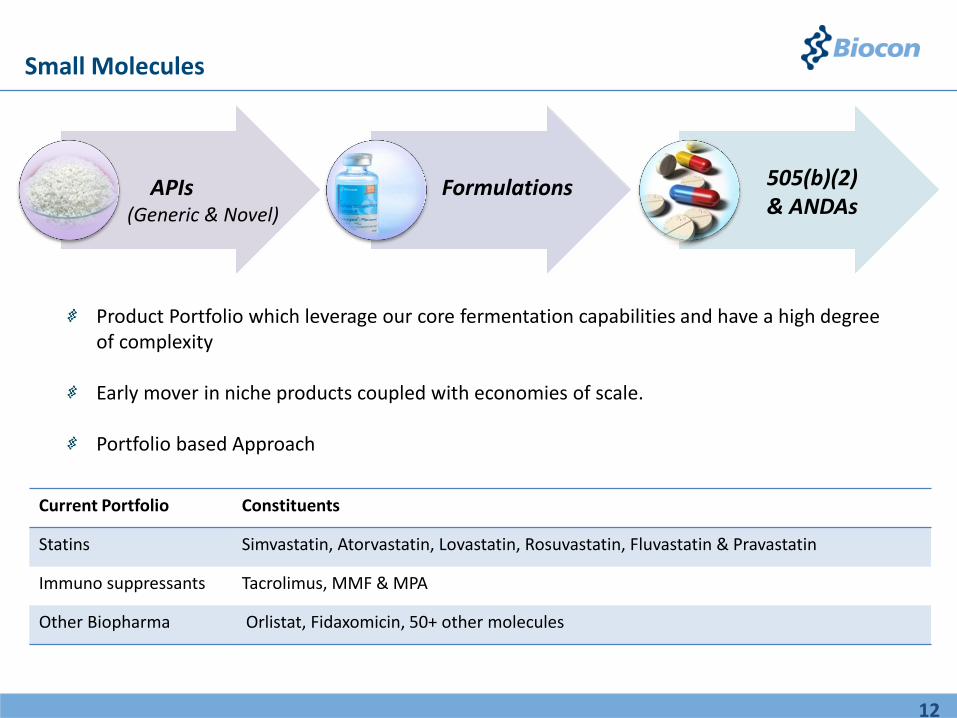
Small Molecules
APIs (Generic & Novel)
Formulations 505(b)(2) & ANDAs
Current Portfolio Constituents
Statins Simvastatin, Atorvastatin, Lovastatin, Rosuvastatin, Fluvastatin & Pravastatin
Immuno suppressants Tacrolimus, MMF & MPA
Other Biopharma Orlistat, Fidaxomicin, 50+ other molecules
Product Portfolio which leverage our core fermentation capabilities and have a high degree of complexity Early mover in niche products coupled with economies of scale. Portfolio based Approach
12
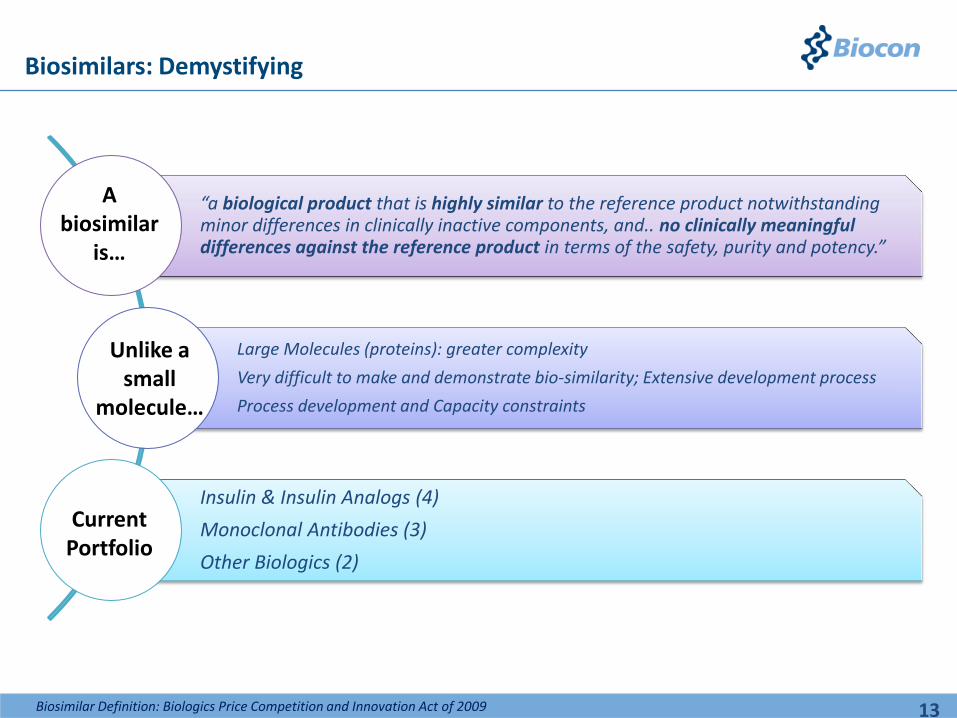
Biosimilars: Demystifying
“a biological product that is highly similar to the reference product notwithstanding minor differences in clinically inactive components, and.. no clinically meaningful differences against the reference product in terms of the safety, purity and potency.”
Large Molecules (proteins): greater complexity
Very difficult to make and demonstrate bio-similarity; Extensive development process
Process development and Capacity constraints
Insulin & Insulin Analogs (4)
Monoclonal Antibodies (3)
Other Biologics (2)
A biosimilar
is…
Unlike a small
molecule…
Current Portfolio
Biosimilar Definition: Biologics Price Competition and Innovation Act of 2009 13

Herceptin
~6 Bn, 18%
Avastin
~6 Bn, 18%
Enbrel
~8 Bn, 24%
Humira
~10 Bn,28%
Neulasta
~4 Bn, 12%
rh-Insulin
~ 3 Bn, 18%
Glargine
~7 Bn, 35%
Lispro
~2 Bn, 13%
Aspart
~4 Bn, 23%
Detemir
~2 Bn, 9% Glulisine
~0.3 Bn, 2%
Biosimilars: Opportunity
Total Insulins Market:
~ USD 19 Bn*
The Insulin Pie Biosimilar MAbs & Other Biologic
Opportunity : ~ USD 34 Bn*
*Market Size of innovator products MAT March 2013, All figures rounded off to nearest USD Billion, %ages on absolute numbers 14

Combines Biocon's R&D and manufacturing prowess of biologics with Mylan’s regulatory & commercialization
capabilities in the US and Europe
*Market Size of innovator products in the current portfolio: MAT March 2013
Generic Insulin Analogs Biosimilar MAbs & other Biologics
Global Market Size * ~ USD 14 Bn ~ USD 34 Bn
Portfolio Constituents Glargine, Lispro & Aspart Trastuzumab, Bevacizumab, Adalimumab,
Eternacept, Peg-filgrastim
Mylan’s Exclusive Commercialization Regions
US, Canada, Europe, Australia & New Zealand
All regulated markets
Upfront Received $ 20 Mn $ 18 Mn
Structure: Upfront Payment + Cost Sharing + Supplies + Profit Sharing#
Mylan and Biocon to share development and capital costs
#Profit Sharing Arrangement in regions where Mylan has exclusive commercialization rights
Biocon and Mylan have co-exclusive commercialization rights in other markets.
Co-Development & Commercialization Partnership
15
Biosimilars: Collaboration
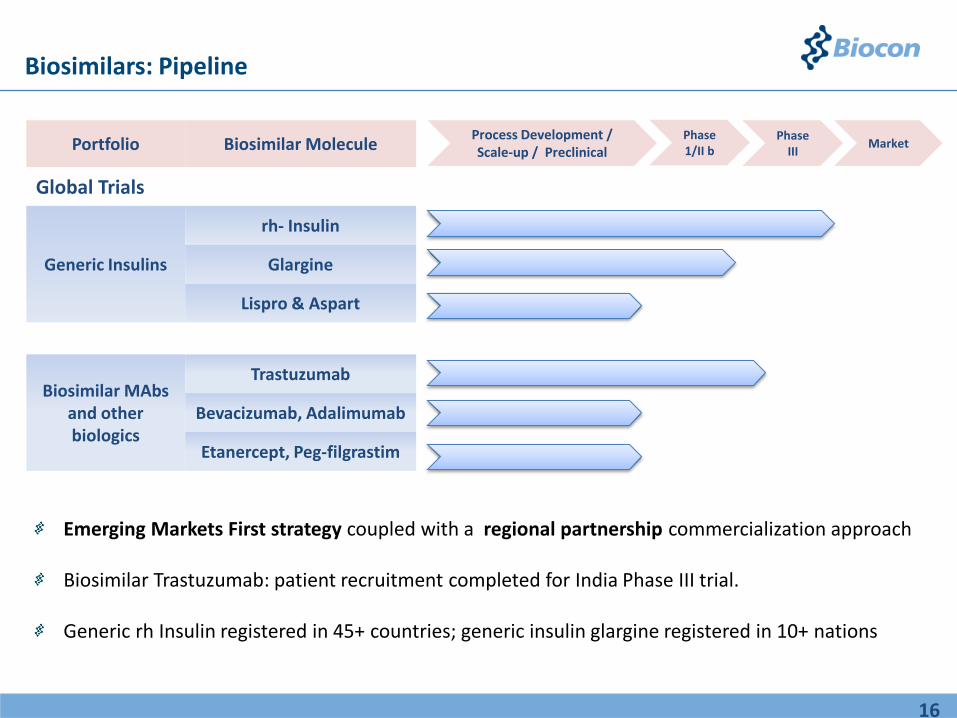
Portfolio Biosimilar Molecule
Global Trials
Generic Insulins
rh- Insulin
Glargine
Lispro & Aspart
Biosimilar MAbs and other biologics
Trastuzumab
Bevacizumab, Adalimumab
Etanercept, Peg-filgrastim
Process Development / Scale-up / Preclinical
Phase 1/II b
Market Phase
III
Emerging Markets First strategy coupled with a regional partnership commercialization approach Biosimilar Trastuzumab: patient recruitment completed for India Phase III trial. Generic rh Insulin registered in 45+ countries; generic insulin glargine registered in 10+ nations
16
Biosimilars: Pipeline

16
Biocon’s First Manufacturing expansion overseas : Iskandar, Johor
Asia’s largest integrated Insulins manufacturing facility
Investment to the tune of ~$ 160 Mn in the first phase
Development on-going at full steam
1st Phase expected to be completed by 2014
Key Highlights
Biosimilars: Malaysia Insulin Facility
17
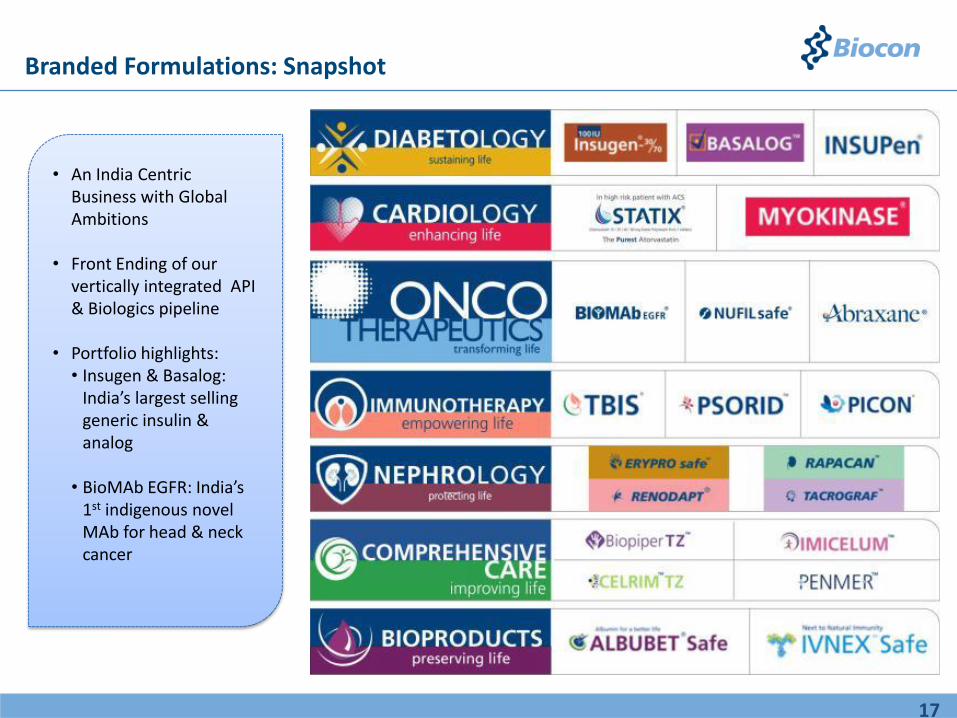
Branded Formulations: Snapshot
• An India Centric Business with Global Ambitions
• Front Ending of our vertically integrated API & Biologics pipeline
• Portfolio highlights: • Insugen & Basalog:
India’s largest selling generic insulin & analog
• BioMAb EGFR: India’s 1st indigenous novel MAb for head & neck cancer

INDIA PRODUCT RANKINGS#
Cardiology
Clotide 1
Myokinase 2
Oncotherapeutics
Evertor 1
BioMAb EGFR 2
Abraxane 3
Immunotherapy
Calpsor C, Picon, Tbis 2
Nephrology
Tacrograf 3
Bio-products
Ivnex 2
Comprehensive Care
Genpirome & Cegava TZ 2
#: ORG IMS Latest MAT 2013, IPSOS
Branded Formulations: Sustained Growth
18
65
86
259
347
101
FY 12 FY13 FY14
Revenues in ` crore
Q1

* Includes biosimilars # Market Share as per latest MAT reports, IPSOS, LASSCHN
Branded Formulations
19
Biologics*
Remaining Portfolio
India’s Fastest growing Insulin company
Biocon: 34% | Sanofi: 15% | Novo: 5%
#4 in overall insulin market
#3 in the 40 IU Insulin market
#1 in the Glargine vial market
Biocon’s Volume Market share#
100 IU Insulin: 21%
Glargine vials: 84%
79
130
179
107
130
169
186
259
347
FY11 FY12 FY13
Revenues in ` crore
Market Share # of other flagship brands:
BioMAb EGFR: 50%
Evertor: 46%
Picon: 33%
Calpsor C: 34%

Novel Molecules: Pipeline
Therapeutic Area Molecule
Oncology Nimotuzumab
Autoimmune Itolizumab
Diabetes IN-105
Oncology Anti CD – 20
Oncology Fusion Proteins
Pre-Clinical
Phase II
Phase 1
Market Phase
III Discovery
#
India Trials
Itolizumab: India Commercial Launch in Q2 FY14
Anti CD 20 (BVx 20) has entered the clinic in India
Multiple Global Trials planned for Oral Insulin in collaboration with BMS
20
Currently on hold

Biocon will continue global development of the molecule through Phase II via redesigned trials.
Partnership encompasses Financial, Strategic and Clinical Support throughout the development phase
BMS will have an exclusive option post phase II to further develop & commercialise the asset worldwide (excl. India)
Biocon will receive licensing fee in addition to potential regulatory & commercialization milestones, when BMS exercises its option
Combines Biocon's novel asset and development experience with BMS’ novel drug development,
regulatory & commercialization capabilities.
Novel Molecules: Collaboration
IN-105 Option Agreement: BMS (First-in-Class Oral Prandial Insulin)
21

Novel Molecules: Itolizumab Profile
First-in-Class Therapy :Novel MOA with an excellent safety profile
Very low Infection rates vis-à-vis other approved therapies
Modulates TH17 Pathway: Frontrunner in the hot bed of research in auto immune space
Marketing Approval received in India post a successful Phase III trial in Psoriasis (200+ patients); Commercial launch in Q2 FY14
Excellent clinical remission & safety data in phase III for Psoriasis
Promising preclinical and clinical efficacy data in other auto immune diseases (Rheumatoid Arthritis, Psoriatic Arthritis etc)
Key Differentiators
28 Weeks 12 Weeks Baseline
22

Research Services: Snapshot
2000
Today
India’s largest CRO with 1,500 + scientists, working with 16 of the Top 20 pharma
companies in the world. Capital Investment of ~$120 Mn
An investment of ~$20 Mn supported by 100+ scientists focused on building
a world class CRO
23

Customized models
Evolving Services
Niche Offerings
Integrated Platforms
o Bioanalytical testing of small and large molecules
o Antibody Drug Conjugate (ADC) development
o Unique In-Vivo Models- Human tumour tissue Xenograft
o Early and rapid toxicology evaluation (Cardiomyocytes )
o Commercial scale production of NCEs
o High potency (cytotoxic) API manufacturing
o Formulation development
o Dedicated/customized infrastructure
o End-to-end services
o Risk sharing: Milestone based
o Incubation: IP sharing
o Integrated Drug Discovery and Development
o Biologics Discovery and Development
o Syngene- Clinigene axis
Research Services: Capabilities & Collaboration Models
24

Research Services: Key Customers
o Dedicated Infrastructure: Abbott Nutrition and R&D Centre
o India focused product
development addressing local needs with customized offerings tailored to local taste & texture preferences
o Long term contract for 50+ FTEs focused on: • Maternal & Child Nutrition • Diabetes Care
o Dedicated Infrastructure: BMS Biocon Research Centre
o BMS’ largest research facility outside the US
o 7 years contract, currently in its 4th year of operations
o 450+ FTEs committed to integrated (end-to-end) research in a variety of therapeutic areas
25

72 88 124
155
318
410
557
FY 11 FY 12 FY 13 FY 14
Research Services: Performance
o PE Investment of ` 125 Crores for a 7.69% stake, assigning Syngene a post money valuation of `1,625 Crores
o Investment earmarked for enhancing Syngene’s service offerings, capacities & fund future growth
o GE brings in corporate best practices along with avenues for capability enhancement and new offerings
26
Revenues in ` crore
Q1
Financials

Revenue 1,194 260 1,493 318 1,858 407 2,148 445 2,538 467
R&D Spend 60 13 79 17 118 26 137 28 164 137
EBITDA 372 81 455 97 573 125 579 120 596 110
Net profit 238 52 273 58 340 74 338 70 509 94
EPS (FV: ` 5) 11.9 13.6 17.0 16.9 25.4
FY09 FY10 FY11 FY12
FY08-12: Avg.exch.rate in that fiscal : 1Q FY13: USD 1 = ` 55.86; 1Q FY14: USD 1= ` 54.64
# Biopharma Sales excluding branded Formulations
Financial Performance
Q1 FY14 Q1 FY13
Revenue 723 | 129 593 | 108
R&D Spends 43 | 8 36 | 6
% of Biopharma Sales # 10% 10%
EBITDA 175| 31 139 | 25
EBITDA Margin 24% 23%
Net Profit 94| 17 79 | 14
PAT Margin 13% 13%
EPS 4.7 3.9
All Figures in ` Crore / USD Mn except EPS
FY13
28

349
432
86
101 122
155 593
723
Q1 FY13 Q1 FY14
Regulated Markets*
56% India 28%
RoW 16%
Revenue: Detailed
29
All Figures in ` crore unless otherwise specified
Core Biopharma
Licensing
Branded Formulations
Research Services
Other Income
Geography Wise Sales Breakup:
` 723
*: Including Deemed Exports

Core Business Margins: Detailed
FY 09 FY 10 FY 11 FY 12 FY 13 Q1 FY14
Revenue 1,194 1,493 1,858 2,148 2,538 723
Less: Other Income 54 32 52 99 110 28
Less: Licensing Income 12 51 153 127 25 8
Core Revenues 1,127 1,410 1,654 1,922 2,403 687
EBITDA 372 455 573 579 596 175
Add: R&D Expense 60 79 118 137 164 43
Less: Other Income 54 32 52 99 110 28
Less: Licensing Income 12 51 153 127 25 8
Net EBITDA 365 450 487 490 625 182
EBITDA Margin 32% 32% 29% 25% 26% 26%

Outlook

49%
5%
20% 10%
10% 40%
10%
25%
20%
5%
30%
20%
25%
20%
5%
FY 12 A
2015 E
2018 E
Small Molecules
Biosimilars (Insulins + MAbs)
Research Services
Branded Formulation
Licensing & Other Income
~ $450 Mn
$1 Billion +
~ $700 Mn
31
Targeting $1 Bn Revenues in 5 Years
Exchange Rate: 1 USD =` 50

• Commercialization of generic rh-Insulin in regulated markets
• Launch of generic insulin glargine in large semi-regulated markets
• Commercialization of biosimilar trastuzumab in India & other emerging markets
• Clinical development of generic rh-Insulin for US
Biosimilars: Global Development & Commercialization
• Generic insulin plant in Malaysia comes on stream: augmenting capacity and cost advantage
• Research Services add further facilities & capabilities to catalyze the next growth wave
Capacity Enhancement
• Development/Commercialization partnership in developed markets: generic rh-insulin, Itolizumab
• Emerging Market partnerships for small molecules & biosimilars
Partnerships
Key Milestones: 2015 E
32

o Small Molecules - Improved product Mix o Research Services - Sustained Growth Momentum
o Branded Formulations - Differentiated Value offerings
o Biosimilars - Geographical Expansion in regulated markets
o Novel Molecules - Out-licensing and Global Development
Growth drivers supplemented by addition of new offerings (products, services & partnerships)
Reaching $1 Bn by 2018
33
Looking Ahead
30%
20%
25%
20%
5%
Exchange Rate: 1 USD =` 50

• Continuous evolution of the biosimilar & therapeutic regulatory landscape in major regulated markets
• Regulatory approvals, Patient enrollment, R&D development, process refinement etc. determine the pace and quantum of the R&D activities
Biosimilars & Novel Molecules: Regulatory Clarity
• Relationship management: New Contracts, Contract Renewal & Scope Expansion
R&D Outsourcing: Research Services
Partnership Management
34
Risks…

www.biocon.com
Innovative Science Affordable Medicine
Investor Contact: Saurabh Paliwal Sweta Pachlangiya [email protected] [email protected]

APPENDIX

~955
~70
~180 ~1,205
2011 A DevelopedMarkets
Emerging Markets 2016 E
USD Bn
~ 5% CAGR
Global Pharma Market
Source: IMS Institute of Healthcare informatics,The Global Use of Medicines: Outlook Through 2016
Emerging Markets to contribute ~ 75% of the Total Pharma Growth by 2016
Global Pharma Spending expected to cross $1.2 Trillion by 2016 Emerging Markets projected growth CAGR: ~10%
Developed Markets expected growth CAGR: ~2%
Emerging Markets growth driven by:
Increased Government Healthcare Spending Growing Affluence
Global Pharma Growth Catalyst: Emerging Markets
37

*includes: OTC, diagnostics and non-therapeutics sales worth $118 Bn in 2011 and $145 Bn in 2016 E
Global Pharma Growth Catalyst: Generics & Biosimilars
Source: IMS Institute for Healthcare Informatics, IMS Market Prognosis, May 2012
Small Molecules,
~ 425
Biosimilars~5
Small Molecules,
~ 241
Biosimilars ~ 1
Generic Spending to Increase by ~75% in the next 5 years vs. Branded drugs’ growth of 9%
Biosimilars will grow 5 fold to $5 Bn
956
~1,205
USD Bn
Branded* 714
Branded* 745
Generic 242
Generic 430
2011 2016 E
Back 38

Small Molecules & Biosimilars: Comparison (1)
Small Molecules Molecular Weight: Less than 700 Daltons
Synthetic, Organic compounds
[Chemistry based products]
Well defined structure & relatively stable
Monoclonal Antibody Molecular Weight: ~150,000 Daltons (~250x in size)
Biologics- prepared in living organisms
[Proteins]
Complex physiochemical characteristics & heat sensitive
39

Small Molecules & Biosimilars: Comparison (2)
Regulatory Requirements
PK/PD (establishing BA/BE)
CMC Studies
Clinical Trial
PK/PD studies
Preclinical studies
Biological Characterization
Physio-chemical Characterization
Generics: Small Molecules Biosimilars
40

Biosimilars: Regulatory Landscape
41

~61% | Promoters ~ 8 % | Employees & ESOP trust ~31 % | Public
Biocon
Business Structure & Holdings
Syngene International, India | ~88% Custom research, drug discovery
Clinigene International, India | 100% Clinical development
Biocon Research , India | 100% R&D- Novel Molecules Biocon Biopharmaceuticals | 100% MAbs and Biosimilars Biocon Sdn. Bhd, Malaysia | 100% Overseas subsidiary Biocon SA, Switzerland | 100% Overseas subsidiary
NeoBiocon, UAE | 50% Overseas subsidiary
BIOPHARMA SUBSIDIARIES
RESEARCH SERVICES
Spanning the entire Value Chain with capabilities ranging from discovery to manufacturing
42