Embed Size (px)
Citation preview
Dr. R. VENKITACHALAM
Contents
Introduction
Classification of bias
Bias in clinical trials
Bias in qualitative research
Case scenarios
Summary and conclusion
References
Introduction
Bias is a fundamental concept in epidemiology
It is defined as ‘deviation of results or inferences from the truth , or processes leading to such deviation’
- Grimes and Schulz, 2002
It is the result of errors not random but systematic results invalid
Results mainly from faulty design
Scientifically speaking, bias can be explained as:lack of internal validity or incorrect assessment of the
association between an exposure and an effect in the target population in which the statistic estimated has an expectation that does not equal the true value.
Delgado-Rodríguez M, Llorca J. Bias. J Epidemiol Community Health. 2004 Aug 1;58(8):635–41.

Etymology
mid 16th century (in the sense ‘oblique line’; also as an adjective meaning ‘oblique’): from French biais, from Provençal, perhaps based on Greek epikarsios ‘oblique’.
Classification of bias
Several classifications of bias exist in literature. Prominent among them are:
1. Sackett (19 types) and Choi (65 types) – based on stages of research
2. Maclure and Schneeweiss – causal diagram theory3. Kleinbaum et al – three main groups (selection, information
and confounding)4. Steineck and Ahlbom – misclassification, misrepresentation
and analysis deviation

Maclure and Schneeweiss episcope of bias
WHO classification
Selection bias Occurs from the manner in which study population is
selected Most common type of bias in health research Seen in observational and analytical studies
Ascertainment or information bias Occurs due to measurement error or misclassification of
subjects according to one or more variables

WHO classification
Health research methodology - A Guide for training in Research methods. Second edition. WHO
Bias
Selection bias
Prevalence –incidence bias
Admission rate bias
Non-response bias
Information bias
Diagnostic bias
Recall bias
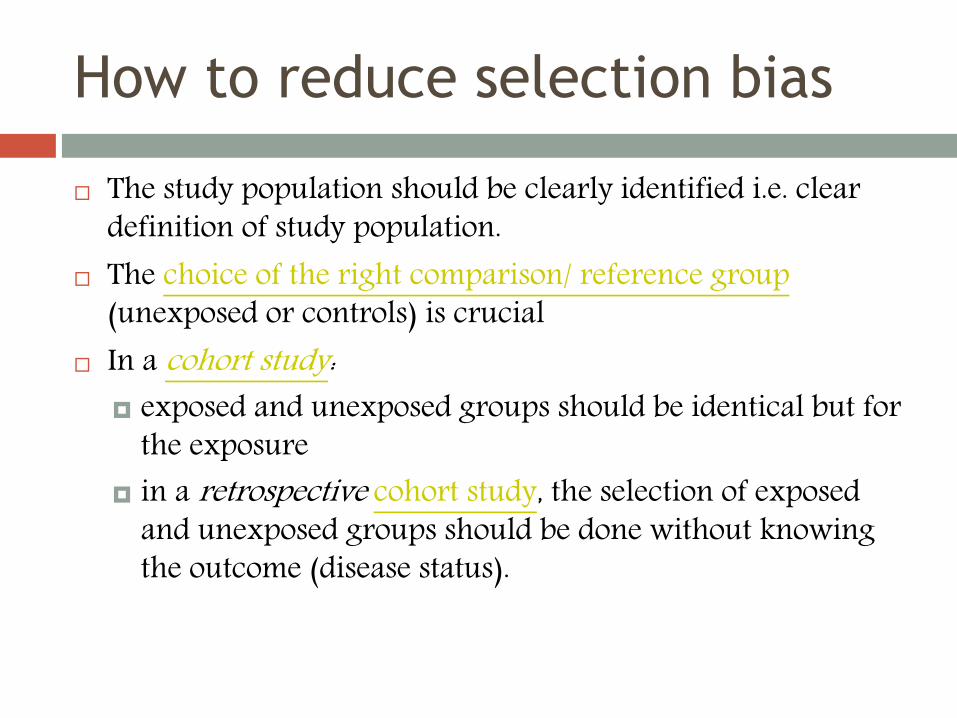
How to reduce selection bias
The study population should be clearly identified i.e. clear definition of study population.
The choice of the right comparison/ reference group(unexposed or controls) is crucial
In a cohort study: exposed and unexposed groups should be identical but for
the exposure in a retrospective cohort study, the selection of exposed
and unexposed groups should be done without knowing the outcome (disease status).

In a case-control study: the control group should reflect the exposure of the
population which gave rise to the cases controls should be selected independently of the exposure
status precise case definition and exposure definition should be
used by all investigators. In a clinical trial:
Randomization and allocation concealment from the investigator
How to reduce information bias
Blinding Placebo arm in case of RCT’s
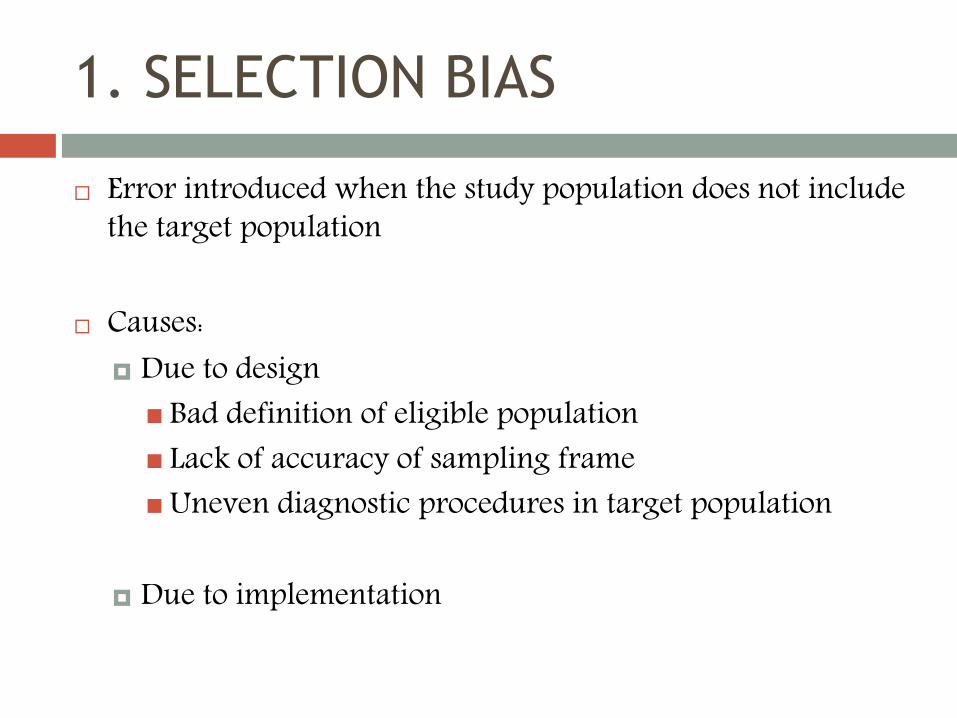
1. SELECTION BIAS
Error introduced when the study population does not include the target population
Causes: Due to design Bad definition of eligible population Lack of accuracy of sampling frameUneven diagnostic procedures in target population
Due to implementation

1.1 Inappropriate definition of
eligible population
Occurs when kind of patients gathered does not represent the cases originated in the population
It is of the following types:
1.1.a – Competing risks bias When two or more outputs are mutually exclusive, any of
them competes with each other in the same subject. Eg: death
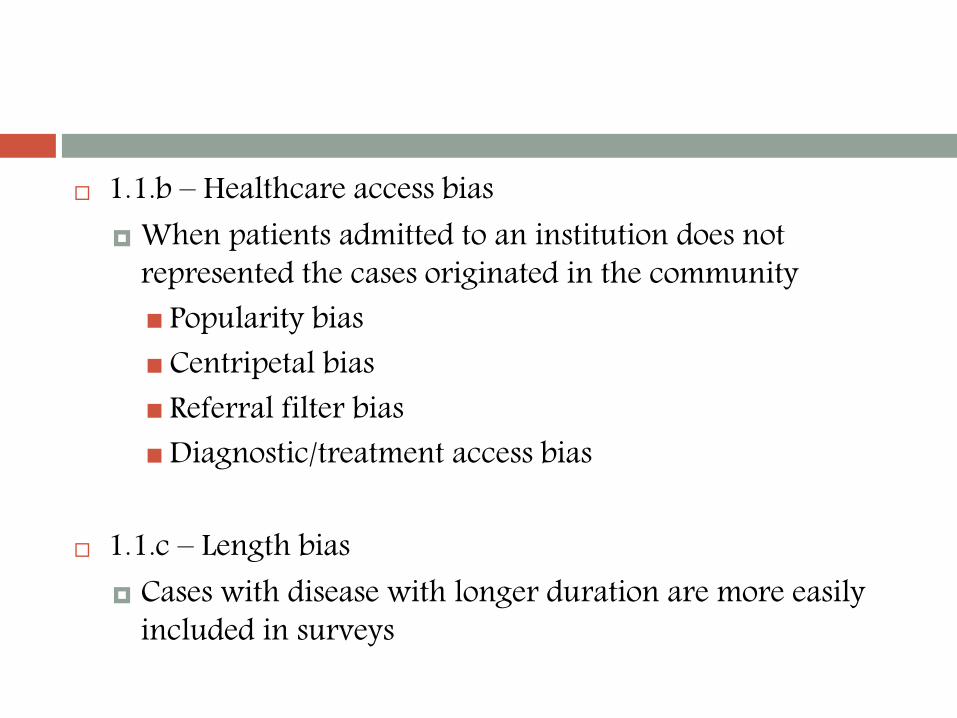
1.1.b – Healthcare access bias When patients admitted to an institution does not
represented the cases originated in the community Popularity bias Centripetal bias Referral filter biasDiagnostic/treatment access bias
1.1.c – Length bias Cases with disease with longer duration are more easily
included in surveys

1.1.d - Neyman bias When a series of survivors is selected, if the exposure is
related to prognostic factors, or the exposure itself is a prognostic determinant , the sample of cases offers a distorted frequency of exposure.
1.1.e – Spectrum bias In the assessment of validity of a diagnostic test, this bias is
produced when researchers include only clear or definite cases, not representing the whole spectrum of disease. Also applicable for controls
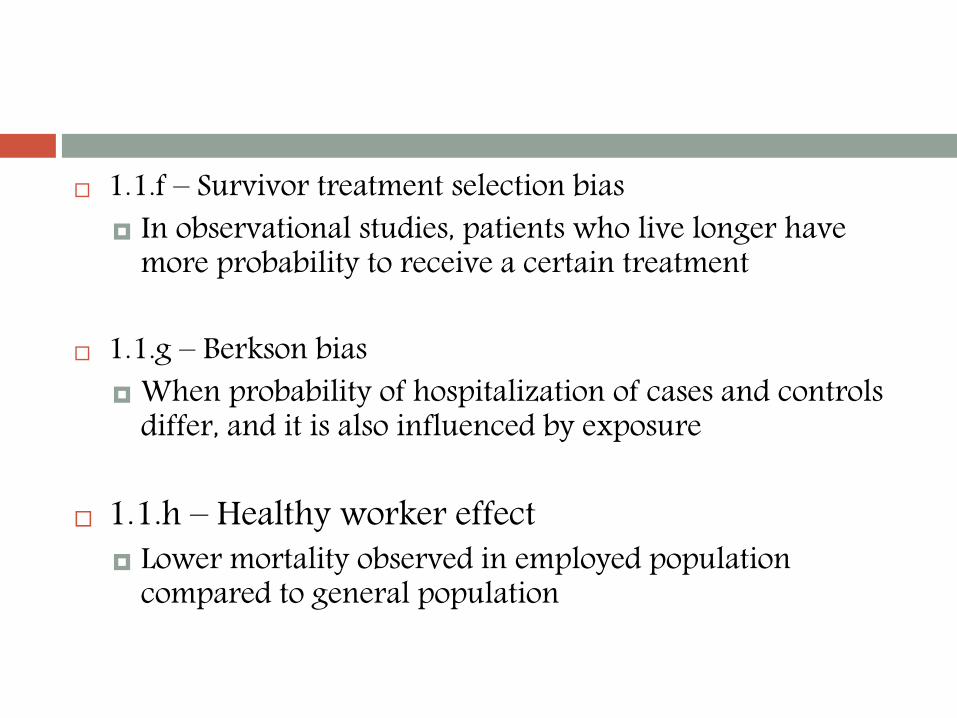
1.1.f – Survivor treatment selection bias In observational studies, patients who live longer have
more probability to receive a certain treatment
1.1.g – Berkson bias When probability of hospitalization of cases and controls
differ, and it is also influenced by exposure
1.1.h – Healthy worker effect Lower mortality observed in employed population
compared to general population
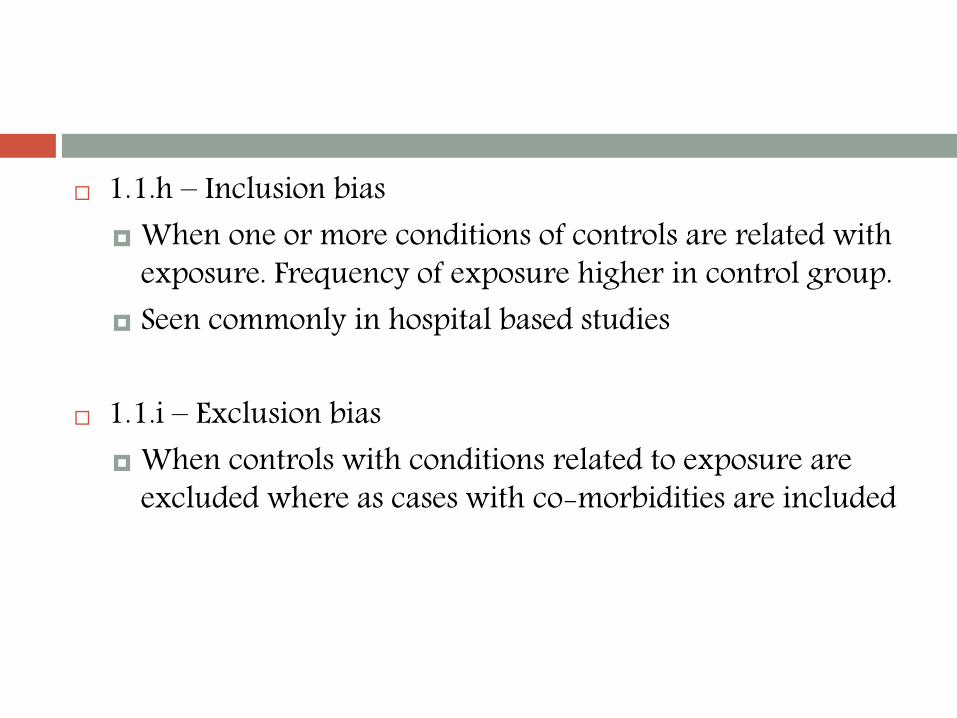
1.1.h – Inclusion bias When one or more conditions of controls are related with
exposure. Frequency of exposure higher in control group. Seen commonly in hospital based studies
1.1.i – Exclusion bias When controls with conditions related to exposure are
excluded where as cases with co-morbidities are included

1.2 lack of accuracy of sampling
frame
1.2.a – Non random sampling bias Results in non-representative sample
1.2.b – telephone random sampling bias Excludes some households from the sample . . Coverage
issues
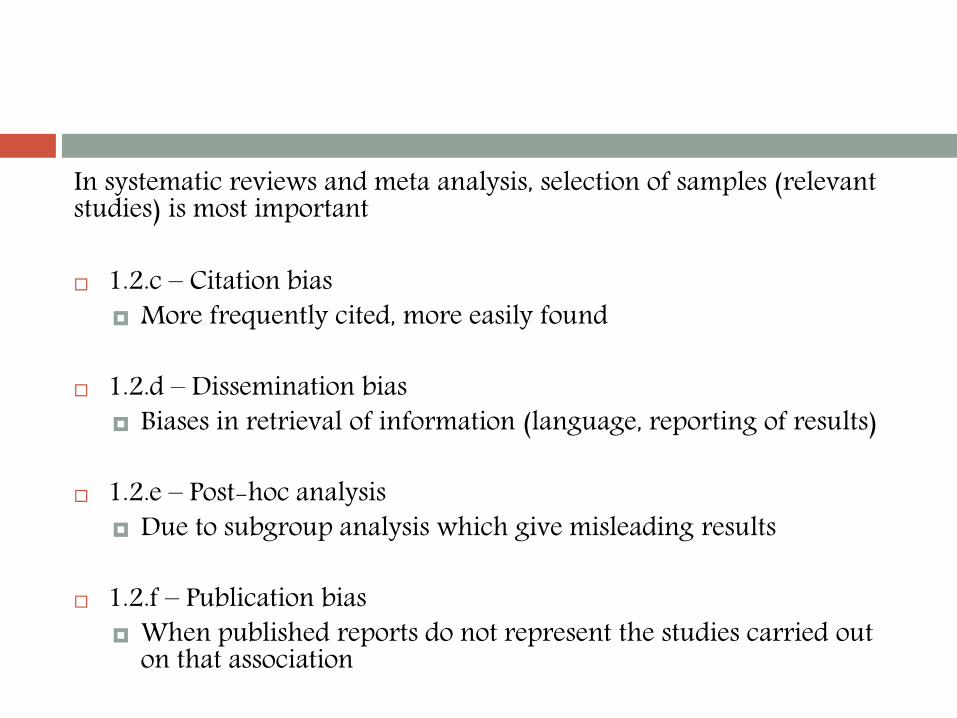
In systematic reviews and meta analysis, selection of samples (relevant studies) is most important
1.2.c – Citation bias More frequently cited, more easily found
1.2.d – Dissemination bias Biases in retrieval of information (language, reporting of results)
1.2.e – Post-hoc analysis Due to subgroup analysis which give misleading results
1.2.f – Publication bias When published reports do not represent the studies carried out
on that association

1.3 uneven diagnostic procedures
In case control studies, if exposure influences diagnosis of disease, detection bias occurs
1.3.a – diagnostic suspicion bias Exposure is taken as a diagnostic criterion
1.3.b – Mimicry bias When benign conditions mimic clinically to the disease
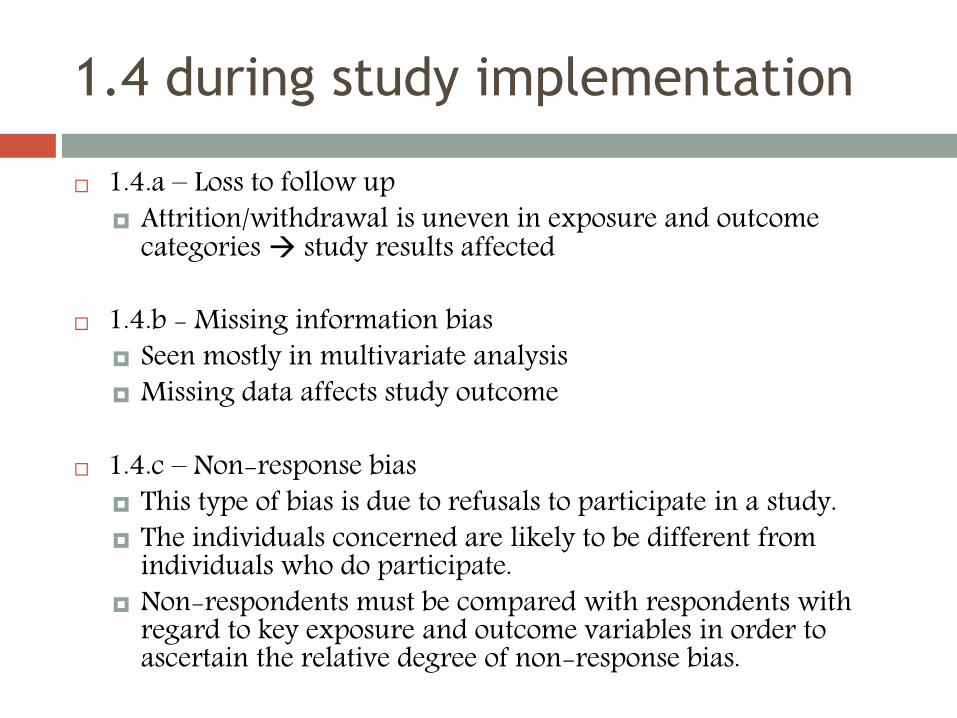
1.4 during study implementation
1.4.a – Loss to follow up Attrition/withdrawal is uneven in exposure and outcome
categories study results affected
1.4.b - Missing information bias Seen mostly in multivariate analysis Missing data affects study outcome
1.4.c – Non-response bias This type of bias is due to refusals to participate in a study. The individuals concerned are likely to be different from
individuals who do participate. Non-respondents must be compared with respondents with
regard to key exposure and outcome variables in order to ascertain the relative degree of non-response bias.

2. INFORMATION BIAS
It occurs during data collection.
Three types of information bias are: Misclassification bias Ecological fallacy bias Regression to the mean bias
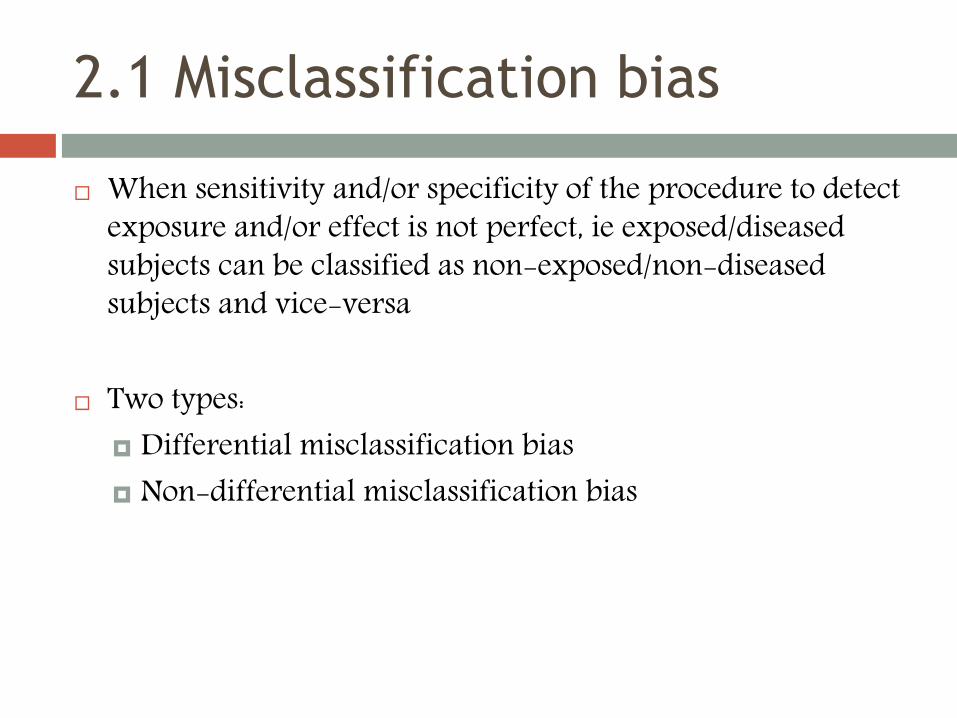
2.1 Misclassification bias
When sensitivity and/or specificity of the procedure to detect exposure and/or effect is not perfect, ie exposed/diseased subjects can be classified as non-exposed/non-diseased subjects and vice-versa
Two types: Differential misclassification bias Non-differential misclassification bias

2.1.a – Detection bias Seen in studies with follow-up (cohort, clinical trials)
2.1.b – Observer/Interviewer bias Knowledge of hypothesis, disease status, exposure status or
intervention received can influence data recording Interviewers can influence errors into a questionnaire or
guide the respondents to a particular answer.
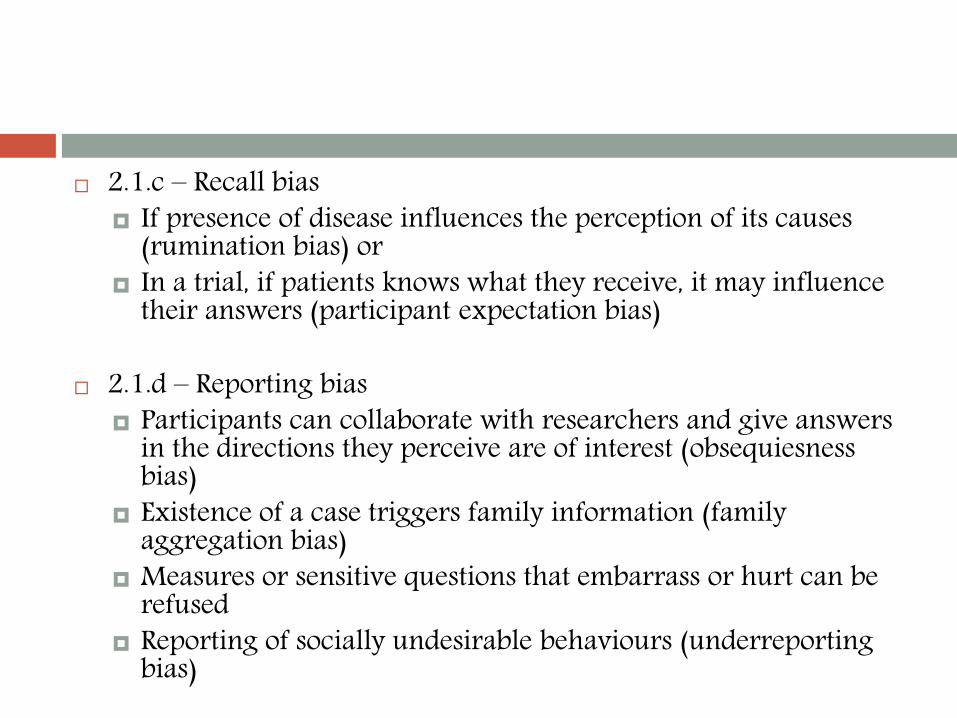
2.1.c – Recall bias If presence of disease influences the perception of its causes
(rumination bias) or In a trial, if patients knows what they receive, it may influence
their answers (participant expectation bias)
2.1.d – Reporting bias Participants can collaborate with researchers and give answers
in the directions they perceive are of interest (obsequiesnessbias)
Existence of a case triggers family information (family aggregation bias)
Measures or sensitive questions that embarrass or hurt can be refused
Reporting of socially undesirable behaviours (underreporting bias)
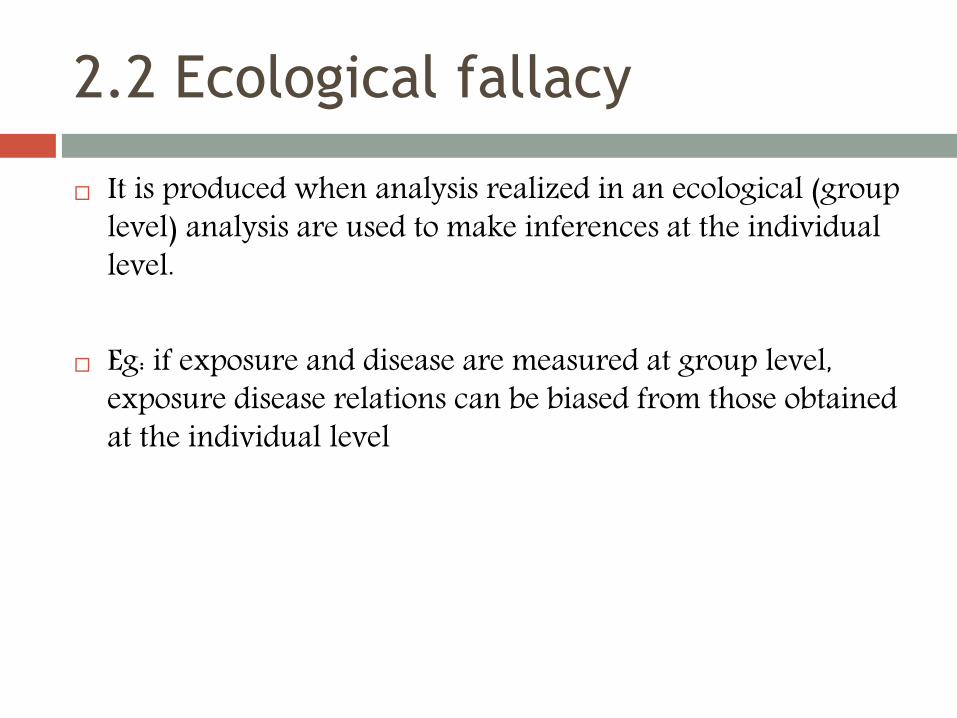
2.2 Ecological fallacy
It is produced when analysis realized in an ecological (group level) analysis are used to make inferences at the individual level.
Eg: if exposure and disease are measured at group level, exposure disease relations can be biased from those obtained at the individual level

2.3 Regression to the mean
It is a phenomenon that a variable that shows an extreme value on its first assessment will tend to be closer to the centre of its distribution on a later measurement.
Eg: high cholesterol level measurement
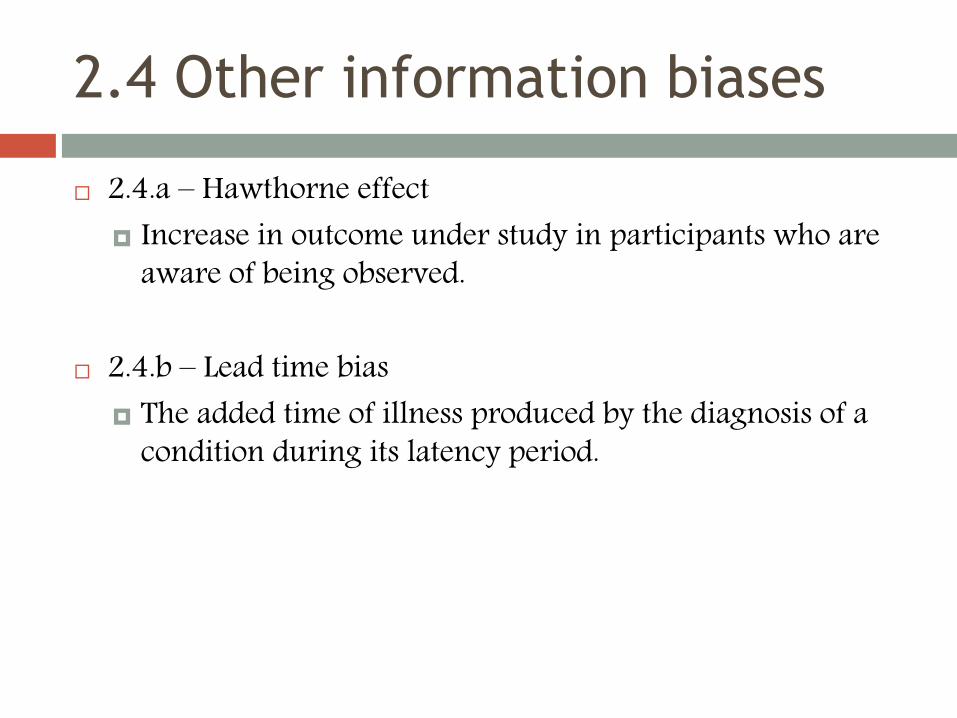
2.4 Other information biases
2.4.a – Hawthorne effect Increase in outcome under study in participants who are
aware of being observed.
2.4.b – Lead time bias The added time of illness produced by the diagnosis of a
condition during its latency period.

2.4.c – protopathic bias When an exposure is influenced by early (subclinical)
stages of disease Sick quitter bias: People with risky behaviours (eg: alcohol
consumption) quit their habit as a consequence of disease . . Which will mention them as non-exposed
2.4.d – temporal ambiguity When it cannot be established that exposure precedes
effect. Seen in cross-sectional and ecological studies

2.4.e – Will Rogers phenomenon Improvement in diagnostic tests refines disease staging in
diseases such as cancer It is seen when survival rates are measured across time
and even among centres with different diagnostic capabilities
2.4.f – Work-up bias (verification bias) In the assessment of validity of a diagnostic test, it is
produced when the execution of gold standard is influenced by the results of the assessed test, ie reference test is less frequently performed when the test result is negative
3. Confounding
It occurs when a variable is a risk factor for an effect among non-exposed persons and is associated with the exposure of interest in the population from which the effect derives, without being affected by the exposure or the disease
Confounding can occur in every epidemiological study
Susceptibility bias is a synonym
Confounding can be neutralised at the design stage of a research (for example, by matching or randomisation) and/or at the analysis, given that the confounders have been measured properly
3.1 - Confounding by group: It is produced in an ecological study, when the exposure
prevalence of each community (group) is correlated with the disease risk in non-exposed of the same community

3.2 - Confounding by indication This is produced when an intervention (treatment) is indicated by
a perceived high risk, poor prognosis, or simply some symptoms. Here the confounder is the indication, as it is related to the intervention and is a risk indicator for the disease

4. Specific biases in trials
4.1 – allocation of intervention bias Seen in non-randomised trials when sequence of
allocation is known in advance or concealment is unclear/inadequate
4.2 – compliance bias In trials requiring adherence to intervention, the degree of
adherence (compliance) influences efficacy assessment of the intervention

4.3 – Contamination bias When intervention-like activities find their way into
control group Seen in community based trials due to relationships
among members and interference by mass media etc
4.4 – Lack of intention to treat analysis In RCT’s, analysis should be done keeping participants in
the group originally assigned to. Otherwise, bias results . . .
Publication bias
Scientific journals are most likely to accept studies that have ‘positive findings’ than those with ‘negative findings’.
Creates false impression in the literature and may cause long-term consequences to the scientific community
To overcome this bias, several journals have been launched which publish only negative findings.
Eg: Journal of Pharmaceutical Negative Results, Journal of Negative Results in Biomedicine, Journal of Interesting Negative Results
BIAS in clinical trials

Selection biasAscertainment
bias

Other biases
in RCT’s
Planning phase
During conduct
During
Reporting
During dissemination
of results
During uptake
of results

During planning phase
Choice of question bias
Regulation bias
Wrong design bias
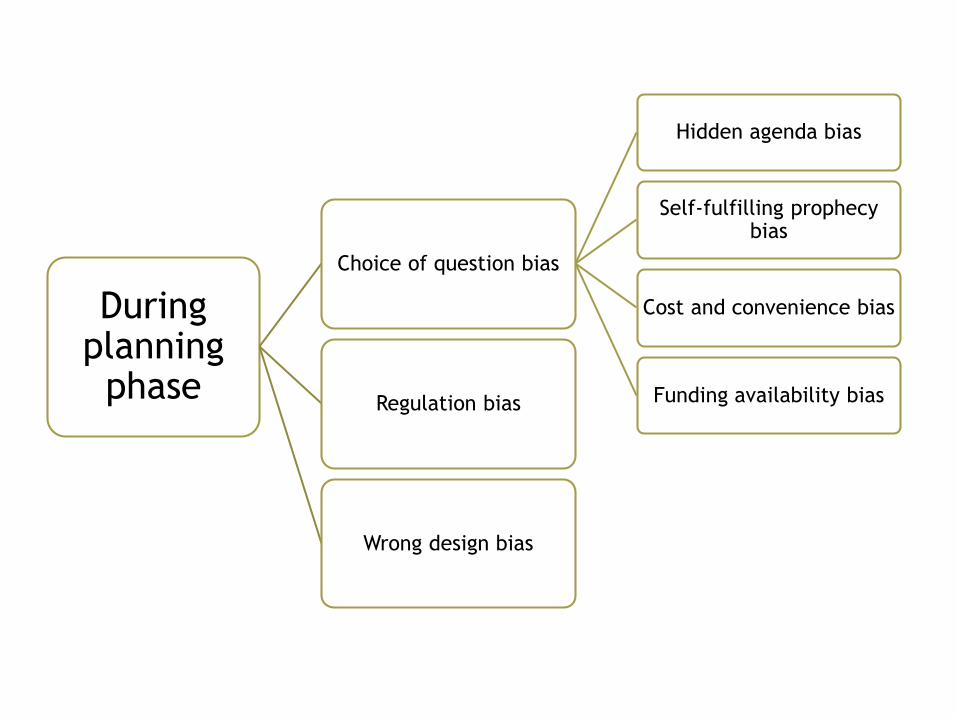
During planning
phase
Choice of question bias
Hidden agenda bias
Self-fulfilling prophecy bias
Cost and convenience bias
Funding availability biasRegulation bias
Wrong design bias

During planning
phase
Choice of question bias
Regulation bias
IRB/Bureaucracy bias
Complicated informed consent
Wrong design bias

During planning
phase
Choice of question bias
Hidden agenda bias
Self-fulfilling prophecy bias
Cost and convenience bias
Funding availability bias
Regulation bias
IRB/Bureaucracy bias
Complicated informed consent
Wrong design bias
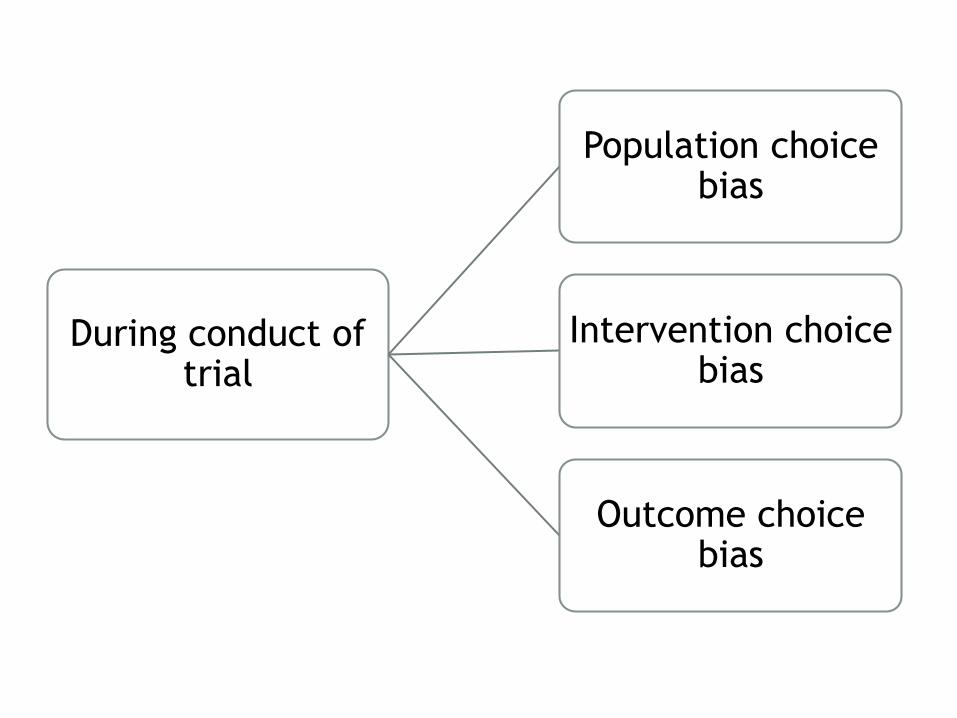
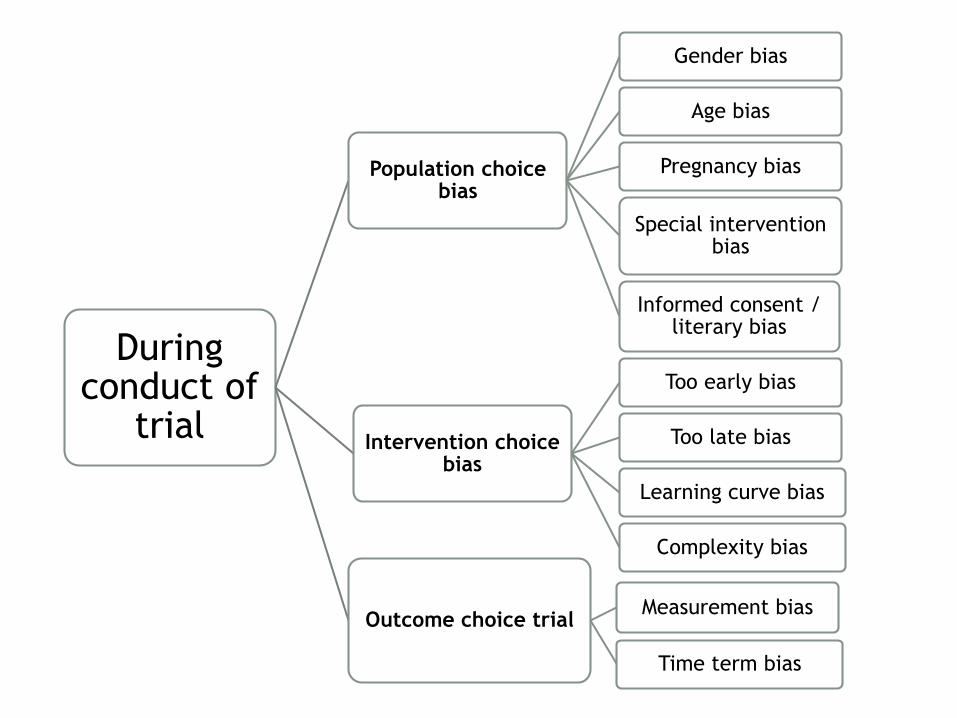
During conduct of trial
Population choice bias
Intervention choice bias
Outcome choice bias
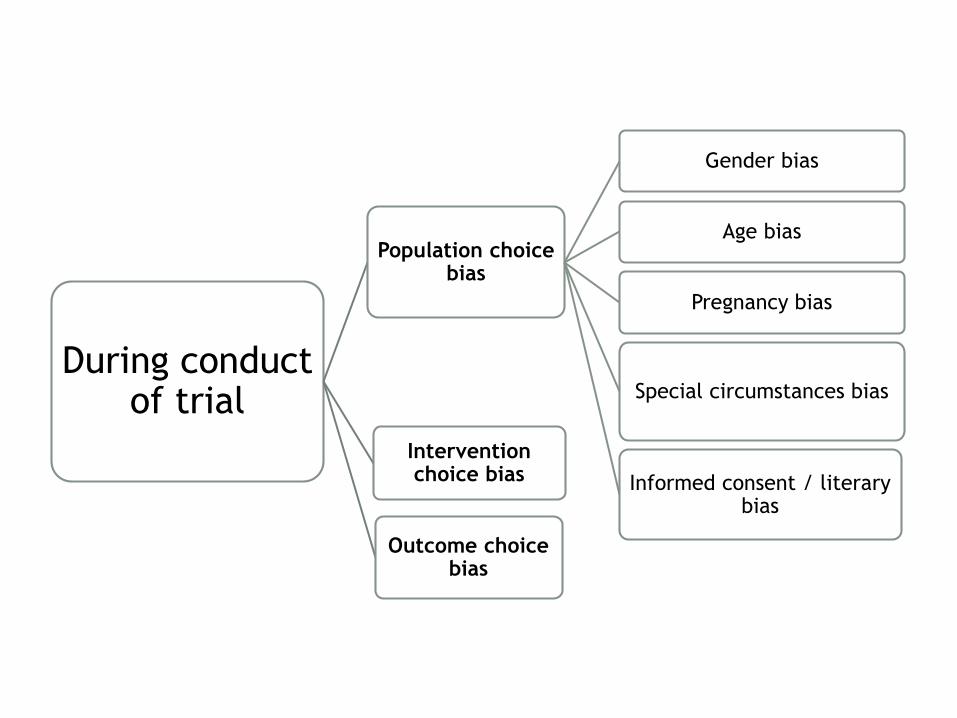
During conduct of trial
Population choice bias
Gender bias
Age bias
Pregnancy bias
Special circumstances bias
Informed consent / literary bias
Intervention choice bias
Outcome choice bias

During conduct of
trial
Population choice bias
Intervention choice bias
Too early bias
Too late bias
Learning curve bias
Complexity bias
Outcome choice trial
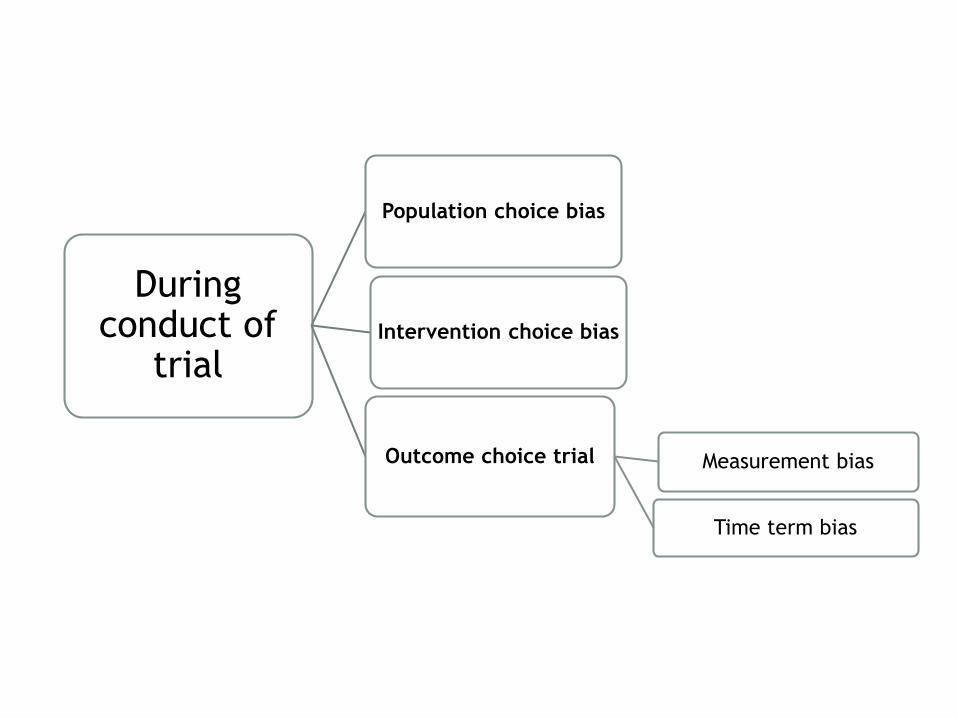
During conduct of
trial
Population choice bias
Intervention choice bias
Outcome choice trial Measurement bias
Time term bias
During conduct of
trial
Population choice bias
Gender bias
Age bias
Pregnancy bias
Special intervention bias
Informed consent / literary bias
Intervention choice bias
Too early bias
Too late bias
Learning curve bias
Complexity bias
Outcome choice trialMeasurement bias
Time term bias
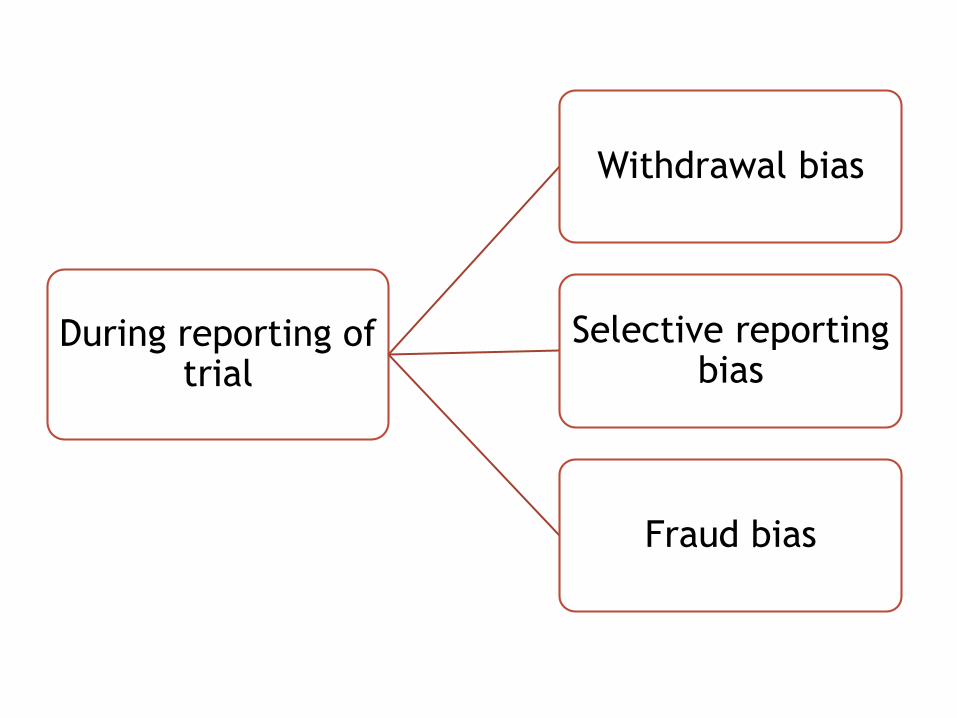
During reporting of trial
Withdrawal bias
Selective reporting bias
Fraud bias
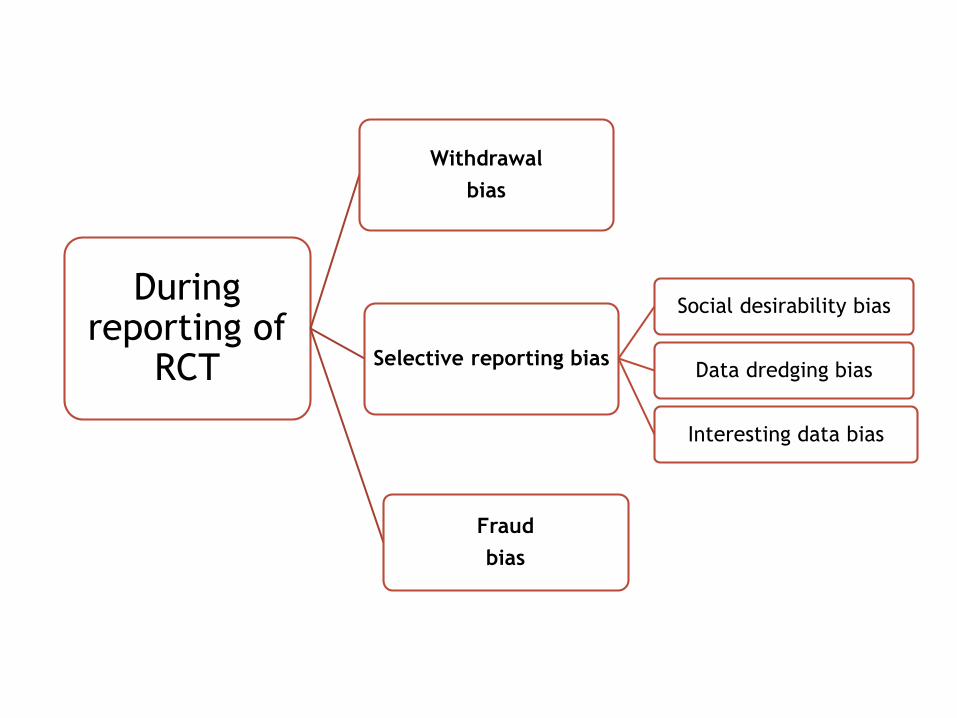
During reporting of
RCT
Withdrawal
bias
Selective reporting bias
Social desirability bias
Data dredging bias
Interesting data bias
Fraud
bias

During dissemination
of results
Publication bias
Language biasCountry of
publication bias
Time lag bias

During uptake of
RCT
Relation to author bias
Rivalry bias
I owe him bias
Personal habit bias
Morals and values bias
Clinical practice bias
Institution bias
Territory bias
Tradition biasDo something bias
Printed word bias
Prestigious journal bias
Peer review bias

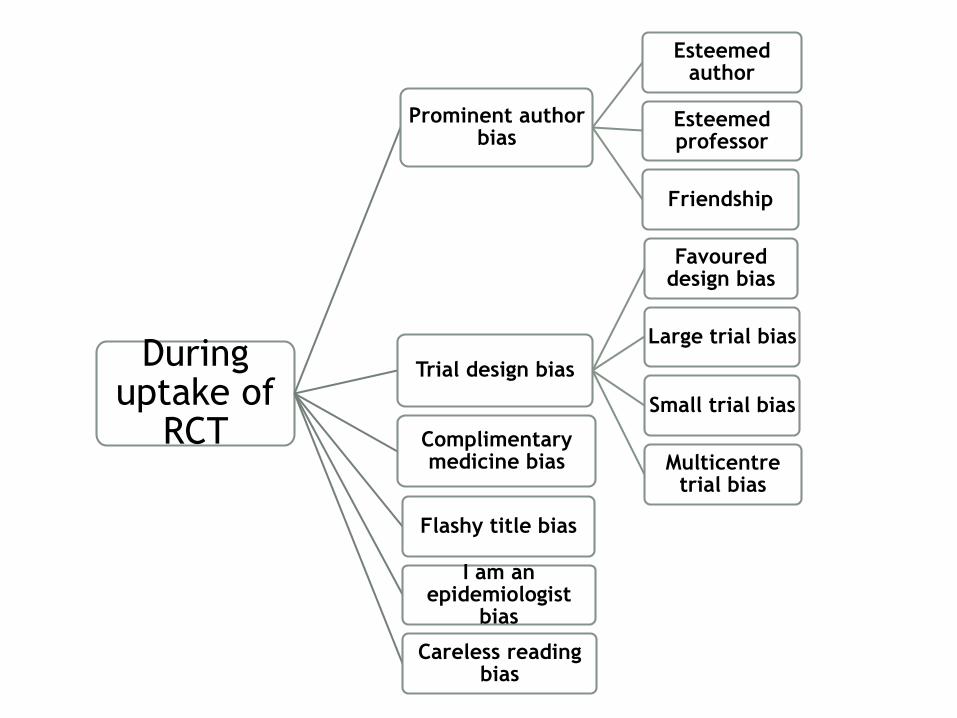
During uptake of RCT
Prominent author bias
Trial design bias
Complimentary medicine bias
Flashy title bias
Careless reading bias
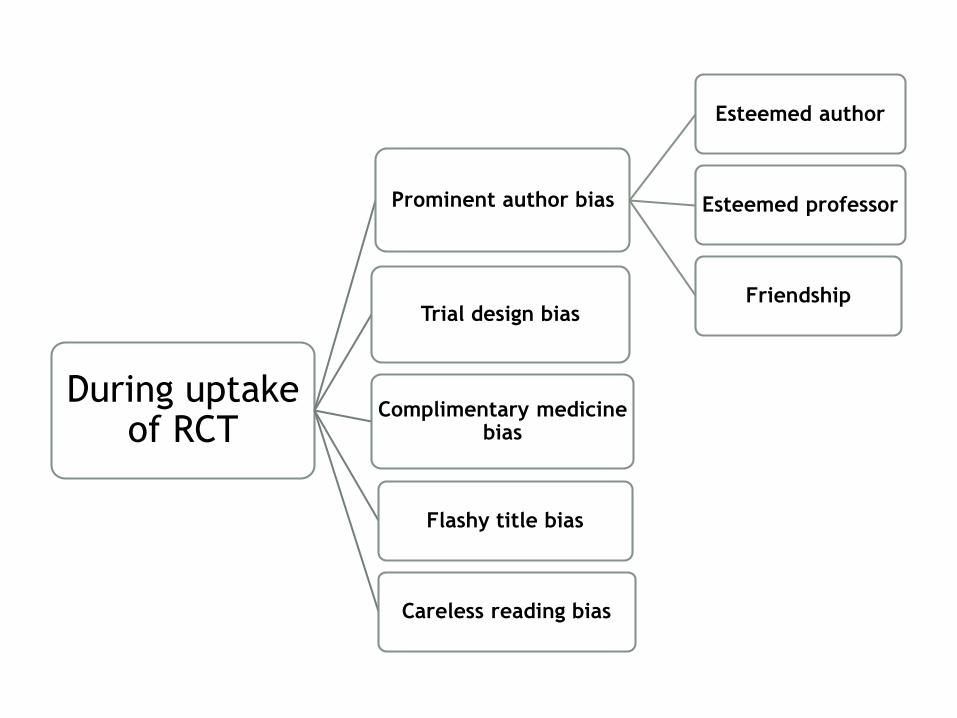
During uptake of RCT
Prominent author bias
Esteemed author
Esteemed professor
FriendshipTrial design bias
Complimentary medicine bias
Flashy title bias
Careless reading bias

During uptake of RCT
Prominent author bias
Trial design bias
Favoured design bias
Large trial bias
Small trial bias
Multicentre trial bias
Complimentary medicine bias
Flashy title bias
Careless reading bias
During uptake of
RCT
Prominent author bias
Esteemed author
Esteemed professor
Friendship
Trial design bias
Favoureddesign bias
Large trial bias
Small trial bias
Multicentretrial bias
Complimentary medicine bias
Flashy title bias
I am an epidemiologist
bias
Careless reading bias
BIAS in qualitative research

BIAS in qualitative research
In qualitative research, bias affects validity and reliability of findings and thus the results
Categories of biases seen in qualitative research are: Moderator bias Biased questions Biased answers Biased sampling Biased reporting

Moderator bias
The moderator’s facial expressions, body language, tone, manner of dress, and style of language may introduce bias.
Similarly, the moderator’s age, social status, race, and gender can produce bias.
Some conditions unavoidable, still some can be controlled

Biased questions
Leading question bias Misunderstood question bias Unanswerable question bias Question order bias. Always ask:
general questions before specific questions unaided before aided questions positive questions before negative questions behavior questions before attitude questions

Biased answers
Consistency bias Dominant respondent bias Error bias Hostility bias Moderator acceptance bias Mood bias Overstatement bias Reference bias Sensitivity bias Social acceptance bias Sponsor bias

Biased sampling
Due to errors in sampling. Professional respondents should be avoided
Biased reporting
Experiences, beliefs, feelings, wishes, attitudes, culture, views, state of mind, reference, error, and personality can bias analysis and reporting.

Case scenarios

Scenario 1
Investigators recruited both cases and controls from a defined catchment area in the general population. This is often difficult to do in the absence of a comprehensive registry. Suppose investigators had recruited all cases of oral cancer from a comprehensive national registry, between August 1, 2013 to July 31, 2014. What bias might be intoduced if controls were obtained from the catchment area?
Selection Bias
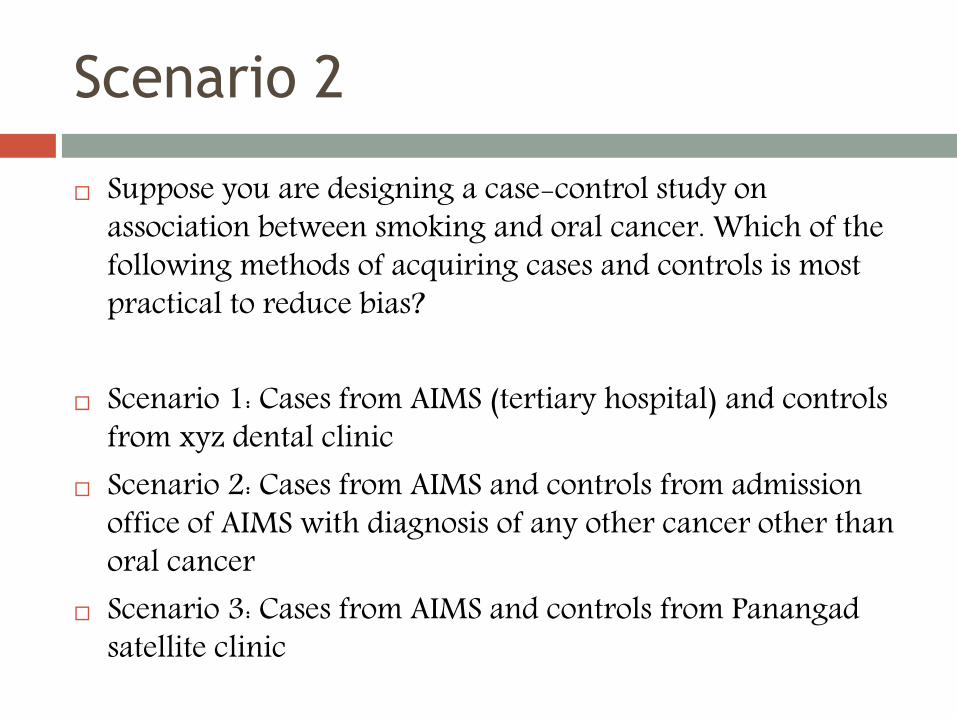
Scenario 2
Suppose you are designing a case-control study on association between smoking and oral cancer. Which of the following methods of acquiring cases and controls is most practical to reduce bias?
Scenario 1: Cases from AIMS (tertiary hospital) and controls from xyz dental clinic
Scenario 2: Cases from AIMS and controls from admission office of AIMS with diagnosis of any other cancer other than oral cancer
Scenario 3: Cases from AIMS and controls from Panangadsatellite clinic
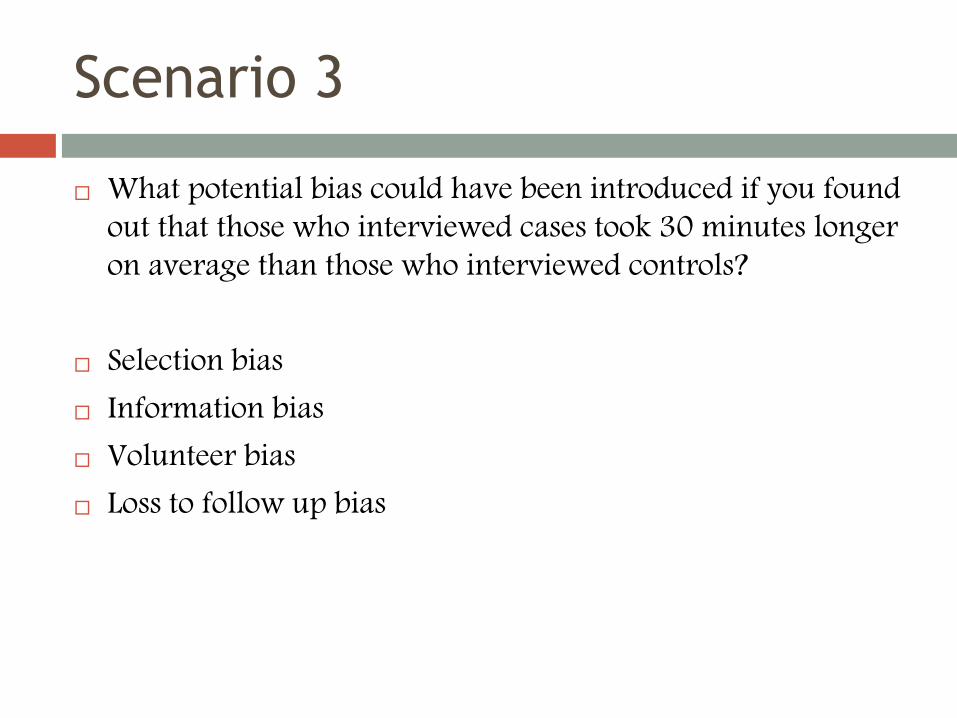
Scenario 3
What potential bias could have been introduced if you found out that those who interviewed cases took 30 minutes longer on average than those who interviewed controls?
Selection bias Information bias Volunteer bias Loss to follow up bias
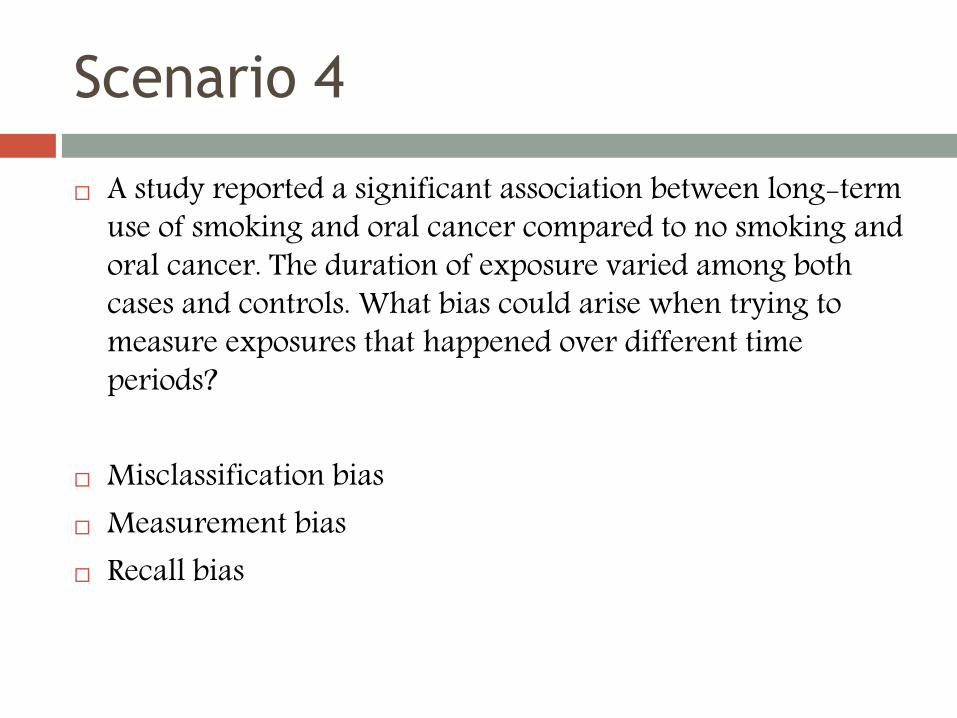
Scenario 4
A study reported a significant association between long-term use of smoking and oral cancer compared to no smoking and oral cancer. The duration of exposure varied among both cases and controls. What bias could arise when trying to measure exposures that happened over different time periods?
Misclassification bias Measurement bias Recall bias
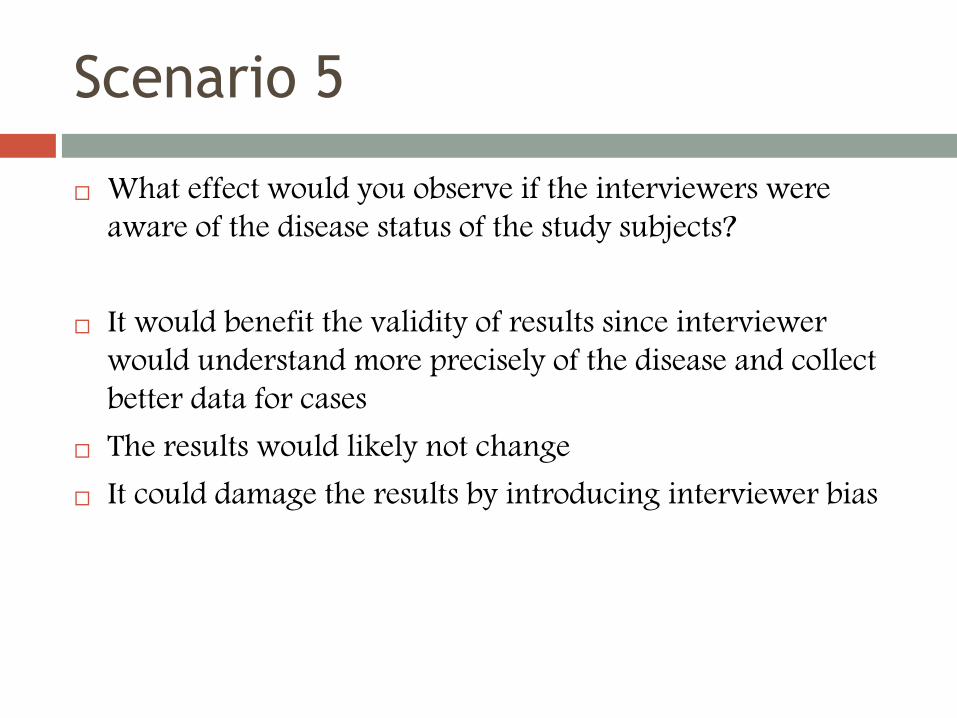
Scenario 5
What effect would you observe if the interviewers were aware of the disease status of the study subjects?
It would benefit the validity of results since interviewer would understand more precisely of the disease and collect better data for cases
The results would likely not change It could damage the results by introducing interviewer bias

SUMMARY
Bias is any trend or deviation in truth or data collection, analysis, interpretation and publication which can cause false conclusions
Occurs either intentionally or unintentionally
Due to consequences of bias, it is unethical to conduct and publish a biased research even unintentionally

Confounding effect cannot be completely avoided.
Every researcher should therefore be aware of all potential sources of bias and undertake all possible actions to reduce and minimize the deviation from the truth.
If deviation is still present, authors should confess it in their articles by declaring the known limitations of their work.

References
1. 8.4 Introduction to sources of bias in clinical trials [Internet]. [cited 2014 Dec 22]. Available from: http://handbook.cochrane.org/chapter_8/8_4_introduction_to_sources_of_bias_in_clinical_trials.htm
2. 9781405132664_4_003.indd - 9781405132664_4_003.pdf [Internet]. [cited 2014 Dec 22]. Available from: http://www.blackwellpublishing.com/content/BPL_Images/Content_store/Sample_chapter/9781405132664/9781405132664_4_003.pdf
3. Delgado-Rodríguez M, Llorca J. Bias. J Epidemiol Community Health. 2004 Aug 1;58(8):635–41.
4. bias.aspx [Internet]. [cited 2014 Dec 22]. Available from: http://www.ashpfoundation.org/mainmenucategories/researchresourcecenter/fosteringyounginvestigators/ajhpresearchfundamentalsseries/bias.aspx
5. Sackett DL. Bias in analytic research. J Chronic Dis. 1979;32(1-2):51–63.

6. Kopec JA, Esdaile JM. Bias in case-control studies. A review. J Epidemiol Community Health. 1990 Sep;44(3):179–86.
7. FEM - Preventing bias [Internet]. [cited 2014 Dec 22]. Available from: https://wiki.ecdc.europa.eu/fem/w/fem/preventing-bias.aspx
8. Pannucci CJ, Wilkins EG. Identifying and Avoiding Bias in Research. Plast Reconstr Surg. 2010 Aug;126(2):619–25.
9. Qualitative Research Bias - How to Recognize It [Internet]. [cited 2014 Dec 22]. Available from: http://www.focusgrouptips.com/qualitative-research.html
10. Types of bias.pdf [Internet]. [cited 2014 Dec 22]. Available from: http://www.medicalbiostatistics.com/Types%20of%20bias.pdf