Embed Size (px)
Citation preview

50 Top Cardiovascular Hospitals Study Overview, 201617th Edition | Published November 9, 2015

Truven Health Analytics™777 E. Eisenhower ParkwayAnn Arbor, MI 48108 USA+1.800.366.7526truvenhealth.com
Truven Health 50 Top Cardiovascular Hospitals: 2016 Study 100 Top Hospitals® is a registered trademark of Truven Health Analytics. ©2015 Truven Health Analytics Inc. All rights reserved. Printed and bound in the United States of America.
The information contained in this publication is intended to serve as a guide for general comparisons and evaluations, but not as the sole basis upon which any specific conduct is to be recommended or undertaken. The reader bears sole risk and responsibility for any analysis, interpretation, or conclusion based on the information contained in this publication, and Truven Health Analytics shall not be responsible for any errors, misstatements, inaccuracies, or omissions contained herein.
No part of this publication may be reproduced or transmitted in any form or by any means, electronic or mechanical, including photocopying, recording, or by any information storage and retrieval system, without permission in writing from Truven Health Analytics.
ISBN 978-1-57372-467-8

Table ofContents
Introduction ............................................................................................................................................................ 1–4
More About the Multifaceted 100 Top Hospitals Program ................................................................4
About Truven Health Analytics .....................................................................................................................4
2016 Award Winners .......................................................................................................................................... 5–6
Teaching Hospitals With Cardiovascular Residency Programs ....................................................... 5
Teaching Hospitals Without Cardiovascular Residency Programs .............................................. 6
Community Hospitals ........................................................................................................................................6
Findings ..................................................................................................................................................................7–14
Benchmark Hospitals Outperformed Peer Hospitals Across All Measures ............................7–8
Better Performance at Benchmark Teaching Hospitals With Cardiovascular
Residency Programs ..................................................................................................................................... 8–9
Better Performance at Benchmark Teaching Hospitals Without Cardiovascular
Residency Programs ........................................................................................................................................ 10
Better Performance at Benchmark Community Hospitals ................................................................11
Investigative Projects: New Valve Patient Group Findings ........................................................12–13
Potential New Measures for Future Studies .................................................................................... 13–14
Methodology ..................................................................................................................................................... 15–26
Overview ................................................................................................................................................................15
Building the Database of Hospitals ..................................................................................................... 15–19
Classifying Hospitals Into Comparison Groups .............................................................................19–20
Scoring Hospitals on Weighted Performance Measures ..........................................................20–25
Determining the 50 Top Cardiovascular Hospitals ..................................................................... 25–26
Appendix: Methodology Details ...............................................................................................................27–33
Normative Database Development ...........................................................................................................27
Present-on-Admission Data ...................................................................................................................27–28
Methods for Identifying Patient Severity ......................................................................................... 28–31
PCI Group Definition ........................................................................................................................................32
Core Measures ....................................................................................................................................................32
Length-of-Stay and Cost-per-Case Methodologies ................................................................... 32–33
Performance Measure Normalization ...............................................................................................33–34
Why We Have Not Calculated Percent Change in Specific Instances ....................................... 34
References ......................................................................................................................................................... 35–36

150 TOP CARDIOVASCULAR HOSPITALS
Each year, Truven Health Analytics,™ through the
100 Top Hospitals® program, conducts objective,
quantitative research to identify the nation’s best
hospitals, health systems, and cardiovascular hospital
service lines — and to produce critical information to help
all healthcare organizations target better performance.
Organizations do not apply for our selection process, and
award winners do not pay to market their honor.
Now, as we have for 17 years, Truven Health has again analyzed public data, with our
proven analytic methodologies, to provide the 2016 Truven Health 50 Top Cardiovascular
Hospitals study.
The study objectives, based on a national scorecard of metrics, are to identify and
recognize the highest-performing cardiovascular service lines in the nation and provide
unbiased, actionable, and achievable benchmarks for all hospital and clinical leaders to
use as they work to raise their own standards of performance.
Seizing Opportunities. Delivering Value.Each year, winners of our 50 Top Cardiovascular Hospitals award demonstrate the
ability to seek out the best opportunities to deliver healthcare value to their communities.
They do this by finding ways to take clinical, operational, and financial performance to the
next level.
In fact, our winners clearly show the extraordinary level of value that can be achieved
when comprehensive, high performance meets a dedication to improvement.
Why Cardiovascular Hospitals?Cardiovascular diseases are the longstanding, leading cause of death in the U.S.,
accounting for approximately one in four deaths.1 The cost to treat heart disease is
staggering, as well: $1 of every $6 spent2 on healthcare in the U.S. is attributed to
heart disease. Heart disease is also the number-one reason Americans are admitted to
the hospital, according to annual statistics from the U.S. Centers for Disease Control
and Prevention.3
Introduction

2 50 TOP CARDIOVASCULAR HOSPITALS
It’s no wonder, then, that cardiovascular services are among the highest profile of all
hospital service lines. With the stakes so high, it is vital that hospitals provide the highest-
quality, most efficient heart care possible — and that they look closely for ways to
improve. The 50 Top Cardiovascular Hospitals study answers that need each year.
The 50 Top Cardiovascular Hospitals study is also unique for the 100 Top Hospitals
program. The program’s research series publishes only this one clinical service line study
because of the limitations of inpatient public administrative data. Only the cardiovascular
service line has consistently had both the inpatient volume and supplemental clinical
process metrics from the Centers for Medicare & Medicaid Services (CMS) Hospital
Compare initiative to support the publication of scorecard-based benchmarks for a
service line. And with each annual 50 Top Cardiovascular Hospitals study, the results
improve — as the transparency and depth of inpatient and continuum-of-care data grow
and evolve.
Objective, Real-World AssessmentFor many years, the vast majority of the 50 Top Cardiovascular Hospitals winners have
used a dyad management model, and while the study scorecard is more heavily weighted
on clinical metrics, our research reflects diverse, real-world organizational needs. In
addition, to maintain the study’s high level of integrity, only public data sources are used
for calculating study metrics. This eliminates bias, ensures inclusion of as many hospitals
as possible, and facilitates consistency of definitions and data. All of this serves to make
our benchmarks highly useful for assessing both service line management and clinical
outcomes in an objective, meaningful way.
A Unique Measure of Leadership Excellence and Its Effect on Service Line PerformanceFor more than 20 years, Truven Health has collaborated with academics on a wide
range of topics to dig deeper into the leadership practices of the nation’s top healthcare
organizations. Those studies have found that leadership excellence is essential for
superior organizational and service line performance.
As such, the 100 Top Hospitals studies not only provide a distinctive approach to
measuring the performance of hospitals, health systems, and service lines, but also
deliver objective insights into the effectiveness of hospital leadership. Higher composite
scores on our national balanced scorecard reflect more effective leadership, as well as
management’s degree of success in executing short- and long-term goals across multiple
key managerial and clinical domains.
The leadership of today’s hospitals — including the board, executive team, and medical
staff leadership — is responsible for ensuring all facets of a hospital and its cardiovascular
service line are performing at the same high level. Only the 50 Top Cardiovascular
Hospitals study and analytics provide that view of performance alignment. And that
information is key to assessing the strategic intersection among cost, quality, efficiency,
and ultimately, improved community value.
The Truven Health 50 Top Cardiovascular Hospitals study focuses on one of healthcare’s most important service lines — one that affects hundreds of thousands of patient lives annually and adds billions of dollars to our nation’s overall healthcare costs.
That’s why publishing new and achievable benchmarks for cardiovascular service line performance is critically important and has the potential to make a large and lasting impact on the quality and cost of care for heart patients across the U.S.

350 TOP CARDIOVASCULAR HOSPITALS
The Performance of Our 2016 50 Top Cardiovascular HospitalsThe 2016 50 Top Cardiovascular Hospitals study identified U.S. hospitals that have
achieved the best performance on a balanced scorecard of performance measures.
This year, based on comparisons between the study winners and a peer group of similar
hospitals that were not winners, we found that our study winners delivered better
outcomes while operating more efficiently and at a lower cost.
The 2016 winners had:
§ Significantly higher inpatient survival than nonwinning cardiovascular hospitals
(20 to 33 percent higher)
§ Fewer patients with complications (8 to 11 percent fewer)
§ Higher 30-day survival rates for acute myocardial infarction (AMI) and heart failure
(HF) patients (0.6 to 0.7 percentage points higher)*
§ Lower readmissions rates for AMI and HF patients (1.05 percentage points lower)
§ Better CMS Core Measures scores (0.3 percentage points higher)
§ One-half to 1 day lower average lengths of stay
§ $1,200–$6,100 less in total costs per patient case; the median benchmark hospital
spent approximately $6,100 less per bypass surgery patient and more than $1,200 less
per admitted heart failure patient
Further, our study indicates that if all cardiovascular providers performed at the same
level of this year’s winners:
§ Nearly 8,000 additional lives could be saved
§ Nearly 3,500 more heart patients could be complication-free
§ More than $1.3 billion could be saved
We based this analysis on the Medicare patients included in this study. If the same
standards were applied to all inpatients, the impact would be even greater.
Health System Performance in This Year’s Cardiovascular StudyIn this year’s 50 Top Cardiovascular Hospitals study, 34 out of the 50 highest-performing
hospitals in the nation in cardiovascular care (or nearly 70 percent) were members of
health systems. There were also four health systems with more than one winner.
This suggests that consistency in and alignment of performance is gaining some
ground as the nation’s healthcare system moves toward more standard and reliable
care. After all, to maintain and improve a service population’s health, hospital leaders
associated with a health system must work together as an integrated team. By sharing
best practices and repeating proven strategies within the system, all members at all levels
of service learn from each other — improving the care delivered to all patients, regardless
of system facility.
Additional Findings For more details about the 50 Top Cardiovascular Hospitals study findings, including
complete hospital reporting data on this year’s winning cardiovascular hospitals, please
see the Findings section of this document.
To improve performance, cardiovascular hospital leaders need objective information about what is achievable — relevant benchmarks that allow them to compare their performance to peers and the top-performing organizations.
By naming the Truven Health 50 Top Cardiovascular Hospitals in the nation, the Truven Health 100 Top Hospitals program provides hospital executives, physicians, and cardiovascular service line managers with valuable, practical targets for raising performance.
Information in this study, and available in separate facility-specific reports, provides targets to reach for, with detailed analysis of how the winners and their nonwinning peers performed on the study’s balanced scorecard of measures.
* AMI is a heart attack, which happens when the arteries leading to the heart become blocked and blood supply is slowed or stopped. Heart failure is a weakening of the heart's pumping power, leading to the body not receiving enough oxygen and nutrients to work properly.

4 50 TOP CARDIOVASCULAR HOSPITALS
We Welcome Your InputFor more than two decades, the Truven Health 100 Top Hospitals program has worked
to ensure that the measures and methodology used are fair, consistent, and meaningful.
We continually test the validity of our performance measures and data sources.
In addition, as part of our own internal performance improvement process, we welcome
comments about our study from health systems, hospitals, and physicians. To submit
comments, visit the Contact Us section of 100tophospitals.com.
More About the Multifaceted 100 Top Hospitals ProgramThe 50 Top Cardiovascular Hospitals research is just one of the studies of the Truven
Health 100 Top Hospitals program. To increase understanding of trends in specific areas
of the healthcare industry, the program includes a range of studies and reports, including:
§ 100 Top Hospitals and Everest Award studies — Highly anticipated research that
annually recognizes the best hospitals in the nation based on overall organizational
performance, as well as long-term rates of improvement
§ 50 Top Cardiovascular Hospitals — An annual study identifying hospitals that
demonstrate the highest performance in hospital cardiovascular services
§ 15 Top Health Systems — A groundbreaking study introduced in 2009 that provides an
objective measure of health system performance as a sum of its parts
§ 100 Top Hospitals Comparison Reports — A two-dimensional analysis, available for
nearly all U.S. hospitals and health systems, that provides a set of matrix-style graphs
(overall and by measure) — comparing a group of client-selected organizations on
national performance and to each other
§ A variety of custom benchmark reports designed to help executives understand how
their performance compares with their peers within health systems, states, and markets
You can read more about these studies and see lists of all winners by visiting
100tophospitals.com.
About Truven Health AnalyticsTruven Health Analytics delivers the answers our clients need to improve healthcare
quality and access while reducing costs. We provide market-leading performance
improvement built on data integrity and empirical truth. For more than 30 years, our
insights and solutions have been providing hospitals and clinicians, employers and health
plans, state and federal government agencies, life sciences companies, and policymakers
the facts they need to make confident decisions that directly affect the health and well-
being of people and organizations in the U.S. and around the world.
In addition to 100 Top Hospitals, Truven Health owns some of the most trusted brands
in healthcare, such as MarketScan, Advantage Suite, Micromedex, Simpler, ActionOI,
Heartbeat Experts, and JWA. Truven Health has its principal offices in Ann Arbor, Mich.;
Chicago; and Denver. For more information, please visit truvenhealth.com.

550 TOP CARDIOVASCULAR HOSPITALS
Teaching Hospitals With Cardiovascular Residency Programs*
Hospitals Location Medicare ID
Baystate Medical Center Springfield, MA 220077
Beth Israel Deaconess Medical Center Boston, MA 220086
Guthrie Robert Packer Hospital Sayre, PA 390079
Kettering Medical Center Kettering, OH 360079
Lankenau Medical Center Wynnewood, PA 390195
Mayo Clinic - Saint Marys Hospital Rochester, MN 240010
Mayo Clinic Hospital Phoenix, AZ 030103
Riverside Medical Center Kankakee, IL 140186
Sanford USD Medical Center Sioux Falls, SD 430027
Scripps Green Hospital La Jolla, CA 050424
Steward St. Elizabeth's Medical Center Boston, MA 220036
The Christ Hospital Health Network Cincinnati, OH 360163
Tufts Medical Center Boston, MA 220116
University of Wisconsin Hospital and Clinics Madison, WI 520098
Vanderbilt University Medical Center Nashville, TN 440039
Truven Health Analytics™ and the 100 Top Hospitals®
program is pleased to present the 2016 Truven Health
50 Top Cardiovascular Hospitals.
We stratified winners by three separate peer groups: teaching hospitals with
cardiovascular residency programs, teaching hospitals without cardiovascular residency
programs, and community hospitals.
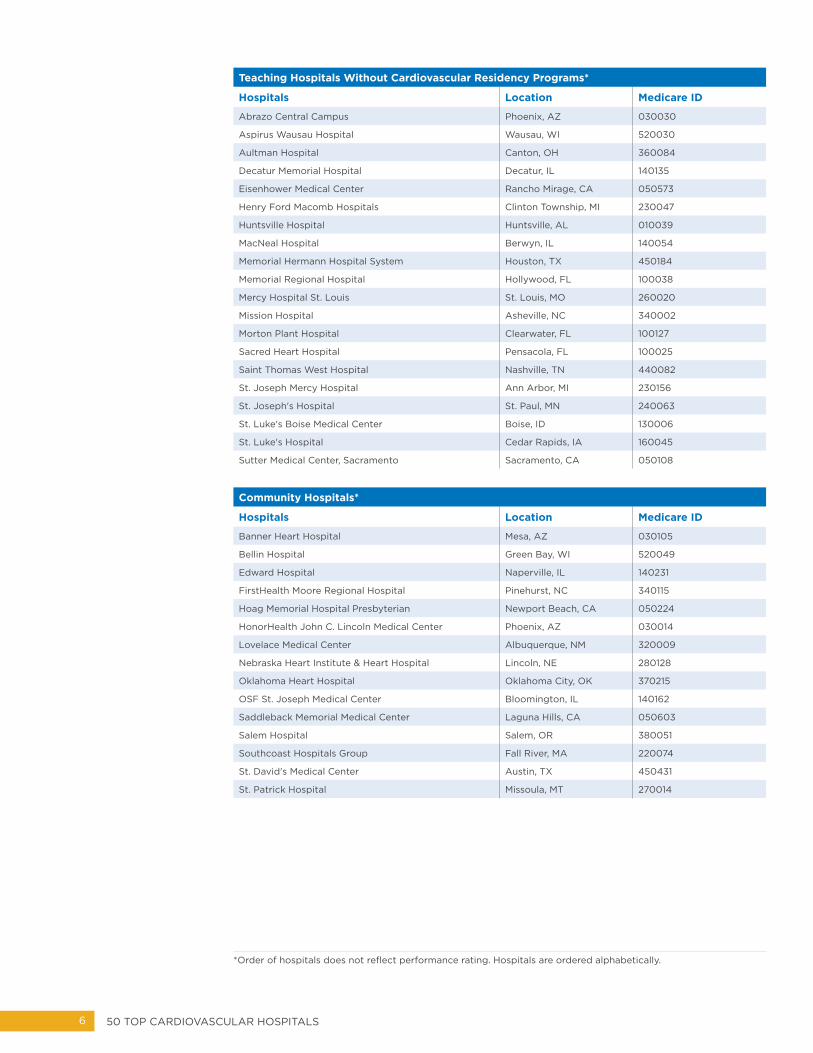
Please note that the order of hospitals in the following tables does not reflect performance rating. Hospitals are ordered alphabetically.
For full details on these peer groups and the process we used to select the winning
benchmark hospitals, please see the Methodology section of this document.
2016 Award Winners
* Order of hospitals does not reflect performance rating. Hospitals are ordered alphabetically.
6 50 TOP CARDIOVASCULAR HOSPITALS
Teaching Hospitals Without Cardiovascular Residency Programs*
Hospitals Location Medicare ID
Abrazo Central Campus Phoenix, AZ 030030
Aspirus Wausau Hospital Wausau, WI 520030
Aultman Hospital Canton, OH 360084
Decatur Memorial Hospital Decatur, IL 140135
Eisenhower Medical Center Rancho Mirage, CA 050573
Henry Ford Macomb Hospitals Clinton Township, MI 230047
Huntsville Hospital Huntsville, AL 010039
MacNeal Hospital Berwyn, IL 140054
Memorial Hermann Hospital System Houston, TX 450184
Memorial Regional Hospital Hollywood, FL 100038
Mercy Hospital St. Louis St. Louis, MO 260020
Mission Hospital Asheville, NC 340002
Morton Plant Hospital Clearwater, FL 100127
Sacred Heart Hospital Pensacola, FL 100025
Saint Thomas West Hospital Nashville, TN 440082
St. Joseph Mercy Hospital Ann Arbor, MI 230156
St. Joseph's Hospital St. Paul, MN 240063
St. Luke's Boise Medical Center Boise, ID 130006
St. Luke's Hospital Cedar Rapids, IA 160045
Sutter Medical Center, Sacramento Sacramento, CA 050108
Community Hospitals*
Hospitals Location Medicare ID
Banner Heart Hospital Mesa, AZ 030105
Bellin Hospital Green Bay, WI 520049
Edward Hospital Naperville, IL 140231
FirstHealth Moore Regional Hospital Pinehurst, NC 340115
Hoag Memorial Hospital Presbyterian Newport Beach, CA 050224
HonorHealth John C. Lincoln Medical Center Phoenix, AZ 030014
Lovelace Medical Center Albuquerque, NM 320009
Nebraska Heart Institute & Heart Hospital Lincoln, NE 280128
Oklahoma Heart Hospital Oklahoma City, OK 370215
OSF St. Joseph Medical Center Bloomington, IL 140162
Saddleback Memorial Medical Center Laguna Hills, CA 050603
Salem Hospital Salem, OR 380051
Southcoast Hospitals Group Fall River, MA 220074
St. David's Medical Center Austin, TX 450431
St. Patrick Hospital Missoula, MT 270014
* Order of hospitals does not reflect performance rating. Hospitals are ordered alphabetically.

750 TOP CARDIOVASCULAR HOSPITALS
This year’s Truven Health 50 Top Cardiovascular Hospitals
provided better care and were more efficient than their
peers. If all cardiovascular providers performed at the
level of our 2016 study winners, approximately 7,900
additional lives and $1.3 billion could be saved, and more
than 3,000 additional bypass and angioplasty patients
could be complication-free.
We based this finding on the Medicare patients included in this study and by analyzing
study winners versus nonwinners. If the same standards were applied to all inpatients, the
impact would be even greater.
One of the goals of the Truven Health 100 Top Hospitals® program is to provide
actionable benchmarks that can help all hospitals improve their performance. This section
highlights winner (benchmark) versus nonwinner differences in all study hospitals as a
group and by hospital type (residency program and teaching status).
Benchmark Hospitals Outperformed Peer Hospitals Across All MeasuresAlthough our research shows that all hospitals have experienced improved cardiovascular
patient outcomes in recent years, comparisons between this year’s 50 Top Cardiovascular
Hospitals and their peers show that room for improvement still exists. (See Table 1.)
§ Survival rates were markedly better at benchmark (winning) hospitals, particularly for
patients receiving bypass surgeries (coronary artery bypass grafting, or CABG) and
angioplasties (percutaneous coronary intervention, or PCI). The median benchmark
hospital had a risk-adjusted CABG mortality index of 0.60, meaning there were 40
percent fewer deaths than would be expected, given patient severity. With an index
of 0.93, peer (nonwinning) hospitals had only 7 percent fewer CABG mortalities than
expected. Winner versus nonwinner differences were similar for PCI survival rates.
§ The 2016 cardiovascular study winners had 8.3 percent and 11.2 percent lower
complications indexes for PCI and CABG, respectively, when compared to their peers.
§ Longer-term outcomes were better at winning hospitals. The winning hospitals’
30-day heart failure (HF) and heart attack (AMI) mortality rates were also lower than
their peers, meaning a smaller percentage of patients died, of any cause, 30 days
after admission.
§ The winning hospitals also had lower readmission rates, with a smaller percentage of
patients returning to the hospital, for any cause, within 30 days.
Findings
8 50 TOP CARDIOVASCULAR HOSPITALS
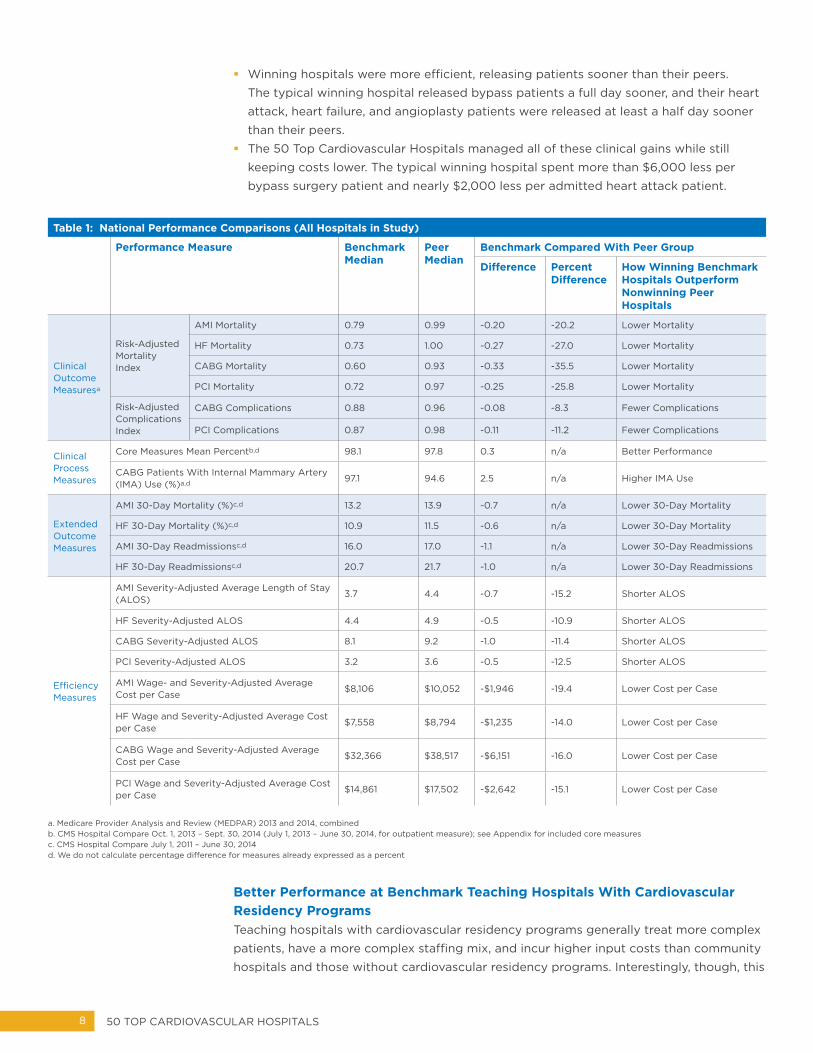
§ Winning hospitals were more efficient, releasing patients sooner than their peers.
The typical winning hospital released bypass patients a full day sooner, and their heart
attack, heart failure, and angioplasty patients were released at least a half day sooner
than their peers.
§ The 50 Top Cardiovascular Hospitals managed all of these clinical gains while still
keeping costs lower. The typical winning hospital spent more than $6,000 less per
bypass surgery patient and nearly $2,000 less per admitted heart attack patient.
Table 1: National Performance Comparisons (All Hospitals in Study)
Performance Measure Benchmark Median
Peer Median
Benchmark Compared With Peer Group
Difference Percent Difference
How Winning Benchmark Hospitals Outperform Nonwinning Peer Hospitals
Clinical Outcome Measuresa
Risk-Adjusted Mortality Index
AMI Mortality 0.79 0.99 -0.20 -20.2 Lower Mortality
HF Mortality 0.73 1.00 -0.27 -27.0 Lower Mortality
CABG Mortality 0.60 0.93 -0.33 -35.5 Lower Mortality
PCI Mortality 0.72 0.97 -0.25 -25.8 Lower Mortality
Risk-Adjusted Complications Index
CABG Complications 0.88 0.96 -0.08 -8.3 Fewer Complications
PCI Complications 0.87 0.98 -0.11 -11.2 Fewer Complications
Clinical Process Measures
Core Measures Mean Percentb,d 98.1 97.8 0.3 n/a Better Performance
CABG Patients With Internal Mammary Artery (IMA) Use (%)a,d 97.1 94.6 2.5 n/a Higher IMA Use
Extended Outcome Measures
AMI 30-Day Mortality (%)c,d 13.2 13.9 -0.7 n/a Lower 30-Day Mortality
HF 30-Day Mortality (%)c,d 10.9 11.5 -0.6 n/a Lower 30-Day Mortality
AMI 30-Day Readmissionsc,d 16.0 17.0 -1.1 n/a Lower 30-Day Readmissions
HF 30-Day Readmissionsc,d 20.7 21.7 -1.0 n/a Lower 30-Day Readmissions
Efficiency Measures
AMI Severity-Adjusted Average Length of Stay (ALOS)
3.7 4.4 -0.7 -15.2 Shorter ALOS
HF Severity-Adjusted ALOS 4.4 4.9 -0.5 -10.9 Shorter ALOS
CABG Severity-Adjusted ALOS 8.1 9.2 -1.0 -11.4 Shorter ALOS
PCI Severity-Adjusted ALOS 3.2 3.6 -0.5 -12.5 Shorter ALOS
AMI Wage- and Severity-Adjusted Average Cost per Case
$8,106 $10,052 -$1,946 -19.4 Lower Cost per Case
HF Wage and Severity-Adjusted Average Cost per Case
$7,558 $8,794 -$1,235 -14.0 Lower Cost per Case
CABG Wage and Severity-Adjusted Average Cost per Case
$32,366 $38,517 -$6,151 -16.0 Lower Cost per Case
PCI Wage and Severity-Adjusted Average Cost per Case
$14,861 $17,502 -$2,642 -15.1 Lower Cost per Case
a. Medicare Provider Analysis and Review (MEDPAR) 2013 and 2014, combinedb. CMS Hospital Compare Oct. 1, 2013 – Sept. 30, 2014 (July 1, 2013 – June 30, 2014, for outpatient measure); see Appendix for included core measuresc. CMS Hospital Compare July 1, 2011 – June 30, 2014d. We do not calculate percentage difference for measures already expressed as a percent
Better Performance at Benchmark Teaching Hospitals With Cardiovascular Residency ProgramsTeaching hospitals with cardiovascular residency programs generally treat more complex
patients, have a more complex staffing mix, and incur higher input costs than community
hospitals and those without cardiovascular residency programs. Interestingly, though, this

950 TOP CARDIOVASCULAR HOSPITALS
group demonstrated very strong performance compared with the other two classes of
hospitals — across clinical, process-of-care, and efficiency measures — making them the
clear performance leaders. (See Tables 2, 3, and 4.)
One example of the wide margin of performance difference was the group’s markedly
higher survival rates: Winners’ mortality rates were 21 and 25 percent lower than their
peers for AMI and HF patients, respectively.
Cardiovascular teaching benchmark hospitals were also much more efficient than their
peers, with the lowest costs of all three hospital comparison groups. For every patient
category, their wage- and severity-adjusted costs per case were at least 17 percent lower
than their nonwinning peers. In addition, they released HF and CABG patients about a
day sooner, on average, and PCI patients a half day sooner. (See Table 2.)
Table 2: Performance Comparisons for Teaching Hospitals With Cardiovascular Residency Programs
Performance Measure Benchmark Median
Peer Median
Benchmark Compared With Peer Group
Difference Percent Difference
How Winning Benchmark Hospitals Outperform Nonwinning Peer Hospitals
Clinical Outcome Measuresa
Risk-Adjusted Mortality Index
AMI Mortality 0.77 0.98 -0.21 -21.4 Lower Mortality
HF Mortality 0.77 1.02 -0.25 -24.5 Lower Mortality
CABG Mortality 0.72 0.91 -0.19 -20.9 Lower Mortality
PCI Mortality 0.82 0.94 -0.12 -12.8 Lower Mortality
Risk-Adjusted Complications Index
CABG Complications 0.85 0.96 -0.11 -11.5 Fewer Complications
PCI Complications 0.85 0.98 -0.13 -13.3 Fewer Complications
Clinical Process Measures
Core Measures Mean Percentb,d 98.2 97.7 0.5 n/a Better Performance
CABG Patients With IMA Use (%)a,d 97.8 95.7 2.2 n/a Higher IMA Use
Extended Outcome Measures
AMI 30-Day Mortality (%)c,d 12.8 13.7 -0.9 n/a Lower 30-Day Mortality
HF 30-Day Mortality (%)c,d 9.9 10.7 -0.8 n/a Lower 30-Day Mortality
AMI 30-Day Readmissionsc,d 16.4 17.4 -1.0 n/a Lower 30-Day Readmissions
HF 30-Day Readmissionsc,d 21.1 22.3 -1.2 n/a Lower 30-Day Readmissions
Efficiency Measures
AMI Severity-Adjusted ALOS 3.7 4.4 -0.7 -15.3 Shorter ALOS
HF Severity-Adjusted ALOS 4.1 4.9 -0.8 -16.4 Shorter ALOS
CABG Severity-Adjusted ALOS 8.1 9.0 -0.9 -10.5 Shorter ALOS
PCI Severity-Adjusted ALOS 3.2 3.6 -0.5 -12.9 Shorter ALOS
AMI Wage- and Severity-Adjusted Average Cost per Case
$7,820 $9,992 -$2,172 -21.7 Lower Cost per Case
HF Wage- and Severity-Adjusted Average Cost per Case
$7,090 $8,619 -$1,530 -17.7 Lower Cost per Case
CABG Wage- and Severity-Adjusted Average Cost per Case
$32,015 $38,980 -$6,965 -17.9 Lower Cost per Case
PCI Wage- and Severity-Adjusted Average Cost per Case
$13,808 $18,372 -$4,564 -24.8 Lower Cost per Case
a. MEDPAR 2013 and 2014, combinedb. CMS Hospital Compare Oct. 1, 2013 – Sept. 30, 2014 (July 1, 2013 – June 30, 2014, for outpatient measure); see Appendix for included core measuresc. CMS Hospital Compare July 1, 2011 – June 30, 2014d. We do not calculate percentage difference for measures already expressed as a percent
10 50 TOP CARDIOVASCULAR HOSPITALS
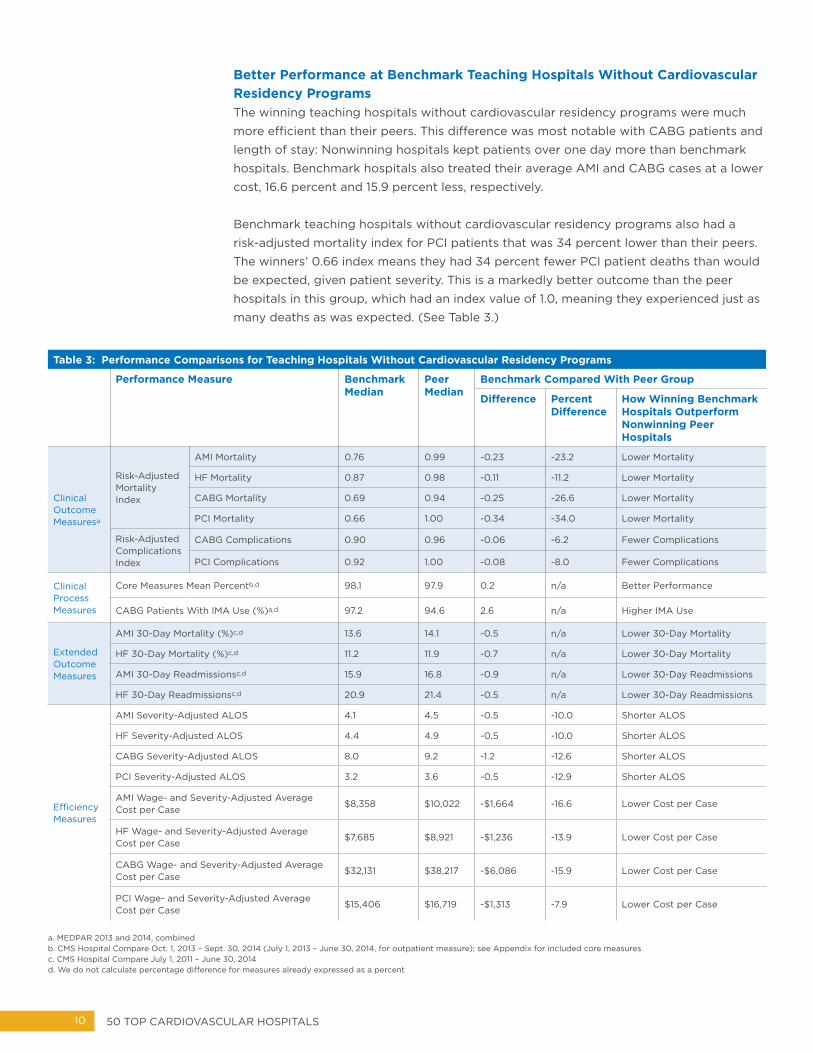
Better Performance at Benchmark Teaching Hospitals Without Cardiovascular Residency ProgramsThe winning teaching hospitals without cardiovascular residency programs were much
more efficient than their peers. This difference was most notable with CABG patients and
length of stay: Nonwinning hospitals kept patients over one day more than benchmark
hospitals. Benchmark hospitals also treated their average AMI and CABG cases at a lower
cost, 16.6 percent and 15.9 percent less, respectively.
Benchmark teaching hospitals without cardiovascular residency programs also had a
risk-adjusted mortality index for PCI patients that was 34 percent lower than their peers.
The winners’ 0.66 index means they had 34 percent fewer PCI patient deaths than would
be expected, given patient severity. This is a markedly better outcome than the peer
hospitals in this group, which had an index value of 1.0, meaning they experienced just as
many deaths as was expected. (See Table 3.)
Table 3: Performance Comparisons for Teaching Hospitals Without Cardiovascular Residency Programs
Performance Measure Benchmark Median
Peer Median
Benchmark Compared With Peer Group
Difference Percent Difference
How Winning Benchmark Hospitals Outperform Nonwinning Peer Hospitals
Clinical Outcome Measuresa
Risk-Adjusted Mortality Index
AMI Mortality 0.76 0.99 -0.23 -23.2 Lower Mortality
HF Mortality 0.87 0.98 -0.11 -11.2 Lower Mortality
CABG Mortality 0.69 0.94 -0.25 -26.6 Lower Mortality
PCI Mortality 0.66 1.00 -0.34 -34.0 Lower Mortality
Risk-Adjusted Complications Index
CABG Complications 0.90 0.96 -0.06 -6.2 Fewer Complications
PCI Complications 0.92 1.00 -0.08 -8.0 Fewer Complications
Clinical Process Measures
Core Measures Mean Percentb,d 98.1 97.9 0.2 n/a Better Performance
CABG Patients With IMA Use (%)a,d 97.2 94.6 2.6 n/a Higher IMA Use
Extended Outcome Measures
AMI 30-Day Mortality (%)c,d 13.6 14.1 -0.5 n/a Lower 30-Day Mortality
HF 30-Day Mortality (%)c,d 11.2 11.9 -0.7 n/a Lower 30-Day Mortality
AMI 30-Day Readmissionsc,d 15.9 16.8 -0.9 n/a Lower 30-Day Readmissions
HF 30-Day Readmissionsc,d 20.9 21.4 -0.5 n/a Lower 30-Day Readmissions
Efficiency Measures
AMI Severity-Adjusted ALOS 4.1 4.5 -0.5 -10.0 Shorter ALOS
HF Severity-Adjusted ALOS 4.4 4.9 -0.5 -10.0 Shorter ALOS
CABG Severity-Adjusted ALOS 8.0 9.2 -1.2 -12.6 Shorter ALOS
PCI Severity-Adjusted ALOS 3.2 3.6 -0.5 -12.9 Shorter ALOS
AMI Wage- and Severity-Adjusted Average Cost per Case
$8,358 $10,022 -$1,664 -16.6 Lower Cost per Case
HF Wage- and Severity-Adjusted Average Cost per Case
$7,685 $8,921 -$1,236 -13.9 Lower Cost per Case
CABG Wage- and Severity-Adjusted Average Cost per Case
$32,131 $38,217 -$6,086 -15.9 Lower Cost per Case
PCI Wage- and Severity-Adjusted Average Cost per Case
$15,406 $16,719 -$1,313 -7.9 Lower Cost per Case
a. MEDPAR 2013 and 2014, combinedb. CMS Hospital Compare Oct. 1, 2013 – Sept. 30, 2014 (July 1, 2013 – June 30, 2014, for outpatient measure); see Appendix for included core measuresc. CMS Hospital Compare July 1, 2011 – June 30, 2014d. We do not calculate percentage difference for measures already expressed as a percent

1150 TOP CARDIOVASCULAR HOSPITALS
Better Performance at Benchmark Community HospitalsThe benchmark community hospitals had the best outcomes for CABG patients and
outperformed their peers on the CABG mortality measure with a wider margin than the
two other hospital groups we studied. With a CABG mortality rate of 0.45, the winning
community hospitals had 55 percent fewer CABG patient deaths than expected. Their
nonwinning peers had only 9 percent fewer CABG patient deaths than expected. Winning
benchmark hospitals also had far fewer CABG patient complications — 15 percent fewer
than expected, versus only 3 percent fewer than expected at nonwinning hospitals.
The winning community hospitals were also more efficient than their peers. They released
AMI and CABG patients about a day sooner, on average, and HF and PCI patients a half
a day sooner. Cost-per-case averages in all patient groups were also much better with
benchmark community hospitals, with the most notable difference being with the PCI
patients, at almost $4,000 less per case than peer hospitals in the group. (See Table 4.)
Table 4: Performance Comparisons for Community Hospitals
Performance Measure Benchmark Median
Peer Median
Benchmark Compared With Peer Group
Difference Percent Difference
How Winning Benchmark Hospitals Outperform Nonwinning Peer Hospitals
Clinical Outcome Measuresa
Risk-Adjusted Mortality Index
AMI Mortality 0.81 0.98 -0.17 -17.3 Lower Mortality
HF Mortality 0.65 0.99 -0.34 -34.3 Lower Mortality
CABG Mortality 0.45 0.91 -0.46 -50.5 Lower Mortality
PCI Mortality 0.69 0.95 -0.26 -27.4 Lower Mortality
Risk-Adjusted Complications Index
CABG Complications 0.85 0.97 -0.12 -12.4 Fewer Complications
PCI Complications 0.74 0.98 -0.24 -24.5 Fewer Complications
Clinical Process Measures
Core Measures Mean Percentb,d 98.0 97.7 0.3 n/a Better Performance
CABG Patients With IMA Use (%)a,d 95.6 94.2 1.5 n/a Higher IMA Use
Extended Outcome Measures
AMI 30-Day Mortality (%)c,d 12.8 14.0 -1.2 n/a Lower 30-Day Mortality
HF 30-Day Mortality (%)c,d 11.5 11.6 -0.1 n/a Lower 30-Day Mortality
AMI 30-Day Readmissionsc,d 15.6 16.9 -1.3 n/a Lower 30-Day Readmissions
HF 30-Day Readmissionsc,d 20.1 21.7 -1.6 n/a Lower 30-Day Readmissions
Efficiency Measures
AMI Severity-Adjusted ALOS 3.5 4.4 -0.9 -19.8 Shorter ALOS
HF Severity-Adjusted ALOS 4.4 4.9 -0.5 -10.6 Shorter ALOS
CABG Severity-Adjusted ALOS 8.3 9.3 -1.0 -10.6 Shorter ALOS
PCI Severity-Adjusted ALOS 3.1 3.6 -0.5 -14.4 Shorter ALOS
AMI Wage- and Severity-Adjusted Average Cost per Case
$8,254 $10,008 -$1,754 -17.5 Lower Cost per Case
HF Wage- and Severity-Adjusted Average Cost per Case
$8,035 $8,780 -$745 -8.5 Lower Cost per Case
CABG Wage- and Severity-Adjusted Average Cost per Case
$35,247 $38,001 -$2,754 -7.2 Lower Cost per Case
PCI Wage- and Severity-Adjusted Average Cost per Case
$13,853 $17,697 -$3,843 -21.7 Lower Cost per Case
a. MEDPAR 2013 and 2014, combinedb. CMS Hospital Compare Oct. 1, 2013 – Sept. 30, 2014 (July 1, 2013 – June 30, 2014, for outpatient measure); see Appendix for included core measuresc. CMS Hospital Compare July 1, 2011 – June 30, 2014d. We do not calculate percentage difference for measures already expressed as a percent

12 50 TOP CARDIOVASCULAR HOSPITALS
Investigative Projects: New Valve Patient Group FindingsFor this year’s study, we added a new patient group for analysis and reporting only: valve
repair. Our analysis of the growth or decline in major cardiac procedures over time has
shown an increased number of valve DRG admissions in the inpatient hospital setting.
Given this finding, we are considering adding this patient group to the study.
The measures associated with this group were not included in the overall ranking of
hospitals and selection of winners in this 2016 study. We are providing the results of
the analysis here for information only. If you would like to provide feedback on this new
group and these proposed measures, please email [email protected].
The valve repair patient group is defined as patients included in Medicare Severity
Diagnosis Related Groups (MS-DRGs) 216−221 and with any (principal or secondary) of
the ICD-9-CM procedures codes:
35.10 Open heart valvuloplasty without replacement, unspecified valve
35.11 Open heart valvuloplasty of aortic valve without replacement
35.12 Open heart valvuloplasty of mitral valve without replacement
35.13 Open heart valvuloplasty of pulmonary valve without replacement
35.14 Open heart valvuloplasty of tricuspid valve without replacement
35.20 Open and other replacement of unspecified heart valve
35.21 Open and other replacement of aortic valve with tissue graft
35.22 Open and other replacement of aortic valve
35.23 Open and other replacement of mitral valve with tissue graft
35.24 Open and other replacement of mitral valve
35.25 Open and other replacement of pulmonary valve with tissue graft
35.26 Open and other replacement of pulmonary valve
35.27 Open and other replacement of tricuspid valve with tissue graft
35.28 Open and other replacement of tricuspid valve
35.33 Annuloplasty
Benchmark Hospitals Outperformed Peers on Valve MeasuresAlthough the valve patient group was not included in ranking for the 50 Top Cardiovascular
Hospital winner selection this year, our research showed that winners still outperformed
peers on all of the clinical outcome and efficiency measures we tested. (See Table 5.)
§ Benchmark hospitals had a better survival rate, with the median hospital having a
risk-adjusted valve mortality index of 0.81, meaning there were 19 percent fewer deaths
than would be expected, given patient severity. With an index of 0.94, peer hospitals
had only 6 percent fewer valve mortalities than expected.
§ Benchmark hospitals had 7 percent fewer complications than their peers.
§ Benchmark hospitals were markedly more efficient, too, with more than one day
shorter length of stay and an over $8,000 lower cost per case on valve patients, as
compared to peer hospitals.
Between 2010 and 2014, the number of Medicare inpatient valve procedures increased from 71,932 to 92,744, while the number of CABG procedures for the same population decreased from 133,763 to 121,398. This relative increase in the percentage of major cardiovascular procedures due to valves can be tied to a 37 percent increase in aortic valve procedures, from 49,005 to 62,023. Possible reasons for this increase include aging of the population and greater awareness of the benefits of aortic valve replacement in older patients.4,5

1350 TOP CARDIOVASCULAR HOSPITALS
Table 5: National Valve Patient Group Performance Comparisons (All Hospitals in Study)
Performance Measure Benchmark Median
Peer Median
Benchmark Compared With Peer Group
Difference Percent Difference
How Benchmark Hospitals Outperform Peer Hospitals
Clinical Outcome Measuresa
Valve Risk-Adjusted Mortality Index 0.81 0.95 -0.14 -14.7 Lower Mortality
Valve Risk-Adjusted Complications Index 0.90 0.97 -0.07 -7.2 Fewer Complications
Efficiency Measures
Valve Severity-Adjusted ALOS (days) 8.6 9.9 -1.3 -13.5 Shorter ALOS
Valve Wage- and Severity-Adjusted Average Cost per Case ($)
$41,893 $50,666 -$8,773 -17.0 Lower Cost per Case
a. MEDPAR 2013 and 2014, combined
Potential New Measures for Future StudiesEvery year, we evaluate the 50 Top Cardiovascular Hospitals study and explore whether
new measures would enhance the value of the analysis we provide. For the 2016 study,
we continue to test the following new performance measures to update basic standards
of inpatient care and to expand the balanced scorecard across the continuum of care.
If you would like to provide feedback on these proposed measures, please email
30-Day Mortality and Readmission Rates for CABGNew to the CMS Hospital Compare dataset is another pair of extended care performance
measures. We are publishing the CABG 30-day mortality and 30-day readmission rates
for information only this year, but our analysis shows benchmark hospitals outperformed
peer hospitals on both measures. However, the differences are small. (See Table 6.)
Table 6: National Performance Comparisons for CABG 30-Day Mortality and 30-Day Readmission Rates (All Hospitals in Study)
Performance Measure Benchmark Median
Peer Median
Benchmark Compared With Peer Group
Difference Percent Difference
How Benchmark Hospitals Differ From Peer Hospitals
Extended Outcome Measures
CABG 30-Day Mortality (%)a,b 2.7 3.1 -0.4 n/a Lower 30-Day Mortality
CABG 30-Day Readmission (%)a,b 14.8 14.9 -0.2 n/a Lower 30-Day Readmissions
a. CMS Hospital Compare July 1, 2011 − June 30, 2014b. We do not calculate percentage difference for measures already expressed as a percent

14 50 TOP CARDIOVASCULAR HOSPITALS
30-Day Episode-of-Care Payment Measures for AMI and Heart FailureCMS has introduced new payment and value of care measures recently. The risk-
standardized, 30-day episode-of-care payment measures for heart attack and heart
failure are included here for information only. These values represent the payments made
for the care and supplies for AMI and HF patients, beginning with the day of hospital
admission through the next 30 days. The data time period for these measures is the same
as with the other 30-day measures, a rolling three years, July 1, 2011 – June 30, 2014.
Comparing benchmark hospitals and peers produces mixed results for these episode-
of-care payment measures, as shown in Table 7.
§ The benchmark median payment for AMI patients was $369 less than the peer
median payment.
§ Conversely, the peer median payment for HF patients was slightly lower than the
benchmark group at $73.
Table 7: National Performance Comparisons for Episode Revenue Payments (All Hospitals in Study)
Performance Measure Benchmark Median
Peer Median
Benchmark Compared With Peer Group
Difference Percent Difference
How Benchmark Hospitals Differ From Peer Hospitals
Efficiency Measures
Episode Payment for AMI patientsa $22,264 $22,633 -$369 -1.6 Lower Payment per Case
Episode Payment for HF patientsa $16,228 $16,155 $73 0.4 Higher Payment per Case
a. CMS Hospital Compare July 1, 2011 − June 30, 2014

1550 TOP CARDIOVASCULAR HOSPITALS
The Truven Health 50 Top Cardiovascular Hospitals study
is based on quantitative research that uses a balanced
scorecard approach, based on publicly available data,
to identify the top cardiovascular hospitals in the United
States. This study focuses on short-term, acute care,
nonfederal U.S. hospitals that treat a broad spectrum of
cardiology patients. It includes patients requiring medical
management, as well as those who receive invasive or
surgical procedures. Because multiple measures are used,
a hospital must provide all forms of cardiovascular care,
including open-heart surgery, to be included in the study.
OverviewThe main steps used in the selection of the 50 Top Cardiovascular Hospitals study
winners are:
1. Building the database of hospitals, including special selection and exclusion criteria
2. Classifying hospitals into comparison groups
3. Scoring hospitals on a set of weighted performance measures
4. Determining the 50 hospitals with the best performance by rankings relative to
comparison group
The following section is intended to be an overview of these steps. To request more
detailed information on any of the study concepts outlined here, please email us at
[email protected] or call +1.800.366.7526.
Building the Database of Hospitals
Primary Data Sources Like all Truven Health 100 Top Hospitals® studies, the 50 Top Cardiovascular Hospitals
study uses only publicly available data. The data come from:
§ MEDPAR dataset
§ CMS Hospital Compare dataset
§ Medicare Cost Report
Methodology

16 50 TOP CARDIOVASCULAR HOSPITALS
We use MEDPAR patient-level record information to calculate mortality, complications,
and length of stay (LOS). MEDPAR is also used for patient-level charge data in estimating
cost per adjusted discharge. This dataset contains information on approximately 15
million Medicare patients who are discharged from the nation’s acute care hospitals
annually. We used the two most recent years of MEDPAR data available, 2013 and 2014, in
this study. To be included, a hospital must have both years of data available.
We use Medicare Cost Reports to create our proprietary database, which contains
hospital-specific demographic information and hospital-specific, all-payer cost and
charge data. The hospital cost-to-charge ratios are applied to MEDPAR patient-level
claims data to estimate cost for the study’s cost measures. This is done at the cost-center
and charge-code levels for each patient record. For this study, we used 2014 (2013 when
2014 was not available) cost report data to determine the ratio of cost to charges.
The Medicare Cost Report is filed annually by every U.S. hospital that participates
in the Medicare program. Hospitals are required to submit cost reports to receive
reimbursement from Medicare. It should be noted, however, that cost report data include
services for all patients, not just Medicare beneficiaries.
Truven Health and many others in the healthcare industry have used the MEDPAR
and Medicare Cost Report databases for many years. We believe they are accurate
and reliable sources for the types of analyses performed in this study. Medicare data
are highly representative of the cardiovascular patients included in this study. In fact,
Medicare inpatients usually represent about two-thirds of all patients undergoing medical
treatment for heart attack or experiencing heart failure, and about half of all patients
undergoing PCI or CABG.
Furthermore, many previous academic and economic studies of healthcare in the
U.S. have been based on the assumption that Medicare data are representative of the
all-payer activity at hospitals.
We used the CMS Hospital Compare dataset published in the second quarter of 2015 for
core measures, 30-day mortality, and 30-day readmission rate performance measures.
Finally, we used residency program information to classify teaching hospitals. These data
were obtained from the American Medical Association (AMA) (Accreditation Council
for Graduate Medical Education [ACGME]-accredited programs) and the American
Osteopathic Association (AOA).
Present-on-Admission DataThe Truven Health propriety severity-adjustment models for mortality, complications,
LOS, and cost per case now include present-on-admission (POA) data that was reported
in the 2013 and 2014 MEDPAR datasets (2014 only for LOS and cost). Under the Deficit
Reduction Act of 2005, as of federal fiscal year 2008, hospitals receive a reduced
payment for cases with certain conditions — such as falls, surgical-site infections, and
pressure ulcers — that were not present on the patient’s admission but occurred during
hospitalization. As a result, CMS now requires all inpatient prospective payment system
hospitals to document whether a patient has these conditions when admitted.6
The Effect of POA Data on Complication RatesSince 2008, CMS regulations have required all inpatient prospective payment system hospitals to document whether a patient has certain conditions when admitted; these are coded as Present on Admission (POA). Our complication rate methodology now uses this POA data. Consequently, the complication rates now exclude “false-positive” complications and are more accurate. In addition, our mortality, complications, LOS, and cost-per-case risk models develop expected values based only on conditions that were present on admission.

1750 TOP CARDIOVASCULAR HOSPITALS
Hospitals and Patient Groups IncludedThe focus of the study is on hospitals that offer both medical and surgical treatment
options for patients with two of the most common cardiovascular conditions — AMI and HF.
To build such a database, we included all hospitals that had, in the 2013 and 2014 data years
combined, at least 30 unique cases7 in each of the groups described below.
1. AMI patients in MS-DRGs 280–285 with the following ICD-9-CM codes as primary
diagnosis only:
410.01 Acute myocardial infarction of anterolateral wall, initial episode of care
410.11 Acute myocardial infarction of other anterior wall, initial episode of care
410.21 Acute myocardial infarction of inferolateral wall, initial episode of care
410.31 Acute myocardial infarction of inferoposterior wall, initial episode of care
410.41 Acute myocardial infarction of other inferior wall, initial episode of care
410.51 Acute myocardial infarction of other lateral wall, initial episode of care
410.61 Acute myocardial infarction, true posterior wall infarction, initial episode of care
410.71 Acute myocardial infarction, subendocardial infarction, initial episode of care
410.81 Acute myocardial infarction of other specified sites initial episode of care
410.91 Acute myocardial infarction, unspecified site, initial episode of care
The AMI group is restricted to nonsurgical patients.
2. HF patients in MS-DRGs 291–293 with the following ICD-9-CM code as primary
diagnosis only:
398.91 Rheumatic heart failure
402.01 Malignant hypertensive heart disease
402.11 Benign hypertensive heart disease
402.91 Unspecified hypertensive heart disease
404.01 Malignant hypertensive heart and renal disease
404.03 Malignant hypertensive heart and renal disease with renal failure
404.11 Benign hypertensive heart and renal disease
404.13 Benign hypertensive heart and renal disease with renal failure
404.91 Unspecified hypertensive heart and renal disease
404.93 Unspecified hypertensive heart and renal disease with renal failure
428.0 Unspecified congestive heart failure
428.1 Left heart failure
428.20 Unspecified systolic heart failure
428.21 Acute systolic heart failure
428.22 Chronic systolic heart failure
428.23 Acute on chronic systolic heart failure
428.30 Unspecified diastolic heart failure
428.31 Acute diastolic heart failure
428.32 Chronic diastolic heart failure
428.33 Acute on chronic diastolic heart failure
428.40 Unspecified combined systolic and diastolic heart failure
428.41 Acute combined systolic and diastolic heart failure
428.42 Chronic combined systolic and diastolic heart failure
428.43 Acute on chronic combined
428.9 Unspecified heart failure

18 50 TOP CARDIOVASCULAR HOSPITALS
The HF category is restricted to nonsurgical patients.
3. PCI patients in MS-DRGs 246−251 with any of the following ICD-9-CM
procedure codes:
00.66 PTCA (percutaneous transluminal coronary angioplasty)
36.06 Insertion of coronary artery stent(s)
36.07 Insertion of drug-eluting coronary artery stent(s)
17.55 Transluminal coronary athrectomy
Patients with the 36.06 or 36.07 codes are excluded if they also have the procedure code
36.03 (open chest coronary artery angioplasty).
4. CABG patients in MS-DRGs 231–236 with any (primary or secondary) of the following
ICD-9-CM procedure codes:
36.10 Aortocoronary bypass, unspecified number of arteries
36.11 Aortocoronary bypass, one coronary artery
36.12 Aortocoronary bypass, two coronary arteries
36.13 Aortocoronary bypass, three coronary arteries
36.14 Aortocoronary bypass, four or more coronary arteries
36.15 Single internal mammary-coronary artery bypass
36.16 Double internal mammary-coronary artery bypass
36.17 Abdominal-coronary artery bypass
36.19 Other bypass anastomosis for heart revascularization
When a patient record has both PCI and CABG procedures, we place them into the CABG
group for all performance measures.
Patient Records ExcludedThe AMI and HF groups explicitly exclude patients who also had a PCI and/or CABG
procedure. This ensures we have exclusively medical patients in these groups.
Also excluded are:
§ Patients who were discharged to another short-term facility (to avoid double-counting)
§ Patients who were not at least 65 years old
Hospitals ExcludedAfter building the database of cardiovascular hospitals, we excluded a number of
hospitals that would have skewed the study results. Excluded from the study were:
§ Hospitals with fewer than 30 unique patient records in each patient group
(AMI, HF, CABG, and PCI) for the two MEDPAR years combined
§ Specialty hospitals, other than cardiac hospitals (e.g., critical access hospitals,
children’s, women’s, psychiatric, substance abuse, rehabilitation, and long-term
acute care hospitals)
§ Hospitals with fewer than 25 acute care beds

1950 TOP CARDIOVASCULAR HOSPITALS
§ Federally owned hospitals
§ Non-continental U.S. hospitals (such as those in Puerto Rico, Guam, and the
Virgin Islands)
§ Hospitals with Medicare average LOS longer than 30 days
§ Hospitals with no reported deaths
§ Hospitals that do not have both 2013 and 2014 Medicare claims
§ Hospitals missing data for calculation of one or more performance measures
§ Hospitals for which a Medicare Cost Report was not available for 2014 or 2013
§ Hospitals that did not code POA information on their 2014 and 2013 MEDPAR data
Classifying Hospitals Into Comparison GroupsBed size, teaching status, and residency/fellowship program involvement have a profound
effect on the types of patients a hospital treats and the scope of services it provides.
When analyzing the performance of an individual hospital, it is crucial to evaluate it
against other similar hospitals. To address this, we assigned each hospital to one of three
comparison groups according to its teaching and residency program status.
Our formula for defining the cardiovascular hospital comparison groups includes
each hospital’s bed size, residents-to-beds ratio, and involvement in graduate medical
education (GME) programs accredited by either the ACGME8 or the AOA.9 We define the
groups as follows.
Teaching Hospitals With Cardiovascular Residency ProgramsHospitals in this category must be involved in a cardiovascular residency program
accredited by the ACGME or the AOA. Cardiovascular residency programs include any
of the following:
§ Cardiology
§ Cardiothoracic surgery
§ Cardiovascular disease
§ Cardiovascular medicine
§ Interventional cardiology
§ Thoracic surgery
§ Thoracic surgery − integrated
§ Advanced heart failure and transplant cardiology
Additionally, hospitals in this category must meet any two of the following three criteria:
1. 200 or more acute care beds in service
2. An intern/resident-per-bed ratio of at least 0.03
3. Involvement in at least three accredited GME programs overall
Clinical cardiac electrophysiology and cardiovascular radiology residency programs are
not included.

20 50 TOP CARDIOVASCULAR HOSPITALS
Teaching Hospitals Without Cardiovascular Residency ProgramsHospitals in this category have no involvement in a cardiovascular residency program.
These hospitals must meet any two of the following three criteria:
1. 200 or more acute care beds in service
2. An intern/resident-per-bed ratio of at least 0.03
3. Involvement in at least three accredited GME programs overall
Community HospitalsMust meet both of the following criteria:
1. 25 or more acute care beds in service
2. Not classified as a teaching hospital per definitions above
Bed size and number of interns/residents (full-time equivalents) are taken from each
hospital’s Medicare Cost Report for 2014 or 2013 (the most current year available).
Cardiovascular Study GroupsThe final study group counts, after exclusions, are listed below.
Comparison Group Total
Teaching Hospitals With Cardiovascular Residency Programs 229
Teaching Hospitals Without Cardiovascular Residency Programs 299
Community Hospitals 489
Total In-Study Hospitals 1,017
Scoring Hospitals on Weighted Performance Measures
Evolution of Performance Measures We use a balanced scorecard approach, based on public data, to select the measures
most useful for boards and CEOs in the current operating environment. We gather
feedback from industry leaders, hospital executives, academic leaders, and internal
experts; review trends in the healthcare market; and survey hospitals in demanding
marketplaces to learn what measures are valid and reflective of top performance.
As the market has changed, our methods have evolved.
The measures used in this year’s study, along with their data sources, are:
Category Ranked Performance Metric Data Source
Clinical Outcome
1. Risk-Adjusted Mortality (AMI, HF, CABG, PCI) MEDPAR federal fiscal year (FFY) 2013 and 2014
2. Risk-Adjusted Complications (CABG, PCI) MEDPAR federal fiscal year (FFY) 2013 and 2014
Clinical Process
3. Core Measures (AMI, HF, Surgical Care Improvement Project [SCIP], Outpatient Imaging Efficiency)
CMS Hospital Compare(Oct. 1, 2013 – Sept. 30, 2014 dataset)
4. Percentage of CABG Patients With IMA Use MEDPAR FFY 2013 and 2014
Extended Outcome
5. 30-Day Mortality Rates (AMI, HF)CMS Hospital Compare(July 1, 2011 – June 30, 2014 dataset)
6. 30-Day Readmissions (AMI, HF)CMS Hospital Compare(July 1, 2011 – June 30, 2014 dataset)
Efficiency 7. Severity-Adjusted Average LOS (AMI, HF, CABG, PCI) MEDPAR FFY 2014
8. Wage- and Severity-Adjusted Average Cost per Case (AMI, HF, CABG, PCI) MEDPAR FFY 2014

2150 TOP CARDIOVASCULAR HOSPITALS
Below, we provide rationale for the selection of our balanced scorecard domains and the
measures used for each.
Clinical ExcellenceClinical excellence can be measured by looking at several key domains: outcomes,
process, and extended outcomes.
Our clinical outcome measures are the risk-adjusted mortality indexes for all included
cardiovascular patient groups (AMI, HF, CABG, and PCI) and risk-adjusted complications
indexes for CABG and PCI patient groups. These mortality and complications measures
show us how the provider is performing on the most basic and essential care standards
— survival and error-free care — while treating patients in the facility. Our study
incorporates a comprehensive, risk-adjusted complications model that includes 47
possible patient complications with expected probabilities calculated from a large
national inpatient database. For more information, see the measures details in the table
on the following page and read about our mortality and complications models in
the Appendix.
Clinical process measures include selected heart attack, heart failure, surgical care,
and outpatient imaging efficiency Core Measures, along with the percentage of CABG
patients with internal mammary artery use. Core Measures were developed by The
Joint Commission and endorsed by the National Quality Forum as minimum process-
of-care standards. They are widely accepted methods for measuring patient care
quality that include specific guidelines for heart attack or chest pain, heart failure,
pneumonia, pregnancy and related conditions, and surgical care improvement. Our Core
Measures performance is based on the four Core Measures selected as relevant to the
cardiovascular patient groups included in the study, using publicly available CMS Hospital
Compare data. The clinical advantages of using an internal mammary graft are many and
have been spelled out in numerous studies over the last two decades.10–19
The study’s extended outcomes domain includes 30-day mortality rates and 30-day
readmission rates for AMI and HF patients. These measures help us understand how
the hospital’s patients are faring over a longer period of time and may indicate both
discharge appropriateness and effectiveness of follow-up care coordination. Hospitals
with lower values appear to be providing care with better medium-term results for
these conditions.
Service Delivery EfficiencyWe use severity-adjusted average LOS and wage- and severity-adjusted cost per case
as our measures of service delivery efficiency. For the life of the study, severity-adjusted
average LOS has served as a proxy for clinical efficiency, and cost per case has served as
a measure of both clinical and operating efficiency. Cost per case provides insight into
how cost-effectively a hospital is caring for its patients. Wage and severity adjustments
consider patient illness and labor market cost differences, and help ensure that we’re
making fair comparisons among hospitals.

22 50 TOP CARDIOVASCULAR HOSPITALS
Risk-Adjusted Mortality Index
Why We Include This Element Calculation Comments Favorable Values Are
While all hospitals have patient deaths, this measure shows where deaths occurred that would not have been expected considering a patient’s medical condition.
The Risk-Adjusted Mortality Index is the number of actual deaths in 2013 and 2014, divided by the number expected.
We normalize the index based on the observed and expected deaths for each comparison group and for each patient group (AMI, HF, CABG, and PCI). Expected deaths are based on our statistical model for predicting the likelihood of a patient’s death based on age, sex, presence of complicating diagnoses (POA only), and other characteristics. See the Appendix for details.
The reference value for this index is 1.00; a value of 1.15 indicates 15 percent more events than predicted, and a value of 0.85 indicates 15 percent fewer.
We used two years of MEDPAR data (2013 and 2014) to reduce the influence of chance fluctuation.
We based the scoring for each patient group (AMI, HF, CABG, and PCI) on the difference between observed and expected deaths, expressed in normalized standard deviation units (z-score). Hospitals with the fewest deaths, relative to the number expected, after accounting for standard binomial variability, received the highest scores. Hospitals with values that were statistically worse than expected (95-percent confidence) were not eligible to be benchmark (winning) hospitals.
Each patient group under this measure received 1/2 weight in the final overall ranking process.
Lower
Risk-Adjusted Complications Index
Why We Include This Element Calculation Comments Favorable Values Are
Keeping patients free from potentially avoidable complications is an important goal for all healthcare providers. A lower complications index indicates fewer patients with complications, considering what would be expected based on patient characteristics. Like the mortality index, this measure can show where complications did not occur but were expected, or the reverse, given the patient’s condition.
We calculate an index value based on the number of cases with complications in 2013 and 2014 combined, divided by the number expected, given the risk of complications for each patient.
We normalize the index based on the observed and expected complications for each hospital comparison group and for the two patient groups (CABG and PCI). This measure uses our proprietary expected complications rate index models. These models account for patient-level characteristics (age, sex, principal diagnosis, comorbid conditions (POA only), and other characteristics). Complication rates are calculated from normative data for two patient risk groups: medical and surgical. For more details on the model, see the Appendix.
The reference value for this index is 1.00; a value of 1.15 indicates 15 percent more complications occurred than were predicted, and a value of 0.85 indicates15 percent fewer complications than predicted.
We used two years of MEDPAR data (2013 and 2014) to reduce the influence of chance fluctuation.
We based the scoring for each included patient group (CABG and PCI) on the difference between the observed and expected number of patients with complications, expressed in normalized standard deviation units (z-score). Hospitals with the fewest observed complications, relative to the number expected, after accounting for standard binomial variability, received the most favorable scores. Hospitals with values that were statistically worse than expected (95-percent confidence) were not eligible to be benchmark (winning) hospitals.
Each patient group under this measure received 1/4 weight in the final overall ranking process.
Lower

2350 TOP CARDIOVASCULAR HOSPITALS
Core Measures Mean Percent
Why We Include This Element Calculation Comments Favorable Values Are
To be truly balanced, a scorecard must include various measures of quality. Core Measures, developed by The Joint Commission and CMS, and endorsed by the National Quality Forum, are widely accepted methods for measuring patient care quality that include specific guidelines for cardiovascular patient care (selected AMI, HF, SCIP, and outpatient Core Measures).
Core Measures values are from the CMS Hospital Compare public dataset. We included four of the available Core Measures that are currently sanctioned by CMS as appropriate for use: one heart attack, one heart failure, one SCIP, and one outpatient. For a list of the measures used, see the Appendix.
For each hospital, we calculate the mean of the reported Core Measures percent values for included Core Measures.
We consider reported Core Measures percents with patient counts that are less than or equal to 25, or that have relative standard error values greater than or equal to 0.30, to be statistically unreliable. In these cases, we substitute the class median percent value for the affected Core Measure.
If the hospital did not report a specific Core Measure, or if the Core Measure was based on too few patients to be sufficiently precise, we substituted the median percent for the comparison group.
Core Measure values are from the CMS Hospital Compare dataset published the second quarter of 2015 (with data from Oct. 1, 2013, through Sept. 30, 2014, for inpatient measures and July 1, 2013, through June 30, 2014, for outpatient measures).20
The Core Measures mean received a weight of 1/2 in the final overall ranking process.
Higher
Percentage of CABG Patients With Internal Mammary Artery Use
Why We Include This Element Calculation Comments Favorable Values Are
The clinical advantages of using an internal mammary graft are many. Studies over the last two decades have confirmed the benefits of internal mammary artery grafts over saphenous (leg) vein grafts, with a higher patency rate being the most significant clinical benefit.10–19
On a patient-specific basis, certain factors may promote or prohibit the use of an internal mammary graft. However, it is reasonable to use the overall rate at which these grafts are performed as a measure of hospital quality.
The calculation used is the number of CABG surgeries using internal mammary arteries, divided by the total number of CABG surgeries. Patients with prior CABG surgeries are excluded from the calculation.
We used two years of MEDPAR data (2013 and 2014) to reduce the influence of chance fluctuation.
This measure received a weight of 1/2 in the final overall ranking process.
Higher
30-Day Mortality Rates for AMI and HF Patients
Why We Include This Element Calculation Comments Favorable Values Are
30-day mortality rates are an accepted measure of the effectiveness of overall hospital care. They allow us to look beyond immediate patient outcomes and understand how the care the hospital provided to inpatients with these particular conditions may have contributed to their longer-term survival. Because these measures are part of CMS value-based purchasing program, they are now being watched closely in the industry. In addition, tracking these measures may help hospitals identify patients at risk for post-discharge problems and target improvements in discharge planning and aftercare processes. Hospitals that score well may be better prepared for risk-based population health payment systems.
CMS calculates a 30-day mortality rate for each patient condition using three years of MEDPAR data combined. CMS does not calculate rates for hospitals where the number of cases is too small (less than 25). We build a database of this information for the hospitals in our study then rank the hospitals independently on each of the two conditions (AMI and HF) by hospital comparison group.
The rates are presented as percentages. A 15-percent 30-day mortality rate would indicate that 15 percent of patients died, of any cause, within 30 days of the original admission date.
Data are from the CMS Hospital Compare dataset for the second quarter of 2015. This contains data from July 1, 2011, through June 30, 2014.20 For more information about this data, see the Appendix.
Each patient condition receives 1/4 weight in the final overall ranking process.
Lower

24 50 TOP CARDIOVASCULAR HOSPITALS
30-Day Readmission Rates for AMI and HF Patients
Why We Include This Element Calculation Comments Favorable Values Are
30-day readmissions are an accepted measure of the effectiveness of overall hospital care. They allow us to understand how the care the hospital provided to inpatients with these particular conditions may have contributed to issues withtheir post-discharge medical stability and recovery. It is important to track these measures as it may help hospitals identify patients at risk for post-discharge problems if discharged too soon, as well as target improvements in discharge planning and aftercare processes. Hospitals that score well may be better prepared for risk-based population health payment systems.
CMS calculates a 30-day readmission rate for each patient condition using 3 years of MEDPAR data combined. CMS does not calculate rates for hospitals where the number of cases is too small (less than 25). We build a database for the hospitals in our study then rank the hospitals independently on readmission indexes for each of the two conditions (AMI and HF) by hospital comparison group.
The rates are presented as percentages. A 15-percent 30-day readmission rate would indicate that 15 percent of patients were readmitted to an acute care hospital within 30 days of discharge.
Data are from the CMS Hospital Compare dataset for the second quarter of 2015. This contains data from July 1, 2011, through June 30, 2014.20 For more information about this data, see the Appendix.
Each patient condition receives 1/4 weight in the overall ranking process.
Lower
Severity-Adjusted Average Length of Stay (ALOS)
Why We Include This Element Calculation Comments Favorable Values Are
A lower severity-adjusted ALOS (average number of days spent by a patient ina hospital) generally indicates a more efficient consumption of hospital resources and, possibly, reduced risk to patients.
We calculate an LOS index value for each patient group (AMI, HF, CABG, and PCI) based on the sum of the patient-level LOS divided by the sum of the normalized expected LOS. Expected LOS adjusts for differences in severity of illness using a linear regression model. We normalize the expected values based on the observed and expected LOS for each patient group (AMI, HF, CABG, and PCI) by hospital comparison group.
Each patient group LOS index is converted into an ALOS in days by multiplying it by the grand mean LOS of the in-study patient population overall.
See the Appendix for more information.
Data for this measure are from 2014MEDPAR only.
We adjust ALOS to factor out differences attributable to the varying severity of illness of patients at each hospital. We used POA-enabled risk models. For more information on POA, see the Appendix.
LOS performance for each patient group (AMI, HF, PCI, and CABG) received a weight of 1/4 in the final overall ranking process.
Lower

2550 TOP CARDIOVASCULAR HOSPITALS
Determining the 50 Top Cardiovascular Hospitals
RankingWithin each of the three hospital comparison groups, we ranked hospitals based on
their performance on each of the measures independently, relative to other hospitals in
their groups. Each performance measure is assigned a weight for use in overall ranking.
The weights for each measure are indicated in the table below. Each hospital’s measure
ranks were summed to arrive at a total score for the hospital. The hospitals were then
ranked based on their total scores, and the hospitals with the best overall ranks in each
comparison group were selected as the benchmarks (winning hospitals).
Severity- and Wage-Adjusted Cost per Case
Why We Include This Element Calculation Comments Favorable Values Are
This measure helps to determine how cost-effectively a hospital is caring for its patients. Ideally, best value is achieved when patients receive high-quality care, with good outcomes, at the lowest cost. Hospitals that score well may be better prepared for risk-based population health payment systems.
We calculate a cost-per-case index value for each patient group (AMI, HF, CABG, and PCI) based on the sum of the patient- level estimated cost divided by the sum of the normalized expected cost. Cost data are wage-adjusted. We calculate estimated cost by applying the hospital cost-to-charge ratios for each cost center from the 2014 or 2013 cost report (most current available) to the patient-level charges in MEDPAR.
Expected cost adjusts for differences in severity of illness using a linear regression model. We normalize the expected values based on the observed and expected cost per case for each patient group (AMI, HF, CABG, and PCI) by hospital comparison group.
Each patient group cost-per-case indexis converted into an average cost per case expressed in dollars by multiplying it by the grand mean cost per case of the in-study patient population overall.
See the Appendix for more information.
Cost-to-charge ratios are from the hospital’s 2014 Medicare Cost Report (2013 cost reports used when 2014 were not available). In this study, we used the total cost-to-charge ratio reported by the hospital.
Charge data for this measure are from 2014 MEDPAR only.
We adjust cost to factor out differences attributable to the varying severity of illness of patients at each hospital. We wage-adjust costs to allow for regional wage variations. We use the 2014 CMS wage index for the profiled hospital. We use POA-enabled risk models. For more information on POA, see the Appendix.
Each cost-per-case measure (AMI, HF, PCI, and CABG) received a weight of 1/4 in the final overall ranking process.
Lower

26 50 TOP CARDIOVASCULAR HOSPITALS
Ranked Performance Metric Patient Group Weight
Risk-Adjusted Mortality (Normalized Z-Score)
AMI 1/2
HF 1/2
CABG 1/2
PCI 1/2
Risk-Adjusted Complications (Normalized Z-Score)CABG 1/4
PCI 1/4
Core Measures Mean Percent 1/2
Percentage of CABG Patients With IMA Use 1/2
30-Day Mortality RateAMI 1/4
HF 1/4
30-Day Readmission RateAMI 1/4
HF 1/4
Severity-Adjusted ALOS (Normalized Index)
AMI 1/4
HF 1/4
CABG 1/4
PCI 1/4
Wage- and Severity-Adjusted Average Cost per Case (Normalized Index)
AMI 1/4
HF 1/4
CABG 1/4
PCI 1/4
Note: Mortality and complications normalized z-scores are converted to indexes for reporting. We convert LOS and cost-per-case indexes to ALOS and average cost per case, respectively, for reporting. For more details, see the performance measure table on the preceding pages, for each measure.
Comparison Group Total
Teaching Hospitals With Cardiovascular Residency Program 15
Teaching Hospitals Without Cardiovascular Residency Program 20
Community Hospitals 15
Total 50
Screening for OutliersTo reduce the impact of unsustainable performance anomalies and reporting anomalies
or errors, hospitals with one or more mortality or complications index values that were
high statistical outliers (95-percent confidence) were not eligible to be winners.
Also, hospitals with costs per case for any patient group that were high or low statistical
outliers (using interquartile range-trimming methodology) were not eligible to be
winners. In addition, any hospital that had less than 11 cases in any one of the four patient
groups (AMI, HF, PCI, and CABG) in the current data year (2014) was not eligible to be a
winner. The number of hospitals selected to receive the 50 Top Cardiovascular Hospitals
award in each hospital comparison group was as follows:

2750 TOP CARDIOVASCULAR HOSPITALS
Normative Database DevelopmentFor the cardiovascular study, Truven Health constructed a normative database of case-
level data from its Projected Inpatient Database (PIDB), a national all-payer database
containing more than 27 million all-payer discharges annually. These data are obtained
from approximately 3,700 hospitals, representing over 68 percent of all discharges from
short-term, general, nonfederal hospitals in the U.S. (PIDB discharges are statistically
weighted to represent the universe of all short-term, general, nonfederal hospitals in
the U.S.) Demographic and clinical data are also included: age, sex, and LOS; clinical
groupings (MS-DRGs), ICD-9-CM principal and secondary diagnoses, and ICD-9-CM
principal and secondary procedures; present-on-admission coding; admission source
and type; and discharge status.
Present-on-Admission DataUnder the Deficit Reduction Act of 2005, as of federal fiscal year (FFY) 2008, hospitals
receive reduced payments for cases with certain conditions — such as falls, surgical site
infections, and pressure ulcers — that were not present on the patient’s admission, but
occurred during hospitalization. As a result, CMS now requires all inpatient prospective
payment system hospitals to document whether a patient has these conditions when
they are admitted. The Truven Health proprietary risk-adjustment models for mortality,
complications, LOS, and cost per case take into account POA data reported in the
MEDPAR datasets. Our mortality, complications, LOS, and cost-per-case risk models
develop expected values based only on conditions that were present on admission.
From 2009 through 2013, there were a growing number of records with missing
POA codes, which are represented by either a space or “0” in the MEDPAR data files.
(See Figure X below.) In addition, coding of exempt diagnoses with the POA code of
“1” has apparently been dropped by hospitals. For this reason, we used the CMS exempt
code tables to identify and flag all exempt diagnoses. We also developed a methodology
to determine whether a diagnosis was usually coded as present (Y, W), for all records
with valid POA coding in our all-payer database (PIDB). Based on this analysis, we
treated codes that were found to be present greater than 50 percent of the time as
“present” in the MEDPAR file where “0” was coded. In addition, we treated all principal
diagnoses as “present.”
Appendix:
Methodology
Details

28 50 TOP CARDIOVASCULAR HOSPITALS
Methods for Identifying Patient SeverityWithout adjusting for differences in patient severity, comparing outcomes among
hospitals does not present an accurate picture of performance. To make valid normative
comparisons of hospital outcomes, we must adjust raw data to accommodate differences
that result from the variety and severity of admitted cases.
Truven Health is able to make valid normative comparisons of mortality and complications
rates by using patient-level data to control effectively for case-mix and severity
differences. Conceptually, we group patients with similar characteristics (i.e., age, sex,
principal diagnosis, procedures performed, admission type, and comorbid conditions
that are present on admission) to produce expected, or normative, comparisons. Through
extensive testing, we have found that this methodology produces valid normative
comparisons using readily available administrative data, eliminating the need for
additional data collection.21
To support the transition from ICD-9-CM to ICD-10-CM, our risk- and severity-adjustment
models have been modified to leverage the Agency for Healthcare Research and
Quality (AHRQ) Clinical Classifications System (CCS)22 categories for risk assignment.
CCS categories are defined in both coding languages with the intent of being able to
accurately compare ICD-9 categories with ICD-10 categories. Calibrating the models
using CCS categories provides the flexibility to accept and score records from either ICD-9
or ICD-10 coded data and allows for consistent results in risk and severity adjustment.
n space n 0 n 1 n N n U n W
POA = "Y" accounted for more than 99% of codes in all years. Therefore, only POA codes other than "Y" codes that are consistent with valid coding guidelines are included here.
2009 2010 2011 2012 2013
25%
20%
15%
10%
5%
0%
Figure 1: Percentage of POA Codes by Code (Excludes “Y”)

2950 TOP CARDIOVASCULAR HOSPITALS
The CCS-based approach applies to all Truven Health proprietary models that use
code-based rate tables, which include the risk-adjusted mortality index model, expected
complication risk index, cardiac-specific risk-adjusted specialty models, and patient
financial data/expected resource demand length-of-stay and cost models.
Risk-Adjusted Mortality Index ModelsTruven Health develops an overall mortality risk model, which is used for HF patients
in the cardiovascular study. In addition, because cardiovascular disease is the most
prevalent inpatient diagnostic group, we develop separate risk models for AMI, PCI, and
CABG patients. The mortality risk models used in this study are calibrated for patients
age 65 and older. Additionally, in response to the upcoming transition to ICD-10-CM,
diagnosis and procedure codes, and the interactions among them, have been mapped to
the AHRQ CCS for assignment of risk instead of using the individual diagnosis, procedure,
and interaction effects.
We exclude patients who were transferred to another short-term, acute care facility.
We also exclude all records that have Do Not Resuscitate (v49.86) coded as present
on admission from the mortality risk models. Palliative care patients (v66.7) are included
in the mortality risk models, which are calibrated to determine probability of death for
these patients.
A standard logistic regression model is used to estimate the risk of mortality for each
eligible discharge. This is done by weighting the patient records of the profiled hospital
by the logistic regression coefficients associated with the corresponding terms in the
model and the intercept term. This produces the expected probability of an outcome
for each eligible patient (numerator) based on the experience of the norm for patients
with similar characteristics (age, clinical grouping, severity of illness, and so forth).23–27
After assigning the predicted probability of the outcome for each patient, the patient-
level data can then be aggregated across a variety of groupings, including hospital,
service, or the MS-DRG classification systems, which were originally developed at
Yale University in the 1980s.
This model takes into account only patient conditions that are POA when calculating risk.
Expected Complications Rate Index ModelsRisk-adjusted complications refer to outcomes that may be of concern when they
occur at a greater-than-expected rate among groups of patients, possibly reflecting
systemic quality-of-care issues. The Truven Health complications model uses clinical
qualifiers to identify complications that have probably occurred in the inpatient setting.
Only conditions that are not coded as POA are counted as observed complications.
Additionally, in response to the upcoming transition to ICD-10-CM, diagnosis and
procedure codes, and the interactions among them, have been mapped to the AHRQ
CCS for assignment of risk instead of using the individual diagnosis, procedure and
interaction effects.
The complications used in the model are:
Hospice Versus Palliative Care PatientsSeparately licensed hospice unit patient records are not included in MEDPAR data. They have a separate billing type and separate provider numbers. In addition, patients receiving hospice treatment in acute care beds are billed under hospice, not hospital, and would not be in the MEDPAR data file.
Inpatients coded as Palliative Care (v66.7) are included in the study. Over the past few years, the number of patients coded as palliative care has increased significantly, and our risk models have been calibrated to produce valid expected values for these patients.

30 50 TOP CARDIOVASCULAR HOSPITALS
Complication Patient Group
Post-Operative Complications Relating to Urinary Tract Surgical Only
Post-Operative Complications Relating to Respiratory System, Except Pneumonia Surgical Only
GI Complications Following Procedure Surgical Only
Infection Following Injection/Infusion All Patients
Decubitus Ulcer All Patients
Post-Operative Septicemia, Abscess, and Wound Infection Surgical, Including Cardiac
Aspiration Pneumonia Surgical Only
Tracheostomy Complications All Patients
Complications of Cardiac Devices Surgical, Including Cardiac
Complications of Vascular and Hemodialysis Devices Surgical Only
Nervous System Complications From Devices/Complications of Nervous System Devices
Surgical Only
Complications of Genitourinary Devices Surgical Only
Complications of Orthopedic Devices Surgical Only
Complications of Other and Unspecified Devices, Implants, and Grafts Surgical Only
Other Surgical Complications Surgical Only
Miscellaneous Complications All Patients
Cardio-Respiratory Arrest, Shock, or Failure Surgical Only
Post-Operative Complications Relating to Nervous System Surgical Only
Post-Operative AMI Surgical Only
Post-Operative Cardiac Abnormalities Except AMI Surgical Only
Procedure-Related Perforation or Laceration All Patients
Post-Operative Physiologic and Metabolic Derangements Surgical, Including Cardiac
Post-Operative Coma or Stupor Surgical, Including Cardiac
Post-Operative Pneumonia Surgical, Including Cardiac
Pulmonary Embolism All Patients
Venous Thrombosis All Patients
Hemorrhage, Hematoma, or Seroma Complicating A Procedure All Patients
Post-Procedure Complications of Other Body Systems All Patients
Complications of Transplanted Organ (Excludes Skin and Cornea) Surgical Only
Disruption of Operative Wound Surgical Only
Complications Relating to Anesthetic Agents and CNS Depressants Surgical, Including Cardiac
Complications Relating to Antibiotics All Patients
Complications Relating to Other Anti-Infective Drugs All Patients
Complications Relating to Anti-Neoplastic and Immunosuppressive Drugs All Patients
Complications Relating to Anticoagulants and Drugs Affecting Clotting Factors All Patients
Complications Relating to Blood Products All Patients
Complications Relating to Narcotics and Related Analgesics All Patients
Complications Relating to Non-Narcotic Analgesics All Patients
Complications Relating to Anti-Convulsants and Anti-Parkinsonism Drugs All Patients
Complications Relating to Sedatives and Hypnotics All Patients
Complications Relating to Psychotropic Agents All Patients
Complications Relating to CNS Stimulants and Drugs Affecting The Autonomic Nervous System
All Patients
Complications Relating to Drugs Affecting Cardiac Rhythm Regulation All Patients
Complications Relating to Cardiotonic Glycosides (Digoxin) and Drugs of Similar Action
All Patients
Complications Relating to Other Drugs Affecting The Cardiovascular System All Patients
Complications Relating to Anti-Asthmatic Drugs All Patients
Complications Relating to Other Medications (Includes Hormones, Insulin, Iron, and Oxytocic Agents)
All Patients

3150 TOP CARDIOVASCULAR HOSPITALS
Complication rates are calculated from normative data for two patient risk groups:
medical and surgical. A standard regression model is used to estimate the risk of
experiencing a complication for each eligible discharge. This is done by weighting the
patient records of the client hospital by the regression coefficients associated with the
corresponding terms in the prediction models and intercept term. This method produces
the expected probability of a complication for each patient based on the experience
of the norm for patients with similar characteristics. After assigning the predicted
probability of a complication for each patient in each risk group, it is then possible to
aggregate the patient-level data across a variety of groupings.27–31
This model takes into account only patient conditions that are present on admission
when calculating risk.
Index InterpretationAn outcome index is a ratio of an observed number of outcomes to an expected number
of outcomes in a particular population. This index is used to make normative comparisons
and is standardized in that the expected number of events is based on the occurrence
of the event in a normative population. The normative population used to calculate
expected numbers of events is selected to be similar to the comparison population with
respect to relevant characteristics, including age, sex, region, and case mix.
The index is simply the number of observed events divided by the number of expected
events and can be calculated for outcomes that involve counts of occurrences (e.g.,
deaths or complications). Interpretation of the index relates the experience of the
comparison population relative to a specified event to the expected experience based on
the normative population.
Examples:
10 events observed ÷ 10 events expected = 1.0:
The observed number of events is equal to the expected number of events based on the
normative experience.
10 events observed ÷ 5 events expected = 2.0:
The observed number of events is twice the expected number of events based on the
normative experience.
10 events observed ÷ 25 events expected = 0.4:
The observed number of events is 60 percent lower than the expected number of events
based on the normative experience.
Therefore, an index value of 1.0 indicates no difference between observed and expected
outcome occurrence. An index value greater than 1.0 indicates an excess in the observed
number of events relative to the expected based on the normative experience. An index
value less than 1.0 indicates fewer events observed than would be expected based on
the normative experience. An additional interpretation is that the difference between
1.0 and the index is the percentage difference in the number of events relative to the
norm. In other words, an index of 1.05 indicates 5 percent more outcomes than expected,
and an index of 0.90 indicates 10 percent fewer outcomes than expected based on the
experience of the norm. The index can be calculated across a variety of groupings
(e.g., hospital, service, and MS-DRG).

32 50 TOP CARDIOVASCULAR HOSPITALS
PCI Group DefinitionWhile most patients undergoing an inpatient PCI are grouped into one of the PCI-related
MS-DRGs, a few are grouped into other MS-DRGs. Patients may be grouped into another
MS-DRG if they have a cardiac procedure considered to be higher in the DRG surgical
hierarchy than PCI, or if they have a principal diagnosis that is not cardiac in nature. The
approximate 12 percent of Medicare 2014 PCI patients grouped to other MS-DRGs tend
to have longer lengths of stay, higher costs, and more complications than those in PCI
MS-DRGs, probably because many of them have more complex surgeries during the same
hospitalization. We have confined PCI patients to those patients in a PCI-related MS-DRG
for this study.
Core MeasuresCore Measures were developed by The Joint Commission and CMS, and endorsed by
the National Quality Forum, as minimum basic care standards. They are widely accepted
methods for measuring patient care quality that include specific guidelines for heart
attack, heart failure, pneumonia, pregnancy and related conditions, and surgical infection
prevention. Our Core Measures metric for this study is based on four Core Measures
related to AMI, HF, SCIP, and outpatient imaging efficiency. Only Core Measures related to
the care of patients with cardiovascular disease are included.
For each hospital, we calculate the mean of the reported Core Measures percent values
for all included Core Measures. We consider reported Core Measures percents with
patient counts that are less than or equal to 25, or that have relative standard error values
greater than or equal to 0.30 to be statistically unreliable. In these cases, we substitute
the class median percent value for the affected Core Measure.
The included Core Measures are (CMS number for each in parentheses):
1. Heart attack or chest pain patients given PCI within 90 minutes of arrival (AMI-8a)
2. Heart failure patients given an evaluation of LVS function (HF-2)
3. Surgery patients who were taking beta blockers before coming to the hospital and
who were kept on the beta blockers during the period just before and after their
surgery (SCIP-CARD-2)
4. Outpatients who got cardiac imaging stress tests before low-risk outpatient surgery
(OP-13)
Length-of-Stay and Cost-per-Case MethodologiesThe study’s LOS and cost-per-case performance measures use Truven Health proprietary,
severity-adjusted resource-demand methodologies. In response to the upcoming
transition to ICD-10-CM, diagnosis, procedure, and interaction codes have been
mapped to AHRQ CCS for severity assignment instead of using the individual diagnosis,
procedure, and interaction effects.

3350 TOP CARDIOVASCULAR HOSPITALS
Our severity-adjusted resource-demand model allows us to produce risk-adjusted
performance comparisons on hospital LOS and costs between or across virtually any
subgroup of inpatients. These patient groupings can be based on MS-DRGs, hospitals,
product lines, geographic regions, physicians, etc. The methodology adjusts for
differences in diagnosis type and illness severity, based on ICD-9-CM coding. It also
adjusts for patient age, gender, and admission status. These models also take into
account only patient conditions that are POA when calculating risk. The associated
LOS and cost weights allow group comparisons on a national level and within a specific
market area. These weights are calculated separately for LOS and cost from the PIDB.
PIDB discharges are statistically weighted to represent the universe of all short-term,
general, nonfederal hospitals in the U.S.
This regression-based model has been demonstrated to provide accuracy in predicting
results. The POA component allows us to determine appropriate adjustments based on
previous conditions versus complications of hospitalization. We calculate expected values
from model coefficients that are normalized to the clinical group and transformed from
log scale.
We estimate costs using the cost-center-cost-to-charge ratios‡ applied to the specific
charges reported for the study’s cardiovascular patients (AMI, HF, CABG, and PCI) in the
most recent MEDPAR file. To account for geographic cost-of-living differences, expected
values are adjusted for each hospital using the CMS area wage index for the federal fiscal
year that matches the MEDPAR file year.
Performance Measure NormalizationThe mortality, complications, LOS, and cost measures are normalized, based on the
in-study population, by hospital comparison group, to provide a more easily interpreted
comparison among hospitals. To address the impact of bed size, teaching status, and
residency program involvement, and compare hospitals to other like hospitals, we assign
each hospital in the study to one of three comparison groups (teaching hospitals with
cardiovascular residency programs, teaching hospitals without cardiovascular residency
programs, and community hospitals). Detailed descriptions of the patient and hospital
comparison groups can be found in the Methodology section of this document.
For the mortality and complications measures, we base our scoring on the difference
between observed and expected events, expressed in standard deviation units (z-scores).
We normalize the individual hospital z-scores by finding the difference between the
hospital z-score and the mean z-score for its comparison group. The difference is then
divided by the standard deviation of the comparison group’s z-scores to produce the
normalized z-score for the hospital.
‡ In this study, the 2014 hospital cost reports were used unless they were unavailable; then 2013 reports were used instead.

34 50 TOP CARDIOVASCULAR HOSPITALS
For LOS and cost measures, we base our scoring on the severity-adjusted LOS index
and the wage- and severity-adjusted cost-per-case index. These indexes are the ratio of
the observed and the normalized expected values for each hospital, where the expected
values are the sum of the weights for the hospital cases included in the measure. We
normalize the individual hospital expected values by multiplying them by the ratio of the
observed-to-expected values for the comparison group. The hospital’s normalized index
is then calculated by dividing the hospital’s observed value by its normalized expected
value to produce the normalized index for the hospital.
Why We Have Not Calculated Percent Change in Specific InstancesWe do not calculate winner (benchmark) versus peer percent differences when the
performance measure value is already in units of percent. In this case, we report linear
difference only. Percent change is a meaningless statistic when the underlying quantity
can be positive, negative, or zero. The actual change may mean something, but dividing
it by a number that may be zero or of the opposite sign does not convey any meaningful
information because the amount of change is not proportional to its previous value.32

3550 TOP CARDIOVASCULAR HOSPITALS
References1 Centers for Disease Control and Prevention, Heart Disease Fact Sheet, cdc.gov/dhdsp/
data_statistics/fact_sheets/fs_heart_disease.htm, accessed Oct. 5, 2015.
2 American Heart Association Report: Costs of Heart Disease in the United States
Will Triple Between Now and 2030, fightchronicdisease.org/media-center/releases/
american-heart-association-report-costs-heart-disease-united-states-will-tripl,
accessed Oct. 5, 2015.
3 Centers for Disease Control and Prevention, National Hospital and Discharge Survey:
2010 Table (average length of stay and days of care; number and rate of discharges by
first-listed diagnostic categories)
4 Badheka AO, Singh V, Patel NJ, et al. Trends of Hospitalizations in the United States
from 2000 to 2012 of Patients > 60 Years with Aortic Valve Disease. Am J Cardiol.
2015 Jul 1;116(1):132-41.
5 Barreto-Filho JA, Wang Y, Dodson J, et al. Trends in Aortic Valve Replacement for
Elderly Patients in the United States, 1999 – 2011. JAMA. 2013 November 20; 310(19):
2078-2085.
6 For more information on the Centers for Medicare & Medicaid Services (CMS)
Hospital-Acquired Conditions (Present-on-Admission Indicator) program, see cms.
gov/HospitalAcqCond.
7 CMS has ruled that no data points based on fewer than 11 discharges may be
displayed. To comply with this rule, we excluded any values based on fewer than 11
discharges.
8 We obtain GME program involvement data annually from the Accreditation Council for
Graduate Medical Education (ACGME). This year’s study is based on ACGME files from
April 2014.
9 AOA residency information was collected from the AOA website (opportunities.
osteopathic.org) in May 2014.
10 Loop FD, Lytle BW, Cosgrove DM, et al. Influence of the Internal-Mammary-Artery
Graft on 10-Year Survival and Other Cardiac Events. N Engl J Med. January 1986;
314(1):1-6.
11 Leavitt BJ, O’Connor GT, Olmstead EM, et al. Use of the Internal Mammary Artery Graft
and In-Hospital Mortality and Other Adverse Outcomes Associated With Coronary
Artery Bypass Surgery. Circulation. 2001; 103:507-512.
12 Shahian DM, Edwards FH, Ferraris VA, et al. Quality Measurement in Adult Cardiac
Surgery: Part I – Conceptual Framework and Measure Selection. Ann Thorac Surg.
2007; 83:3-12.
13 Johnson SH, Theurer PF, Bell GF, et al. A Statewide Quality Collaborative for
Process Improvement: Internal Mammary Artery Utilization. Ann Thorac Surg. 2010;
90:1158-1164.
14 Edwards FH, Ferraris VA, Shahian DM, et al. Gender-Specific Practice Guidelines for
Coronary Artery Bypass Surgery: Perioperative Management. Ann Thorac Surg. 2005;
79:2189-2194.

36 50 TOP CARDIOVASCULAR HOSPITALS
15 Tabata M, Grab JD, Khalpey Z, et al. Prevalence and Variability of Internal Mammary
Artery Graft Use in Contemporary Multivessel Coronary Artery Bypass Graft Surgery:
Analysis of the Society of Thoracic Surgeons National Cardiac Database. Circulation
2009; 120:935E-940.
16 Tatoulis J, Buxton, BF, Fuller JA. Patencies of 2127 Arterial to Coronary Conduits Over
15 Years. Ann Thorac Surg. 2004; 77:93.
17 Sabik JF 3rd, Lytle BW, Blackstone EH, et al. Comparison of Saphenous Vein and
Internal Thoracic Artery Graft Patency by Coronary System. Ann Thorac Surg. 2005;
79:544.
18 Goldman S, Zadina K, Moritz T, et al. Long-Term Patency of Saphenous Vein and Left
Internal Mammary Artery Grafts After Coronary Artery Bypass Surgery: Results From a
Department of Veterans Affairs Cooperative Study. J Am Coll Cardiol. 2004; 44:2149.
19 Cohn LH. Use of the Internal Mammary Artery Graft and In-Hospital Mortality
and Other Adverse Outcomes Associated With Coronary Artery Bypass Surgery.
Circulation. 2001; 103:483.
20 CMS Hospital Compare can be viewed at hospitalcompare.hhs.gov.
21 Foster DA. Model-Based Resource Demand Adjustment Methodology. Ann Arbor, MI:
Truven Health Analytics Center for Healthcare Improvement, August 2008.
22 Elixhauser A, Steiner C, Palmer L. Clinical Classifications Software (CCS), 2014.
U.S. Agency for Healthcare Research and Quality. Available via: hcup-us.ahrq.gov/
toolssoftware/ccs/ccs.jsp.
23 DesHarnais SI, McMahon LF Jr., Wroblewski RT. Measuring Outcomes of Hospital Care
Using Multiple Risk-Adjusted Indexes. Health Serv Res. 26, no. 4 (Oct 1991): 425-445.
24 DesHarnais SI, et al. The Risk-Adjusted Mortality Index: A New Measure of Hospital
Performance. Medical Care. 26, no. 12 (Dec 1988): 1129-1148.
25 DesHarnais SI, et al. Risk-Adjusted Quality Outcome Measures: Indexes for
Benchmarking Rates of Mortality, Complications, and Readmissions. Qual Manag
Health Care. 5 (Winter 1997): 80-87.
26 DesHarnais SI, et al. Measuring Hospital Performance: The Development and Validation
of Risk-Adjusted Indexes of Mortality, Readmissions, and Complications. Medical Care.
28, no. 12 (Dec 1990): 1127-1141.
27 Iezzoni LI, et al. Chronic Conditions and Risk of In-Hospital Death. Health Serv Res. 29,
no. 4 (Oct 1994): 435-460.
28 Iezzoni LI, et al. Identifying Complications of Care Using Administrative Data.
Med Care. 32, no. 7 (Jul 1994): 700-715.
29 Iezzoni LI, et al. Using Administrative Data to Screen Hospitals for High Complication
Rates. Inquiry. 31, no. 1 (Spring 1994): 40-55.
30 Iezzoni LI. Assessing Quality Using Administrative Data. Ann Intern Med. 127, no. 8
(Oct 1997): 666-674.
31 Weingart SN, et al. Use of Administrative Data to Find Substandard Care: Validation of
the Complications Screening Program. Med Care. 38, no. 8 (Aug 2000): 796-806.
32 The Wall Street Journal, New York, NY. Help: Digest of Earnings (online.wsj.com/
public/resources/documents/doe-help.htm).

ABOUT TRUVEN HEALTH ANALYTICS
Truven Health Analytics delivers the answers that clients need to improve healthcare quality and access while reducing costs. We provide market-leadingperformance improvement built on data integrity and empirical truth. For more than 30 years, our insights and solutions have been providing hospitals andclinicians, employers and health plans, state and federal government agencies, life sciences companies, and policymakers the facts they need to make confidentdecisions that directly affect the health and well-being of people and organizations in the U.S. and around the world.
Truven Health Analytics owns some of the most trusted brands in healthcare, such as MarketScan, 100 Top Hospitals, Advantage Suite, Micromedex, Simpler,ActionOI, Heartbeat Experts, and JWA. Truven Health has its principal offices in Ann Arbor, Mich.; Chicago; and Denver. For more information, please visittruvenhealth.com.
truvenhealth.com | 1.800.366.7526
©2015 Truven Health Analytics Inc. All rights reserved. All other product names used herein are trademarks of their respective owners. TOP 16052 1115
For More InformationVisit 100tophospitals.com or send an email to [email protected]