Embed Size (px)
Citation preview

URBAN GREEN GROWTH IN DYNAMIC ASIA
SUMMARY OF SYNTHESIS REPORT

Notes This document summarises the key findings of OECD (2016), Urban Green Growth in Dynamic Asia, OECD Publishing, Paris. The Urban Green Growth in Dynamic Asia project explores how to promote green growth in cities in Asia, examining policies and governance practices that encourage environmental sustainability and competitiveness in a rapidly expanding economy. The main aim is to assist Southeast Asian cities in decoupling economic growth from environmental stress and to promote a long-term trajectory of sustained growth. This work is published on the responsibility of the Secretary-General of the OECD. The opinions expressed and arguments employed herein do not necessarily reflect the official views of the Organisation or of the governments of its member countries. This document and any map included herein are without prejudice to the status of or sovereignty over any territory, to the delimitation of international frontiers and boundaries and to the name of any territory, city or area. Photo credits: Cover : © Kisan / Shutterstock.com Page 14: © Potowizard / Shutterstock.com Page 15: © aphotostory / Shutterstock.com, © Travel mania/ Shutterstock.com Page 16: © Shahrin Md Ayob / Shutterstock.com Page 17: © KUMOHD/ Shutterstock.com, © Ijam Hairi / Shutterstock.com Page 18: © Ijam Hairi / Shutterstock.com Page 19: © sevenMaps7 / Shutterstock.com, © Pambudi Yoga Perdana/Shutterstock.com, © Pambudi Yoga
Perdana / Shutterstock.com Page 22: © Curioso / Shutterstock.com Page 23: © And-One / Shutterstock.com, © joyfull / Shutterstock.com

Chapter 1
The urgent need to make growth in Southeast Asian cities green...................................4
Chapter 2
Seizing untapped opportunities: Green growth policies in Southeast Asian cities...........10
Chapter 3
Governance levers to enable urban green growth in Southeast Asia..............................14
Profiles of the case study cities Bangkok, Thailand.................................................................................................... 16 Iskandar Malaysia, Malaysia………………………………………….……………………………..….…..…….18 Bandung, Indonesia...................................................................................................20 Hai Phong, Viet Nam..................................................................................................22 Cebu, Philippines....................................................................................................... 24
The Knowledge Sharing Platform on Urban Green Growth in Dynamic Asia............ 26
Urban green growth indicators for Southeast Asia................................................. 27
Table of Contents
What is urban green growth?
Policy makers’ interest in green growth has led to a call for more information on the policies which can actually bring about green growth in cities. In this regard, the OECD defines urban green growth as fostering economic growth and development through urban activities that reduce negative environmental externalities and the impact on natural resources and environmental services (OECD, 2013).
What is “green” about this growth is how it is stimulated: through urban activities (including policies and programmes) that reduce either: 1) negative environmental externalities, such as air pollution and CO2 emissions; or 2) the consumption of natural resources and environmental services, including water, energy and undeveloped land. These effects are in part the result of more readily identifiable interactions at the urban level among economic efficiency and environmental objectives. By focusing on growth, this definition recognises that polices to reduce environmental impact can only be sustained over the long term if they generate wealth (OECD, 2013).
Fostering urban green growth is critical because cities play disproportionately large roles in the economic and environmental performance of countries.
Urban green growth in dynamic Asia: Key issues
Launched in 2010, the OECD Green Cities Programme aims to assess the impact of urban sustainability and green growth policies on urban and national performance across a range of geographic, economic and national regulatory contexts, through case studies in key OECD and non-OECD cities. The aim of the programme is to better understand the concept of green growth in cities; the potential of urban policies for urban and national green growth; and to inform national, subnational and municipal governments as they seek to address economic and environmental challenges by pursuing green growth. Building on the lessons learned from previous OECD studies (which main findings are presented in Box 1.1), this study focuses on Southeast Asia and aims at answering the following questions :
• How is urban green growth different for cities in developing and emerging markets?
• What policy frameworks and instruments are needed and implementable in dynamic Asia?
• How can we facilitate knowledge sharing among OECD and fast-growing Asian cities so they all can benefit from the mutual learning process?
4
Box 1.1. Green Growth in Cities: Main findings
Green Growth in Cities (OECD, 2013) outlines some of the high priority urban policies for green growth as well as the national policies needed to complement and support these local policies. The report is illustrated with examples from six urban green growth case studies: four at the city level (Paris, Chicago, Stockholm and Kitakyushu) and two national studies (China and Korea). For example, the city-level case studies provide urban leaders with new insights on how environmental policies can contribute to different types of growth:
Job creation: the right urban sustainability policies can include retrofitting the existing building stock for improved energy efficiency. For example, the Chicago Tri-State Metropolitan area has built a regional specialty in green building design and retrofitting. In 2010, it gave 45 000 people green jobs, 36% of which were in the green building sector.
Attracting firms and workers: efficient transport systems, in particular good public transport networks, help cities lure investors. The private sector in the Paris/Île-de-France region has long recognised this and firms that benefit from proximity to the transport system contribute to its financing.
Innovation and entrepreneurship: cities can foster the growth of the green technology sector by creating green regional clusters that build on existing industries, services, research and innovation. Kitakyushu has built an impressive recycling cluster, the “Eco-Town”, which recycles hundreds of tonnes of industrial waste every day, while producing energy for residential and commercial neighbourhoods.
Increasing the value of urban land: redevelopment, infill and eco-districts can enhance land values while increasing density and reducing residents’ environmental impact. Following the success of its Hammarby Sjöstad eco-district, Stockholm is now working with the private sector to develop the Stockholm Royal Seaport eco-district. Buildings there will use less energy than others in Stockholm and the new district will have an advanced smart grid and district heating.
The report presents the role of national governments. They can enhance cities’ capacity to promote green growth by:
providing financial and technical support, clear targets, and monitoring mechanisms setting price signals and standards (for example, through carbon taxes or other pricing mechanisms) reviewing national policies’ impact on local incentives, to identify and remove perverse incentives encouraging infrastructure investment in line with sustainable development and green goals.
The report observes that local governments lack financial resources for investing in urban green infrastructure, so that efforts to diversify revenue bases become an important strategy for cities. Mobilising private finance is also important to fill the funding gap for many urban green infrastructure projects.
Source: OECD (2013), Green Growth in Cities
Chapter 1
The urgent need to make growth in Southeast
Asian cities green

The growth of Southeast Asian cities and their role in national economic development
Southeast Asia has experienced a dynamic urbanisation process that will continue in the coming decades. The aggregated urban population of ASEAN-5 (Association of Southeast Asian Nations) countries has increased from 79 million in 1980 to 271 million in 2015 and is forecasted to reach 452 million in 2050 (Table 1.1; Figure 1.1). Most of the population growth is happening in small and medium-sized cities. Around 67.7% of the urban population of the countries lived in cities with fewer than 500 000 inhabitants in 2015, against 8.6% in cities with more than 10 million inhabitants.
In parallel, Southeast Asian economies have significantly expanded: gross domestic product (GDP) per capita in the ASEAN-5 region increased from around USD 8 500 in 1985 to around USD 24 800 in 2015. Cities are the main hubs of such economic growth, although high discrepancies in wealth are observable between the largest and secondary cities. Economic growth is mostly based on competitive labour and production costs and supported by rising amounts of foreign direct investment (FDI). The growth in maritime trade also illustrates the economic dynamism of Southeast Asian market economies: container throughput in the ASEAN-5 region increased from 15.7 million TEUs (twenty foot equivalent units) in 2000 to 54 million twenty-foot equivalent units (TEUs) in 2014. While the manufacturing industry has been growing fast, the tertiary sector has been growing even faster and the economic structure of cities is increasingly dominated by services.
Fast urbanisation and growth of cities in Southeast Asia will continue in the coming decades
In recent decades, Southeast Asia has experienced one of the most dynamic urbanisation processes in the world. Within the Southeast Asian region, the ASEAN-5 countries – Malaysia, Thailand, Indonesia, the Philippines and Viet Nam – are major drivers of such trends. The combined urbanisation level of these 5 countries increased from 29.5% in 1980 to 51.4% in 2015 and is expected to reach 67.7% in 2050 (UN DESA, 2014). In comparison, high-income countries have already reached high levels of urbanisation and their growth is moderate: overall, their level of urbanisation increased from 71.8% in 1980 to 80.4% in 2015, and is expected to reach 86.7% in 2050 (UN DESA, 2014). The absolute number of urban dwellers is also rising at an impressive rate. In this regard, cities of the ASEAN-5 region concentrate most of the population growth, with an increase of 472% from 1980 to 2050, against less than 2% for rural populations and 122% at the country level over the same period.
Source: UN DESA (2014)
Figure 1.1. Urban versus rural population growth in ASEAN-5 (aggregated) 1950-2050
0
10
20
30
40
50
60
70
80
90
100
0
100
200
300
400
500
600
700
800
1950 1955 1960 1965 1970 1975 1980 1985 1990 1995 2000 2005 2010 2015 2020 2025 2030 2035 2040 2045 2050
% urbanMillion inhabitants
Rural population Urban population % urban (right axis)
Region Urbanisation level (%) Urban population (millions) 1980-2050 annual growth rate
of urban population (%) 1980 2015 2050 1980 2015 2050
ASEAN-5 29.5 51.4 67.7 79 271- 452 2.5
High-income countries 71.8 80.4 86.7 749 1 043 1 213 0.7
Table 1.1. Urbanisation level and urban population in ASEAN-5 and high-income countries 1980-2030
Source: UN DESA (2014)
5
Southeast Asia
has experienced
one of the most
dynamic
urbanisation
processes in the
world

6
0
0.1
0.2
0.3
0.4
0.5
0.6
0.7
0.8
0.9
0 10 20 30 40 50 60 70 80 90 100
GDP per capita gap relativ e to the USA
Lev el of urbanisation (%)
Indonesia Japan Korea Malaysia Phil ippines Thailand Viet Nam
1997
1997
1997
1997
1991
Source: World Development Indicators (2016)
Figure 1.2 Urbanisation level and GDP per capita ratio relative to the United States in ASEAN-5, Japan and Korea 1980-2013
Cities are drivers of robust economic growth in Southeast Asia
ASEAN-5 countries have also experienced strong economic growth: overall, GDP per capita increased from around USD 8 500 in 1985 to around USD 24 800 in 2015 despite economic crises that hit the Asian economy in 1997 and in 2008. In Indonesia, Malaysia, the Philippines, Thailand and Viet Nam, GDP per capita at constant 2010 USD increased at annual rates varying between 3% and 6% for the 2000-15 period. In comparison, GDP per capita in OECD countries increased
at an annual rate of 0.9% over the same period. The income level of ASEAN-5 countries has not only increased at the same time as urbanisation but a catching up of GDP per capita relative to the United States is also observed, showing the high correlation between both processes. The only exception is the Philippines, where the gap with the United States increased over this period, in particular when the urbanisation level decreased, as explained previously. The catching up rates of these countries have, however, been less rapid than Korea’s, whose GDP per capita ratio relative to the United States surged from 0.17 in 1980 to 0.62 in 2013 (Figure 1.2).
Source: World Bank (2016)
Figure 1.3 Container throughout in ASEAN-5 countries 2000-14
Growth supported by maritime trade
The increasing centrality of Asia’s port activity is linked to its economic growth: in 1972, approximately 40% of all world port activity took place in Europe, 20% in North America and 20% in Asia. These shares had dramatically changed by 2009, when more than half of world port activity took place in Asia, around a fifth in Europe and a tenth in North America (OECD, 2014). At a lower scale, the Southeast Asian region illustrates this
growth in port activity: according to UNCTAD Maritime Transport, the total fleet in Southeast Asia increased from 58 280 in 2002 to 150 337 in 2014. The number of container ships has increased from 5 630 to 22 069 (Maritime Insights, 2014). Container throughput has therefore increased dramatically in the region, and in 2013, the ASEAN-10 countries accounted for 13.5% of the world’s total container throughput. Container throughput is particularly high in Malaysia owing to the presence of trans-shipment ports (Figure 1.3).
0
5
10
15
20
25
2000 2001 2002 2003 2004 2005 2006 2007 2008 2009 2010 2011 2012 2013 2014
Million TEUs
Viet Nam Thailand Phil lippines Indonesia Malaysia

7
Infrastructure and environmental challenges of fast urbanisation and economic growth
Urban sprawl is one of the most visible consequences of fast urbanisation in Southeast Asia. In Iskandar Malaysia, urban areas increased by 53.5% between 2000 and 2010 (an annual growth rate of 6.7%), from around 271 km² to 416 km². In Hai Phong’s urban agglomeration, urban areas expanded by 23.5% over the same period (an annual growth rate of 1.1%), from around 161 km² to 179 km². In Metro Cebu, they expanded by
31.3% (an annual growth rate of 2.7%), from 122 km² to 160 km². Much of the urban expansion has taken place in peri-urban areas (Figure 1.4). Because of the significant population growth, densities have also risen in parallel, from 3 026 pop/km² to 3 115 pop/km² in Iskandar Malaysia’s urban areas, from 5 066 pop/km² to 6 144 pop/km² in Hai Phong’s urban agglomeration and from 8248 pop/km² to 9 442 pop/km² in Metro Cebu’s urban areas. This demonstrates a complex challenge of Southeast Asian cities in minimising the negative impacts of urban sprawl while accommodating the increasing population and economic activities.
Figure 1.4 Built-up area expansion in Hai Phong and Iskandar Malaysia 2000-10
Hai Phong
Iskandar
Source: OECD (2017b, forthcoming); OECD (2016)

8
Urban sprawl and motorisation have led to losses of natural assets and high levels of air pollution
Public services have not been able to keep up with the pace of urbanisation and economic growth, leading to enormous infrastructural and environmental challenges. The sprawl of many cities has been accompanied by fast motorisation. In Bangkok City, the motorisation rate increased from 1.2 to 2 vehicles per inhabitant between 2005 and 2013. The dramatic increase in the stock of motorised vehicles is leading to severe congestion in many cities and to concentrations of particulate matter far above the World Health Organization’s air quality standards.
Another challenge is fast-rising amounts of solid waste generated by its residents. In Bandung Metropolitan Area, this amount increased from 4 320 tonnes per day in 2006 to 7 661 tonnes per day in 2014, or an increase from 180 to 320 kg per capita per year in just eight years. Such fast increasing quantities of solid waste has posed great challenges to local governments in collecting, handling and treating such waste. Waste collection services often do not reach all residents and deposits at landfills remain the preferred treatment method. Many Southeast Asian cities have also experienced increasing water demand and situations of water stress and scarcity, aggravated by the poor coverage and quality of water supply infrastructure. Water sanitation infrastructure is also sub-
optimal and has not kept up with the pace of urbanisation. Thus the quality of water streams and bodies is often under established quality standards. In many Southeast Asian cities, informal services and infrastructure have compensated for the absence of formal structures.
Climate change risks are increasingly prominent in Southeast Asian cities
Southeast Asian cities are increasingly contributing to global greenhouse gas (GHG) emissions. The urban energy consumption has been increasing fast and is set to increase still significantly in the coming decades. In addition, fossil fuels remain the privileged source of energy. Energy-related emissions in Hai Phong accounted for 13.2 million tonnes of CO2 in 2010 and are expected to increase to 49.6 million tonnes CO2 in 2020. In parallel, a critical characteristic of Southeast Asian cities is their high vulnerability to the impacts of climate change. The annual number of natural disasters in Southeast Asia has increased from 13 in 1970 to 41 in 2014, resulting in a surge of both economic damages and the number of persons affected. Floods, typhoons, hurricanes and earthquakes are the most frequent types of disasters occurring in the region, sometimes bearing severe human and economic losses. The frequency and impacts of such disasters are expected to increase in the future, as a result of a combination of climate change impacts (such as sea-level rise), urbanisation and socio-economic changes.

9
OECD cities SoutheastAsian cities
Current
Urban green growth scenario
Low economic growth
Decoupling
environmental impacts
Strong economic growth
Strong negative
environmental impacts
Boosted economic growth
Accelerated
decoupling
Continued economic
growth
Decoupling
environmental impacts
Source: Authors.
Figure 1.5 Urban green growth scenarios in OECD cities vs. Southeast Asian cities
Social challenges of Southeast Asian cities may have long-term economic and environmental repercussions
Social challenges of Southeast Asian cities may also have long-term economic and environmental repercussions. A general trend towards the reduction of poverty is observable but urban inequalities are rising: the Gini coefficient in the main Indonesian cities has increased at a faster rate than in Indonesia overall since 2008. In addition, cities in all countries of the region still host significant numbers of slum dwellers with poor access to urban services such as solid waste collection and high vulnerability to natural disasters. Many of the urban populations of Southeast Asia, especially those living in slums, are also “off the radar” and not registered in official databases. Their settlements often do not even appear on official maps. This situation creates difficulties for national and local governments in assessing urbanisation trends and their economic and environmental repercussions. For informal settlers and workers, this implies difficulties in accessing services, infrastructure, housing, land, economic opportunities (e.g. access to credit), pensions and other forms of social services (UN HABITAT and UN ESCAP, 2015). In many cities of the region, informal transport networks, informal waste picking and recycling communities, and indeed informal water provision systems have emerged in the absence of formal structures. Such informal services have not only developed in slums and similar settlements but wherever the public services and infrastructure are missing despite there being a need from the population.
Despite reductions in poverty, rising
urban inequalities and slums remain
urgent social challenges in Southeast
Asian cities
While Southeast Asian cities are affected by a range of economic, infrastructure, environmental and social challenges, the ongoing development process nonetheless still offers “windows of opportunities” to shift towards cleaner growth models. Such momentum must be seized immediately by
national and local governments to avoid the consequences of business-as-usual development pathways. The concept of urban green growth in this regard can be a powerful vector of sustainable development in Southeast Asian cities by emphasising the existence and potential of co-benefits between economic and environmental performance. The concept, however, needs to be adapted to the local context: due to the low unemployment rates, high economic growth and infrastructure gaps of Southeast Asian cities, this report demonstrates a stronger need to green Southeast Asian cities’ growth rather than expanding the green economy sector, as promoted for OECD cities.
The urgent need to green Southeast Asian cities’ growth
In the previous case studies of OECD cities, a strong focus was placed on demonstrating that urban green growth can be an instrument to generate new green jobs and boost the economy (OECD, 2013). In contrast, the trends of urbanisation, economic growth and the associated challenges of Southeast Asian cities demonstrates that urban green growth priorities may lay in investing in urban infrastructure and in mitigating negative environmental impacts. There is more need to decouple environmental impacts and economic performance to ensure robust long-term economic growth and tackle development challenges, rather than to revitalise economic growth (Figure 1.5).

Table 2.1. Potential contribution of areas of opportunity to green growth in fast-growing Asian cities
10
Chapter 2
Seizing untapped opportunities: Green growth
policies in Southeast Asian cities
Land use and
transport
Housing and buildings
Energy Water resource management
Solid waste management
Green industries and services
Green jobs and innovation
Development of public transport can create new industries and services
Retrofitting the existing buildings can create jobs, new services and innovation
Investment in renewable energy can create jobs, new services and innovation
Investment in sanitation and new technologies (e.g. smart metering) can create jobs, new services and innovation
Promoting separation of wastes can create jobs for the urban poor
Promoting recycling of industrial waste and — energy-efficient industrial processes can create jobs, new services and innovation
Climate change adaptation and mitigation
Less automobile dependency can reduce greenhouse gas (GHG) emissions; risk-sensitive land use and preservation of natural ecosystems can reduce vulnerability to risks
Green buildings can reduce GHG emissions as well as the urban heat island effects; building codes can address vulnerability to risks
Investment in renewable energy can reduce GHG emissions
Managing water resources could reduce incidence of inland floods, drought and improve water quality and quantity
Solid waste management can reduce GHG emissions resulting from waste and avoid pollution and diseases from improper solid waste management
Green manufacturing can reduce GHG emissions and ensure efficient use of resource
Healthier local environment and urban attractiveness
Compact cities can reduce pollution from automobiles and preserve productive farmland and natural biodiversity
Proper housing can increase the quality of in-house environment and welfare of residents
Cleaner energy production can reduce pollution and environmental stress
Proper wastewater treatment and water distribution can reduce degradation of lakes and rivers
Solid waste management can reduce landfill and related pollution created by solid waste
Green manufacturing can reduce the amount of local air pollutants released
Source: Elaborated based on Matsumoto, T. and L. Daudey (2014)
Untapped green growth opportunities in Southeast Asian cities
In Southeast Asian cities, strong opportunities for urban green growth exist in six sectors: land use and transport, housing and buildings, energy, solid waste, water resource management; and green industries and services. Overall, land use and energy demonstrate the most important policy areas which can anchor other sectoral opportunities, although such opportunities have not been well explored. Table 2.1 presents the potential contribution of the six policy areas to green growth in fast-growing Asian cities. The potential contribution by policy area is presented against major objectives of urban green growth. Though the table is not exhaustive, it illustrates what is going to be achieved by urban green growth policies, with the local context of Southeast Asian cities taken into consideration.
Land use and energy mainly stand out as the policy areas
which can work as an anchor to leverage other policy sectors.
Sustainable land use offers consideration for the environment, transit-oriented development, security to residence, and provides flexibility to respond to future societal changes. Land use is therefore an area of increasing focus and importance that Southeast Asian cities can benefit from. In terms of energy, cities have many activities which can enhance energy efficiencies such as transport, buildings, wastes and industries, in addition to contributing to cleaner energy production. In this report, such energy efficiency gains and policies are discussed in their respective policy areas.
The opportunities in the six policy areas identified in this
section will not come about naturally; deliberate action is needed. The next two sessions will thus look at policy strategies and instruments to unleash the potential.

11
Policy assessments and recommendations by sector The following key strategies have been identified in order to promote green growth in cities :
Placing urban transport much higher on the agenda and integrating it with land use There is an urgent need for a long-term land- use vision and an effective mechanism to implement the vision in Southeast Asian cities, in which transport networks must be integrated (e.g. through transit-oriented development).
Addressing housing conditions and living environment Insufficient quantity or quality of housing supply can be a major obstacle to urban green growth. It also directly affects the vulnerability of urban dwellers: housing factors such as construction materials, access to safe drinking water and hygienic toilet facilities are the most critical determinants of human health in urban areas. Slum housing is easily destroyed by storms or flood, is usually energy inefficient and its activity greatly impacts the environment.
Promoting urban wastewater treatment Promoting urban wastewater treatment is pivotal to building sustainability and urban resilience. However, wastewater is often released in untreated form and pollutes rivers, groundwater and coastlines, and the main natural bodies of water used for drinking, bathing, fishing and swimming. To increase treatment capacity, appropriate financing policies and mechanisms should be developed for users to pay for the cost of wastewater treatment and policy complementarities with the energy sector should be explored.
Managing hazardous, medical and industrial wastes Promoting effective hazardous and medical waste collection has mostly been overlooked in the waste management stream although it is essential for ecological conservation, public health and safety.
Developing housing and buildings to meet green standards Building standards and energy regulations need to be developed so as to include green growth. In order to accelerate such actions, it will be important for national and subnational governments to review national building standards and discuss the various building codes which are implementable at a local level and sufficiently contribute to green growth.
Promoting cleaner energy and efficiency to meet rising demand Demand for energy in the case study cities has been escalating due to a burgeoning population and rapidly expanding economy driven by manufacturing industries.
This raises concerns about energy security as well as environmental sustainability. On the one hand, policies still need to address the lack of access to energy in slums and informal settlements in cities, and on the other hand, cities need to provide a more stable energy supply and to determine the appropriate price levels in conjunction with national governments.
Greening industries and services for effective resource management While industries are the backbone of the economy of the case study cities, they also pose environmental challenges, as they are the one of the major sources of CO2 emissions. Governments can use regulations and financial tools to encourage industries to be more resource and energy efficient, bringing benefits to the city as well as the business itself.
Enhancing skills for green buildings It is also crucial for city governments to strengthen local clusters by enhancing skills to respond to green building demand. With demand for green buildings increasing, cities can enhance skills of workers related to building design and construction to deliver on efficient green buildings.
Managing water resources to ensure sustained access The lack of abundant water resources in some cities is leading to situations of water stress and scarcity. Along with concerns about the quality of drinking water, cities also suffer from huge losses in the water distribution networks, intermittent supply, and misuse of water sources. In addition, the over-exploitation of groundwater resources has resulted in negative environmental impacts such as groundwater depletion, salination, pollution and land subsidence.
Transforming solid waste management by promoting the “3Rs” A fundamental problem for Southeast Asian cities is a lack of policies to reduce the increasing volume of urban waste. The “3Rs” (reduce, reuse and recycle) principle must be embedded into their municipal solid waste management strategies. Waste is a “valuable resource” and transforming waste management practices can be a driver of economic growth.
.
.

12
Prioritise policies which generate complementarity and synergies across sectors Maximising green growth outcomes requires policy complementarities at all scales of government. Cities are critical drivers of national growth and are as such better positioned to realise synergies and green growth aspirations. Urban policy makers are more likely to identify and combine complementary climate policies within and across sectors given the interconnectedness of urban policy sectors such as transport, land-use planning and economic development. Increasing the complementarity and coherence of policy packages across sectors and levels of government can help mitigate the trade-offs among environmental, growth and equity priorities.
Policy complementarity and synergies within the green growth sectors Policies that only focus on one element of the system or one sector are unlikely to be effective in enhancing overall performance of green growth. Various policy practices could achieve multiple objectives through comprehensive integration with other interconnected green growth areas of opportunity at the same time, thereby maximising outcomes.
Inclusiveness as a crucial element for urban green growth Inclusive growth is defined by the OECD (2015) as a new approach to economic growth that aims to improve living standards and share the benefits of increased prosperity more evenly across social groups. The adaptation of green growth as the policy framework to guide the development of Southeast Asian countries coincides with social disparities already prevalent in the case study cities. Brushing this situation under the carpet would only compound its severity and generate unintended consequences for vulnerable and poor groups in the implementation of green growth strategies. It is imperative to ensure that green growth fosters economic growth in a more inclusive manner.
Disaster risk management as a crucial element for urban green growth Green growth strategies contribute to building stronger
urban resilience against environmental and climatic risk which often leads to disaster. This plays an important role in systematically addressing uncertainties, mitigating the adverse effects of shocks, and empowering urban areas to adapt and immediately recover from disasters. The quality of the sustainable growth of Southeast Asian cities would be dependent on their ability to minimise disaster risk.
Developing demand-side policies Demand-side policies and the use of pricing mechanisms offer stronger potential to support green growth measures. Shifting tax burdens to encourage environmental performance or penalise negative environmental externalities would have high impact in Southeast Asian cities. Taxes, fees and charges, backed by adequate information on consequences of action can efficiently encourage consumers to behave in a more sustainable manner. For instance, progressive tariff structures and charges on groundwater extraction can help to optimise consumption.
Prioritising policies to ensure long-term growth Investing in infrastructure and promoting high educational attainments for long-term growth are critical for sustained long-term competitiveness and productivity gains. Cities are responsible for a momentous share of investments in both infrastructure and human resources. However, confronted by the challenge of managing extremely rapid urbanisation, fast-growing Southeast Asian cities tend to prioritise short-term economic benefits over long-term considerations which often do not lead to sustainable environmental outcomes.
Promoting the use of ICT in green growth policies Information and communication technology (ICT) access, skills and use are pivotal for achieving efficiency in environmental and economic performance. In essence, ICT is a corner stone to the green growth agenda, especially when analysed from the stand point of application in transport and land use, energy, housing and utilities.
Based on the policy assessment by sector in the previous section, this section will propose key strategies which can inform across the sectors and unleash the green growth opportunities. It focuses on managing trade-offs across policy areas to maximise policy complementarities and potential green growth in Southeast Asia.
Bangkok Iskandar Malaysia Cebu Bandung Hai Phong
Active mobility ** ** ** ** **
Renewable energy ** ** * ** **
Waste-to-energy/composting ** - * * - Transit-oriented development ** * * * - Eco-industrial parks - ** * * **
Wastewater treatment *** ** ** ** **
Table 2.2. Examples of cross-sectoral policies practised in case study cities
Level of practice: -absent *partial ** moderate ***fully practised
Cross-sector policy approaches

13
Policy areas Strengths observed in
Southeast Asia
Issues encountered in Southeast Asia
Recommendations
Land use and transport
– The needed urban institutions and legal frameworks are present in Southeast Asian cities
– Weak implementation of spatial plans and uncontrolled urban sprawl
– Low investments in public transport and high levels of private motor vehicle use
– Promote integrated land use and transport (transit-oriented development)
– Invest in quality and low-carbon infrastructure for long-term growth
- Improve existing public transport for integration into improved transport system– Promote mixed land-use development
Housing and buildings
– Increase in eco-friendly buildings and the rise in organisations supporting green certification and resource efficiency
– Housing backlog and low investment in social housing
– Localities should set green standards and promote green building codes
– Encourage building energy audit and labelling
– Promote retrofitting of old buildings to be resource efficient
– Provide support to improve housing conditions and energy efficiency, especially for low income households
– Develop the skills base to deliver on green buildings
Energy
– Regional and national efforts to decarbonise and increase renewable energy
– Falling prices of renewable energy
– rapid increase in energy consumption per capita
- not all households have access to energy
– Fossil fuel subsidies
- High reliance on fossil fuel for energy supply
- Low levels of renewable energies
– Promote research on the feasibility of different RE options
– Promote energy-efficient equipment and appliances
– Carbon pricing and removal of fuel subsidies
Water
– Increasing efforts to reduce non-revenue water
– Low tariffs
– Low coverage of standardised water supply infrastructure
– Low wastewater treatment rates
– High underground water exploitation
– Fragmentation of responsibilities
– Introduce fees for wastewater treatment and invest in treatment facilities
– Proper fee charging reflecting the scarcity value of water with social considerations.
– Build internal capacity to reduce non-revenue water
– Promote a comprehensive approach to water security (supply, sanitation, floods)
Solid waste management
– National laws and local ordinances on environmental sanitation
– Low user fees
– Low rates of recycling
– Need to enhance waste collection service
– Promote at source waste segregation by providing households with the needed disposal tools
– Generate energy from waste with emission control facilities
– Awareness campaigns
Green industries and services
– Strong recognition to green industries
– High greenhouse gas emissions
– Breach of regulations
– High pollution
– Lack of control over small industries and small and medium-sized enterprises
– Green procurement to encourage local production
– Development of skills and capacity required by the industry
– Frequent expert supervision and enforcement of standards
– Establish eco-industrial parks
– Intensify public awareness and education campaigns for green labelling
Table 2.3. Main policy assessments and recommendations
Source: Author.
An important message is the need to ensure
policy synergies across the areas of
opportunity to maximise the green growth
objectives for the benefit of different
stakeholders

14
Chapter 3
Governance levers to enable urban green
growth in Southeast Asia
Enhancing vertical policy co-ordination between local, regional and national governments
National governments in Southeast Asia are central decision makers and holders of authority in all green growth opportunity areas.
Decentralisation trends in the region since the 1990s, however, have progressively transferred some responsibilities to local governments. This has increased the need for vertical policy co-ordination, which is mostly exercised through national plans and strategies emanating from the national government to be translated at the local level.
In practice, however, due to lack of policy frameworks at both national and local levels and coordinating mechanisms in some sectors, such co-ordination is not always effective. National governments need to recognise the role cities can play in each green growth opportunity areas. Regulatory mechanisms should also be coupled with further outreach and capacity-building programmes encouraging a collaborative approach to green growth policy making.
The need for metropolitan green growth policies Many metropolitan areas in Southeast Asia are
characterised by a lack of formal and informal forms of horizontal collaboration between local governments and, therefore, a lack of metropolitan planning for green growth. Such co-ordination needs have been exacerbated by decentralisation processes and the relative withdrawal of national governments from local affairs.
Metropolitan forms of governance should be built with the mission to foster green growth. It is also critical that metropolitan forms of governance encourage the adoption or “mainstreaming” of metropolitan-wide development and green growth plans into the constituting local governments’ annual planning and budgeting cycle and are supported by national governments.
Opportunities to raise finance for urban green growth
Financing urban green growth is one of the main critical green growth implementation levers. Increases in revenues are observed in many Southeast Asian cities, mainly owing to significant increases in the share of own-source revenues following decentralisation reforms.
Nonetheless, such increases have not kept pace with the needs and new functions of local governments in Southeast Asia. Many urban governments still depend to a very large extent on fiscal transfers. In this regard, central governments could earmark special funds for green growth-related activities. Local governments, in parallel should improve the efficiency of tax collection and raise revenues from fees and charges.
Opportunities lie in green growth sectors, such as wastewater treatment fees. Conditions for private investment should also be enhanced, in particular public-private partnerships (PPP). National governments should design capacity-building and technical assistance programmes to help subnational governments design PPPs. The cost recovery in green growth sectors must also be raised to attract private investors.
Southeast Asian cities need to improve their capacities to produce and collect data on green growth
Achieving green growth is ambitious and the different profiles of cities implies different policy needs. A first step for cities in order to invest more efficiently and promote the green growth agenda at all levels of government is to build technical capacities to produce, collect and analyse data, and create results-based monitoring and evaluation systems, so as to identify their specific green growth challenges. The issue lies not only in the lack of resources and basic statistical information but also in some cases in the lack of technical skills in local governments. Local governments should build capacities to produce such data for metropolitan areas and make greater use of digital technologies to monitor their performance.
Mobilising local communities and research capacities to foster urban green growth
More emphasis should be placed on mobilising local stakeholders and external partners to foster urban green growth. In particular, the involvement of local communities can be an option to local governments facing under-capacity, in order to govern more efficiently, raise public awareness and tackle poverty. Building capacities to track progress towards green growth and to innovate (e.g. smart city) will also require more efficient involvement of local education and research capacities. Finally, outside the jurisdiction of cities, knowledge-sharing activities amongst cities, between cities and higher levels of government, and between cities and development partners can potentially bring high benefits, if developed as a long-term process.

15
Aspect of governance Strengths observed in
Southeast Asia
Issues encountered in Southeast Asia
Recommendations
Vertical co-ordination
– Decentralisation reforms since the 1990s have empowered cities (Indonesia, the Philippines and Thailand)
– Growing recognition of urban issues
– Lack of national policy framework in water, solid waste, smart cities and green growth
– Failures to translate national plans at the local level
– Failures to implement local plans
– Recognise the role of cities in national plans
– National governments should engage further in outreach and build capacities at the local level
Metropolitan governance
– Metropolitan governance initiatives have emerged in a few places (e.g. Iskandar Malaysia, Metro Cebu, Metro Manila, Greater Jakarta, Bandung Metropolitan Area)
– Overall too few metro governance initiatives despite increasing co-ordination needs due to decentralisation
– Lack of impact of existing metropolitan initiatives
– Little public awareness about the benefits of metropolitan governance
– Apply the OECD’s functional urban area methodology to find appropriate scale of action
– Build metropolitan forms of governance and plan for green growth
– Ensure support and involvement of the national government for vertical co-ordination
Financing
– Substantial (but still insufficient) growth in local own-sourced revenues – Increasing amounts of environmental-related official development finance (ODF) to cities (but not in proportion)
– Missed opportunities to raise local revenues (property taxes, fees and charges)
– Lack of financial support from national governments to develop urban infrastructure
– Lack of private investment in green growth opportunity areas
– Low amounts of environment-related ODF delivered to secondary cities
– Lack of effectiveness of ODF and poor integration in long-term plans
– Update property tax values
– Raise fees and charges in green growth opportunity areas (wastewater treatment, solid waste collection, etc.)
– Earmark national funds for urban green growth projects
– Develop strategies and regulations to facilitate public-private partnerships at the subnational level, in particular at the metropolitan level
– Ease regulations for cities’ direct access to ODF and create local investment funds
– Embed ODF in broader and long-term urban sustainability visions
Data collection
– Absence of many basic data
– Absence of centralised databases for green growth at the local level
– Lack of reliability of data
– Absence of metropolitan data and co-ordination between local governments
– Collect urban green growth indicators following Annex C
– Develop technical capacities and direct resources to collect data at the metropolitan level
– Make greater use of ICT
Stakeholder engagement
– Some cities have developed strategies to mobilise communities (e.g. Bangkok, Bandung, Surabaya, Liloan in Metro Cebu)
– Some cities possess valuable research and higher education resources (e.g. Iskandar Malaysia, Bandung)
– Overall local communities are not always recognised as strategic resources in cities and do not contribute to green growth objectives
– Lack of co-operation between local governments and universities and research institutes in green growth opportunity areas
– List and formalise local communities
– Develop community involvement strategies in the solid waste and urban resilience sectors
– Develop frameworks of co-operation (e.g. Memorandum of Understanding) with local universities and mobilise their resources and skills to collect data and design projects on urban green growth
Table 3.1. Main governance observations and recommendations in Southeast Asia
Source: Author.
The success of cities and national governments in achieving urban green growth in
Southeast Asia will largely depend on their capacity to address governance
obstacles. The benefits of green growth plans and policies in opportunity areas
can only be realised and maximised if the proper institutional setups, co-ordination, resources, skills and knowledge are in place.
SPATIAL DEFINITION OF THE STUDY:
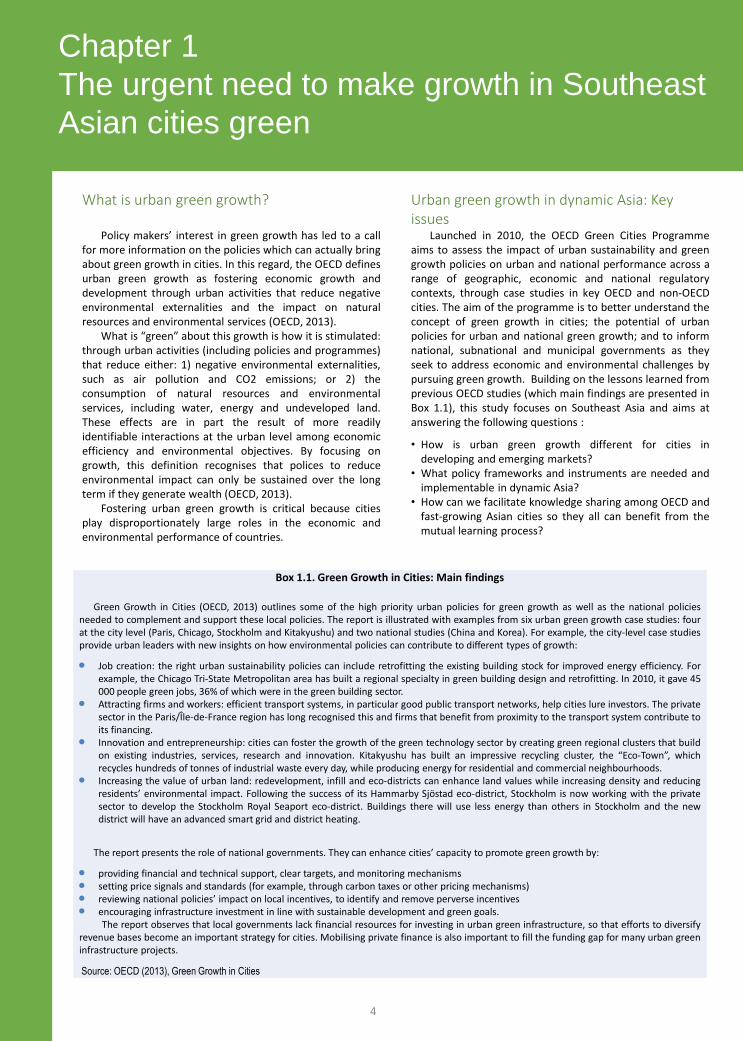
As a functional economy, defined by settlement patterns and human activity rather than by administrative frontiers, Bangkok extends far beyond the city of Bangkok (the capital city of Thailand) to the Bangkok Metropolitan Region (BMR) and beyond.
POLICY CONTEXT:
The BMR faces several challenges to its long-term growth including the lack of a highly qualified labour force to drive urban green growth and a rising Gini coefficient, with growing social inequality between the rich and poor. More than 2 million people live in urban slums, many of them without adequate housing, potable water, wastewater treatment, solid waste collection, and with poor access to public transport services to commute to work, school or other services.
The transport sector offers the most important opportunity for green growth. The number of privately owned vehicles has doubled over the past ten years. This has contributed to debilitating traffic congestion resulting in: lost productivity and reduced quality of life for residents and commuters; worsening air pollution with its attendant health problems; half of all Bangkok’s greenhouse gas emissions; and
high concentrations of particulate matter. The energy sector is the second most important area of opportunity that could facilitate a shift away from “brown” development toward a “green” growth model. This cross cutting lever also affects other sectors, such as transport and buildings. Electricity consumption has increased faster than population growth, especially in the residential and service sectors but improved energy efficiency in buildings and homes offers great promise. Energy production in Thailand still depends heavily on fossil fuels, accounting for 76% of final energy consumption in 2013 while renewable energy alternatives only accounted for 11%. Renewable energy sources are developing quickly in the country, and the BMR has considerable potential in the solar and waste to energy sectors.
The BMR is at high risk of floods in the rainy season which have caused great economic, social and environmental damage in the past. The metropolis is highly exposed to floods given its topography, location and sprawling urban development. At the same time, it is highly vulnerable to future flooding or other threats. Building greater resilience to such risks is critical to achieve green growth in the BMR. Wastewater and solid waste management also present serious challenges and opportunities. Only 46% of wastewater generated in the city of Bangkok is treated. Untreated water is discharged into ground, drainage systems, canals, rivers and even directly into the Gulf of Thailand.
Key statistics and Core green growth indicators for Bangkok
16
Item Data Unit Year
Land size 77 61.50 km²
Population 14.5 million 2010
% of national population 22 % 2010
GDP per capita 29 540 USD 2012
GDP growth rate 3.1 % 2005-12
Contribution to national GDP 44.20 % 2012
Unemployment rate 1 % 2015
GINI coefficient 0.451 2013
Population living in informal settlements, as a share of total urban population 14 % 2014
Urban dwellers living under the poverty threshold, as a percentage of total urban
population 1.06 % 2013
Air pollution (Annual average concentration of PM10) 50 µg/m3 2015
Transport modal share in commuting (cars, motorcycles, taxi, bus, metro, tram,
bicycle, pedestrian) 57 % 2011
Non-revenue water 26.76 % 2012
Percentage of residential and commercial wastewater that is treated according to
applicable national standards 45.8 % 2012
Case studies
Bangkok, Thailand

Areas Initiatives
General
Bangkok 2020 (2009), Bangkok 2032
BMA Action Plan on Global Warming Mitigation (2007-2012)
Master Plan on Climate Change (2013-2023)
Land use and transport
Bangkok Comprehensive Plan 2013
Mass transit network (BTS SkyTrain, MRT, Airport Rail Link)
Buildings Thailand Rating Energy and Environment System (TREES)
Waste
Solid waste separation programme at the community level (2010)
Composting at the community level (conducted in 42 out of 50 communities)
Supporting community projects such as the “Zero-Baht shop”
Waste-to-energy plant in the Nongkhem district (first of this kind)
Water Investment in wastewater treatment plants
“Metropole Watch” programme
Green industry
Thai Green Label Scheme (1994)
National Green Label Programme, including Label Number Five, a nation-wide energy efficiency
labelling system for electric appliances
Carbon Reduction Label / Carbon Footprint Label
Green public procurement
This contaminates the environment and poses serious public health risks, especially during disasters. Nearly 10 000 tonnes of municipal waste are collected every day in the city. As much as 89% of collected municipal solid waste is disposed of in sanitary landfills while recycling activities, which are undertaken at the community level and by the private sector, are still very limited.
MAJOR GREEN GROWTH INITIATIVES:
The BMR is making strides to decarbonise its transport sector. Its mass transit network now extends to a 25.3 kilometre elevated rail system (BTS SkyTrain), a 21-kilometre underground train network (MRT) and a 18.5-kilometre Airport Rail Link. Multiple extensions are planned and under construction on all three systems. The City of Bangkok recently announced plans to extend Pun-Pun, the city’s first bicycle-sharing programme, from 500 to 10 000 bicycles and to connect it to the BTS, MRT and Airport Rail Link stations. Nonetheless, Bangkok’s mass transit project fell short of its target listed in the BMA Action Plan on Global Warming Mitigation (2007-2012), reaching only 20% of projected CO2 reductions. This was due to a great extent to delays in the public transit investments.
With regards to buildings, Bangkok City has deployed and is using actively Floor Area Ratio and Open Space Ratio bonuses to encourage more efficient energy use in buildings. The City of Bangkok has also invested in the construction of a central system of wastewater collection and treatment since
the 1990s. As a result Bangkok recycles and treats about 46% of the water consumed in the city, one of the highest in the region. In the city of Bangkok, solid waste separation at the community level started in 2010, and composting at the community level is conducted in 42 out of 50 communities. The first waste-to-energy plant in the city of Bangkok has just started their operation in the Nongkhem district. It can incinerate 300 tonnes per day and generate 8 megawatts of electricity although the treatment capacity only accounts for about 3% of the total solid waste generated in the city. Thailand has an active green labelling programme. In the energy sector, the Label Number Five, a nation-wide energy efficiency labelling system for electric appliances is widely known and used for most major electrical appliances, such as air conditioners and refrigerators.
GOVERNANCE CONTEXT:
The absence of metropolitan governance for the BMR and therefore a lack of horizontal co-operation among its constituent provinces, is observed, particularly in land use and flood management. The City of Bangkok has ambitious climate change action plans but they do not include other provinces of the BMR. While the city publishes the Statistical Profile of BMA annually and has developed key performance indicators (KPIs), data is lacking at the BMR level to assess BMR’s green growth performance. Local finances at present are heavily dependent on transfers and grants from the national government, and own-source revenues are not sufficiently developed.
Major urban green growth initiatives in Bangkok
17
For more information, please see OECD (2015a), Green Growth in Bangkok, Thailand, OECD Publishing, Paris, http://dx.doi.org/10.1787/9789264237087-en.

SPATIAL DEFINITION OF THE STUDY: Iskandar Malaysia is located on the southern tip of the
Malay Peninsula along the Strait of Johor and in close proximity to the South China Sea and the Straits of Malacca. Roughly three times the size of Singapore, Iskandar Malaysia covers an area of 2 217 km² with 64 kilometres of coastline.
POLICY CONTEXT:
Iskandar Malaysia(IM)’s growth is supported by strong foreign direct investment (FDI). As of 2013, more than a third of the accumulated investment of USD 42 billion had been committed by foreign investors. Singapore in particular is a major source of FDI and an important partner in the region’s continued economic development. IM’s three ports (Tanjung Pelepas, Johor Bahru and Tanjung Langsat) are progressively expanding in size to handle increasing cargo volumes and ever-larger cargo ships. Economic growth and port activities have also resulted in the fast development of associated industrial activities, including other harbour and port facility services.
IM is endowed with natural assets of high conservation value. However its green growth prospects may be destabilised by soaring resource consumption. The urban areas have increased by 53.5% between 2000 and 2010, from around 271km² to 416km², to a large extent driven by the booming housing market in IM. Agricultural land has declined by half, and natural areas by 10% since 2005. The generation of municipal solid waste (MSW) in IM has grown to 2100 tonnes per day in 2015. Although almost three-quarters of Malaysia’s MSW generated is organic or paper, less than 10% is composted or recycled. There is great potential for IM to convert this waste
stream into a renewable energy resource through enhanced MSW management practices.
IM is rapidly becoming a car-dependent society. Air pollution and an expanding fleet of private motor vehicles characterise IM’s green growth challenges. Car-dependent infrastructure is not only difficult to adapt or circumvent in the future but it directly and powerfully ‘locks-in’ the future growth trajectory of the local community, the economy and environment.
MAJOR GREEN GROWTH INITIATIVES:
The Low Carbon Society Blueprint for Iskandar Malaysia 2025 (LCSBIM), launched in 2012, is one of the first comprehensive green growth strategies at a sub-national level in an ASEAN country. It aims to reduce Iskandar Malaysia’s carbon intensity by 58% by 2025 (over 2005 levels). It incorporates a comprehensive set of 12 actions across three major sectors with a total of 281 programme proposals.
Iskandar Malaysia’s growth is supported
by strong foreign direct investment.
Iskandar Malaysia is identified as one of
Malaysia’s key development areas by the
National Development Strategy.
Key statistics and Core green growth indicators for IM
Item Data Unit Year
Land size 2 217 km²
Population 1.9 million 2014
% of national population 6.4 % 2010
GDP per capita 20 940 USD
GDP growth rate 8.30 % 2005-2013
Contribution to national GDP 6.30 % 2013
Unemployment rate 2.8 % 2013
Urban dwellers living under the poverty threshold, as a percentage of total urban population
0.42 % 2011
Transport modal share in commuting (cars, motorcycles, taxi, bus, metro, tram, bicycle, pedestrian)
22 % 2015
Non-revenue water 24 % 2010
18
Case studies
Iskandar Malaysia, Malaysia

Major urban green growth initiatives in Iskandar Malaysia
Public transport is recognised as a key driver of economic growth as well as a critical means by which to reduce air pollution and GHG emissions in IM. The Transportation Blueprint 2010-2030 for IM aims to increase the public transport modal split from 15% to 50%; reduce the motorisation index down to 300 cars per 1,000 inhabitants; sustain greenhouse gas emissions at 2010 levels; ease congestion; and increase density from 20 inhabitants per acre to 60 inhabitants per acre. The first phase of a Bus Rapid Transit (BRT) system is expected to be ready by 2020. The BRT project is expected to cover about 90% of Iskandar after its three-phase deployment. A light rail transit system is also underway.
In 2014, IM achieved the recognition of being invited as one of the partnering cities for the Global Energy Efficiency Accelerator Platform (GEEAP), a flagship programme for the Sustainable Energy for All (SE4ALL) initiative. IM will use this platform to learn about the experiences of other international cities, compare that of their own, as well as develop further instruments to further improve energy efficiency.
As regards water, the city is embarking on the Segget River Restoration Project, a symbolic initiative that demonstrates IM’s commitment to clean its rivers and enhance the attractiveness of Johor Bahru’s urban centre. The river has long been buried under roadways and has been an obstacle to private investments, decreasing both the attractiveness of the area and the well-being of nearby residents due to its high level of pollution and the foul smell generated. Its renewal will also boost the local economy through the provision of some public urban
amenities alongside the river. The Green Economy Guidelines (GEG) manuals, published in 2014 by IRDA intend to urge the private sector to begin taking actions to ‘green’ their operations and facilities. They provide a checklist that businesses can adopt to address areas of procurement, operations and supply chain management in order to minimise their impact on the environment.
GOVERNANCE CONTEXT:
The Iskandar Regional Development Authority (IRDA) was established as a statutory body in 2007 and is the regional planning authority for the Iskandar Malaysia Economic Region. The IRDA is a joint State and Federal Government initiative to coordinate development and foster economic growth in this strategic region. IRDA has been critically contributing to the development of IM through the creation of Comprehensive Development Plans and Blueprints. Despite strong initiatives from the federal government, implementation at the sub-national governments has been a challenge. In addition, there is a lack of engaging citizens, civil society and the private sector in fostering urban green growth policies and activities.
Also, National policy strategies such as the 11th Malaysian Development Plan do not place much emphasis on the role of sub-national government agencies and wider stakeholders to foster green growth.
Areas Initiatives
General Comprehensive Development Plan ii 2014-25 (CDP-ii) Low Carbon Society Blueprint for Iskandar Malaysia 2025 (LCSBIM)
Land use and transport
Transportation Blueprint 2010-2030 for IM Bus Rapid Transit (BRT), light rail transit system
Energy Global Energy Efficiency Accelerator Platform (GEEAP) / Sustainable Energy for All (SE4ALL) Initiative
Building Malaysian Green Building Index
Water Segget River Restoration Project
Green industry Green Economy Guidelines (GEG) manuals
19
For more information, please see : OECD (2016c), Green Growth in Iskandar Malaysia, Malaysia, OECD Publishing, Paris, forthcoming.

SPATIAL DEFINITION OF THE STUDY:
Bandung is located in the central-west interior of the island of Java, about 140 kilometres south-east of the Indonesian capital, Jakarta. The Bandung Metropolitan Area covers a mountainous and elevated area of 3 488 km², and is the principal analytical unit of the report.
POLICY CONTEXT:
The BMA and particularly Bandung City have benefited from robust economic growth more rapidly than the Indonesian average and commensurate with that of other Indonesian metropolitan areas. The BMA’s economic growth is underpinned by a burgeoning tertiary sector and is supported by strong local demand for services, even though the manufacturing industry remains the largest employer. Bandung’s urban environment and high quality of life lie at the heart of its economic competitiveness relative to other large Indonesian cities such as Jakarta. However, inequality has risen sharply. This is demonstrated by a rising Gini co-efficient and overall numbers of people living in poverty, as well as enduring and high unemployment.
By and large, changing land-use patterns and a growing population have severely strained local infrastructure and the provision of basic urban services, such as transport, water management and municipal solid waste (MSW). The number of vehicles increased by more than 400% between 2004 and 2014 which has contributed to severe traffic congestion and high air pollution. Limited sanitation and poor water service coverage
have resulted in negative environmental externalities, such as decreasing groundwater levels, land subsidence and high levels of pollution in the local rivers that meet the city’s water needs. Less than half of the BMA’s households have access to piped water services. The volume of MSW produced has almost doubled to 56 909 cubic metres daily. Furthermore, the BMA faces several acute disaster risks, primarily related to flooding and seismic activity. Flooding, in particular, has been exacerbated partly due to the reduction of permeable surfaces for water infiltration in an increasingly built-up environment.
MAJOR GREEN GROWTH INITIATIVES:
Under its “Better Urban Mobility 2031” plan, Bandung City is working on plans to construct public transport infrastructure. The centrepiece of the vision is a new seven-line light rail transit (LRT) system. Bandung’s Blue Skies programme initiated by the Ministry of Forestry and the Environment promotes low-emission vehicles by awarding a certificate to cars that meet certain emission standards.
Bandung aims to become a model for
smart cities in Indonesia and the
developing world.
The intent is to use information
communication technology and
innovation to manage the city’s
development.
Key statistics and Core green growth indicators for BMA
Item Data Unit Year
Land size 3 392.27 km²
Population 8.5 million 2015
% of national population 3 %
GDP per capita 7490 USD 2012
GDP growth rate 6.6 % 2002-2012
Contribution to national GDP 3.10 % 2012
Unemployment rate 8.4 % 2014
GINI coefficient 0.4 2014
Population living in informal settlements, as a share of total urban population 5 %
Urban dwellers living under the poverty threshold, as a percentage of total urban population
8 % 2011
Non-revenue water 50 % 2014
20
Case studies
Bandung, Indonesia

Major urban green growth initiatives in Bandung
Bandung City has also announced that a green building certificate will be a requirement, not simply a recommendation (as it was previously), for obtaining a city building permit (Izin Mendirikan Bangunan, or IMB).
Although a new national target seeks to increase the share of renewable energy (RE) to 23% of the primary national energy mix by 2025, sub-national governments including Bandung do not appear to be actively working toward this target. Solar energy presents a highly promising and practical option. Nonetheless, encouraging feed-in-tariff mechanism could create relatively favourable market conditions.
On municipal solid waste, Bandung City’s Low-Carbon
City Plan includes a target to reduce the proportion of waste going to landfill from 69% to 25% between 2013 and 2018, and proposes two key measures to achieve this goal: promotion of the “3 Rs” and waste-to-energy schemes (Bandung City, 2014). Planning is under way to build a waste-to-energy incinerator in the BMA after a 2016 Presidential Decree (No. 18). Bandung City has also recently drawn up a plan to introduce bio-digesters to generate gas and fertiliser supported by the city of Kawasaki, Japan. A local community initiative Waste Bank
(Bank Sampah) also aims to collect non-organic waste (plastic, bottles, etc.) for recycling and organic waste for composting from households (Salim, 2013).
GOVERNANCE CONTEXT :
Indonesia’s decentralisation reforms since the late 1990s have empowered local governments but they still lack critical capacities and resources to undertake their assigned responsibilities. The national government directs development through plans and regulatory mechanisms but not sufficiently through capacity-building and outreach. In terms of finance, Bandung City’s budget has significantly increased over the past six years, in particular thanks to rising amounts of local own revenue. The budget, however, remains low compared to the rising investment needs for urban green growth. Its revenue from tariffs and fees is limited. However, there is an ambitious local strategy to rely on public-private partnerships (PPPs). Indonesia is the top recipient of Official Development Finance (ODF) in the whole Southeast Asian region but the benefits to Bandung’s green growth has been almost non-existent.
Areas Initiatives
General
BMA-wide master plan (by the West Java governor’s law) in 2015 including sectoral plans on water and solid waste
Bandung City’s medium-term development plan (2014-19)
Land use and transport
Green city master plan (25% of land for public space; 15% of land for green open space)
Urban farming
“Better Urban Mobility 2031” plan, including new seven-line light rail transit (LRT) system
Blue Sky programme (awarding a certificate to cars that meet certain emission standards)
Bike sharing, free school bus services, car sharing, car emissions testing
Increase of city’s parking tax
Water Revitalising the Citarum River Basin
Waste
Bandung City’s low-carbon city plan (target to reduce the proportion of waste going to landfill to 25% between 2013 and 2018; promoting 3Rs and waste-to energy)
waste-to-energy incinerator / Bio-digesters
Waste Bank (Bank Sampah)
Building and housing
Green building certificate (linked with a mandatory building permit)
Upgrading informal settlements
Energy
National Energy Policy (in 2014 regulation No. 79): a target for new and RE to contribute 23% to the national energy primary mix in 2025
National feed-in-tariff system, Energy Security Fund
Bandung City’s low-carbon society initiative (targeting 20% reduction in energy use)
Campaigns to encourage compact fluorescent lightbulbs (CFLs) / light-emitting diodes (LEDs)
Smart Cities Bandung Command Centre
21
For more information, please see : OECD (2016d), Green Growth in Bandung, Indonesia, OECD Publishing, Paris, http://dx.doi.org/10.1787/9789264264113-en.
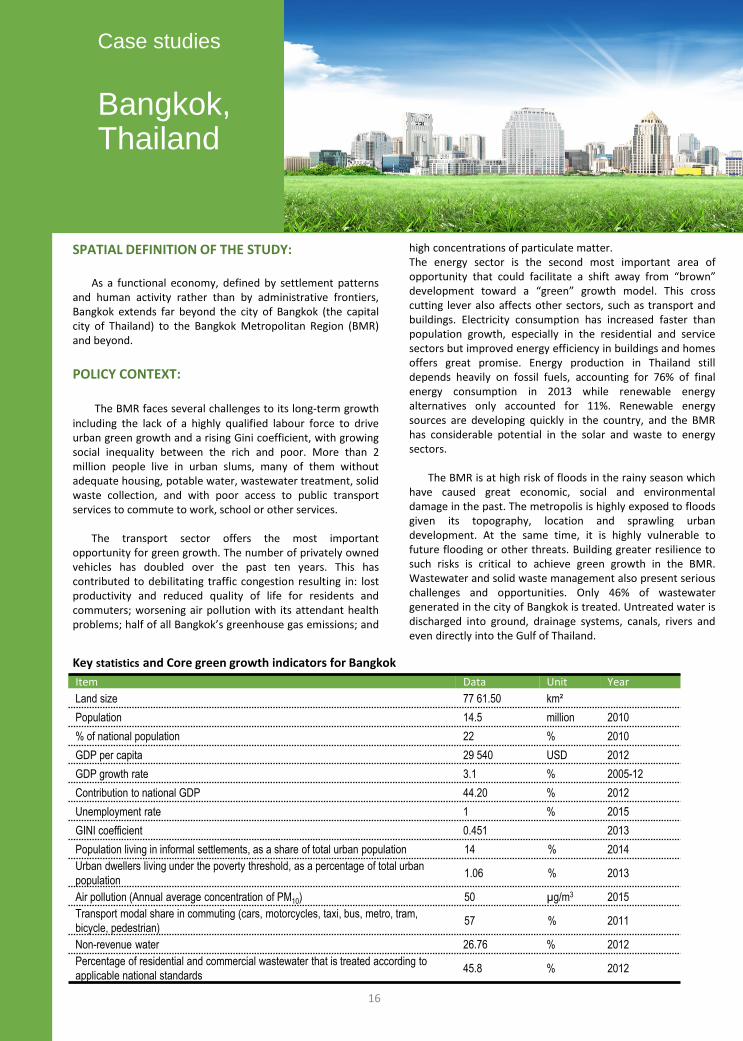
SPATIAL DEFINITION OF THE STUDY: With 1.96 million inhabitants and 1527 km², Hai Phong is
the third-largest urban area in Viet Nam. Hai Phong’s city government has the status of a province. The unit of analysis in this report is Hai Phong City.
POLICY CONTEXT:
Rapid urbanisation and economic growth have increased the need for sustainable management of resources. Electricity use is expected to increase almost threefold between 2013 and 2020. The increase in private motorised vehicles has resulted in severe congestion and transport-related deaths from PM10 emissions are expected to double between 2007 and 2020 if no action is taken. The availability of surface water is threatened by industrial plants and urban areas that discharge untreated wastewater into lakes and rivers. Hai Phong has no municipal wastewater treatment facilities at present. Poor surface water quality in the city poses serious environmental and public health hazards. Domestic waste generated in Hai Phong in 2025 is expected to be four times the level in 2000. Waste management is a first-order priority; industrial waste, in particular, will constitute 60% of total waste in 2025.
Hai Phong’s geographical location leaves the city exposed to natural hazards such as storms and typhoons. Climate change is further increasing risks of natural disasters, in particular coastal flooding. A WHO analysis conducted in Viet Nam shows that climate change is likely to expose the city
to a high degree of health hazards.
The Port of Hai Phong is the largest seaport in northern Viet Nam, and the second-largest in the country after the port of Ho Chi Minh City. It plays a critical role in the local and regional economy. The dramatic increase in cargo in recent years – from 7.7 million tonnes in 2002 to 41.4 million tonnes in 2014 – has contributed to the city’s growth. It has also generated environmental and disaster risks that could significantly undermine the entire city’s economic and environmental performance if they are not urgently addressed.
Maritime and inland cargo traffic result in the emission of pollutants such as CO, SO2, NOx, particulate matter and also dust. Levels of PM10 in Hoang Dieu, Chua Ve and Tan Vu terminals are on average 142 µg/m3, 136 µg/m3 and 141 µg/m3, respectively. In addition, an estimated 3 000 to 5 000 tonnes of waste oil spilled during regular bunkering operations are generated in the port annually, only 20% to 30% of which is collected. Furthermore, several studies have reported significant loss of biodiversity due to low seawater quality and sedimentation, and the handling of contaminated masses during dredging activities present further environmental risks. This is of great concern, as Hai Phong is located in an estuary with valuable and sensitive ecosystems of mangrove forests, coral reefs, seagrass, and aquaculture.
Key statistics and Core green growth indicators for Hai Phong
Item Data Unit Year
Land size 1 527 km²
Population 1.96 million 2015
% of national population 2 % 2015
GDP per capita 3 940 USD 2015
GDP growth rate 6.6 % 2010-2015
Unemployment rate 3.89 % 2015
GINI coefficient 0.353 2015
Urban dwellers living under the poverty threshold, as a percentage of total urban population
1.53 % 2015
Non-revenue water 13.7 % 2013
22
Case studies
Hai Phong, Viet Nam

Major urban green growth initiatives in Hai Phong
MAJOR GREEN GROWTH INITIATIVES:
The Hai Phong Green Growth Strategy Action Plan was adopted in 2014, based on the National Green Growth Strategy and the National Action Plan on Green Growth for the period 2014-20. This action plan aims to green urban areas; green industry; green the environment; and transform Hai Phong into a “green port city” by taking advantage of the historical port city whilst setting up a modern, competitive and eco-friendly green port system. In 2015, the city also produced the Green Growth Promotion Plan to identify possible projects to implement the Action Plan.
A priority for Hai Phong and for Viet Nam is to increase energy efficiency in manufacturing. The central government has standards, targets and a programme (Master Plan 7). At the city level, the Hai Phong Green Growth Strategy for Industry in 2020 (with the target for 2030) formulates a vision for modernising industry and encourages energy-effective production. The city is already supporting firms in energy auditing and has provided consulting solutions to save energy.
Hai Phong has been exploring renewable energy options.
To increase the proportion of its energy sourced from sustainable sources, use of biomass electricity is expected to rise from 0.6% in 2020 to 1.1% in 2030. In addition, the city is promoting solar water heaters and providing financial support to citizens purchasing new solar-energy appliances. The city is also implementing pilot projects using solar batteries for public lighting and traffic lights.
With the increasing demand for water, Hai Phong
continues to invest in water treatment plants and distribution systems to ensure stable water supply from local water resources. For wastewater, the city is now
constructing the first large-scale wastewater treatment plant with a daily capacity of 36 000 cubic metres.
With regards to municipal solid waste, the priority for
Hai Phong is to separate recyclable materials at source. Currently, even though several composting facilities at landfill sites have been experimented with, many non-compostable materials are mixed in, which makes it difficult to produce good-quality compost (for use as fertiliser) despite the fact that a high proportion of waste generated is organic.
GOVERNANCE CONTEXT :
Hai Phong’s green growth will depend to a large extent on the effectiveness of its governance structure. In Viet Nam, the national government holds a key role in providing suitable legal and policy frameworks and support for investments to ensure that Hai Phong achieves its green growth goals. The central government in this regard has been actively promoting green growth, recognising the role cities can play. Green growth also requires cross-sectoral planning to tackle issues comprehensively. Close co-ordination between the Port Authority and Hai Phong’s city government is critical for achieving green growth targets and better public investment in the particular context of this city. However, port activities are not covered in depth in the Hai Phong Green Growth Promotion Plan, despite the vision of this strategic document to transform the city into a “green port city”. Hai Phong’s green growth action plan may also be constrained by the lack of financial resources, although own-source revenues have soared in recent years, thanks to rising customs revenues. The use of charges and fees, which can foster green growth, is extremely limited (accounting for only 0.5% of Hai Phong’s total budget in 2013). Strategies to involve the private sector, such as PPPs, are also under-developed.
Areas Initiatives
General Green Growth Strategy Action Plan (2014) / Green Growth Promotion Plan (2015) Hai Phong Socio-Economic Development Master Plan
Port Hai Phong Port Master Plan
Waste Master plan of medical waste treatment for the period of 2011-15, with orientations towards 2020
Buildings Viet Nam Clean Energy Program: Program: Energy Efficiency Promotion in the Building Sector”
(four-year pilot programme supported by USAID)
Land use and Transport
National urban master plan / Hai Phong’s city master plan
Pilot projects using solar batteries for public lighting and traffic lights
Water Water supply system expansion investment (additional daily capacity of 175 000 cubic metres) Wastewater treatment plant in Vinh Niem Ward, Le Chan district (the first large-scale plant with a
daily capacity of 36 000 cubic metres)
Green industry Green Growth Strategy for Industry in 2020 (with the target for 2030) 11 vocational colleges, 10 vocational high schools and 24 job centres in Hai Phong
Energy financial support to citizens purchasing new solar-energy appliances
23
For more information, please see OECD (2016a), Green Growth in Hai Phong, Viet Nam, OECD Publishing, Paris,
http://dx.doi.org/10.1787/9789264260207-en.

SPATIAL DEFINITION OF THE STUDY:
The Metropolitan Area of Cebu (Metro Cebu) is located on the central-eastern flank of Cebu Island and covers an area of 1 163 m². The City of Cebu lies at the centre of this metropolitan area and is the capital of the Province of Cebu, which is largely focused on the Island of Cebu, and covers an area of 4 944 km².
POLICY CONTEXT:
Cebu has achieved remarkable economic growth that is faster than the national average and stronger than Metro Manila. Changing land-use patterns and a growing population have severely strained local infrastructure and the provision of basic urban services, such as transport, energy, water management and municipal solid waste (MSW). Vehicle numbers almost doubled between 2003 and 2010, contributing to deteriorating traffic congestion and high air pollution levels. Limited sanitation and water service coverage is leading to negative environmental externalities, such as pollution and high groundwater salinity which are placing great stress on the metropolitan area. Less than half of Metro Cebu’s households have access to piped water services. The volume of MSW produced daily has rapidly increased.
Water security is a cornerstone of urban green growth strategies in Cebu. The Province of Cebu, and in particular the Metro Cebu area, face great water challenges, including increasing water demand in a context of diminishing resources, relative inefficiency of the water distribution network, and suboptimal coverage of the water supply and sanitation infrastructure, leading to quality issues in surface and ground water. Projected total water demand in the Metro Cebu area is expected to almost triple by 2040; 25% of water is lost before reaching consumers; only 49.9% of water used for other purposes than drinking is supplied through pipe connections;
and 80% of grey water receives no treatment.
Metro Cebu is exposed to acute disaster risks. It regularly experiences flooding, especially during the wet season from June to November and annual tropical storms. In 2013, Cebu City experienced a magnitude 7.2 earthquake which affected 870 000 people and damaged nearly 1 000 houses, local infrastructure and community facilities.
MAJOR GREEN GROWTH INITIATIVES:
The Metro Cebu Development and Coordinating Board (MCDCB) is responsible for metro wide planning and development. The harmonisation of the land use plans of the 13 LGUs falls within its mandate. In 2012, the MCDCB, supported by the Japanese International Cooperation Agency, initiated a project which includes the ‘Metro Cebu Vision 2050’ and ‘Roadmap Study for Sustainable Urban Development’. The primary focus of the initiative has been the production of a blueprint to guide the city’s sustainable economic development. Land use is also a critical pillar and it is expected that the Vision is interpreted into the official Comprehensive Land Use Plans (CLUPs) in each of Metro Cebu’s 13 LGUs and subsequently into their zoning ordinances. Revitalising Cebu’s downtown area by making more land available for development and improving connectivity will be essential to Metro Cebu’s economy. The green loop and Colon Revitalisation Project are vital for the transformation of the city. The focus of the green loop on a pedestrian- dominated and transit-oriented corridor across the four cities of Cebu, Mandaue, Lapu-Lapu and Cordova is a laudable step towards achieving green growth objectives. One of the first large public investments in ‘green’ infrastructure in Cebu will be the Cebu Bus Rapid Transit (BRT) project, which is currently under construction. This is in line with Mega Cebu Vision 2050 which hopes to ensure accessible and efficient movement through an integrated and sustainable system.
Key statistics and Core green growth indicators for Metro Cebu
Item Data Unit Year
Land size 1 163 km²
Population 2.8 million
% of national population 3 % 2015
GDP per capita 5 084 USD 2012
Unemployment rate 35 %
Urban dwellers living under the poverty threshold, as a percentage of total urban population
1.53 %
Non-revenue water 25 % 2013
24
Case studies
Cebu, Philippines

Major urban green growth initiatives in Cebu
Revitalising Cebu’s downtown area
by making more land available for
development and improving
connectivity will be essential to
Metro Cebu’s economy.
The Cebu-Cordova bridge, a third bridge to link the southern section of Mactan with Cebu City is planned to relieve the traffic congestion on the two existing bridges whilst providing connectivity for traffic from the south of Metro Cebu.
In addressing the solid waste management challenges, Cebu promotes the “No segregation, No collection” policy that requires residents in Metro Cebu to segregate their household waste in conformity with international practice. Every Baranguay should have a Materials Recovery Facility (MRF) for final sorting, segregation composting and recycling. Yet, as in 2011, out of 349 barangays only 101 (29%) had operational MRFs. Innovative practices are being piloted in various LGUs for waste management such as vermicomposting and biogas digesting.
In terms of greening industry, the Promotion of the Green Economic Development (ProGED) project started in 2013. It is a joint initiative of the Department of Trade and Industry’s Regional Operations Group and the GIZ and aims to improve the competiveness of micro, small and medium enterprises (MSMEs) to enable the adoption of climate-smart and environmentally- friendly approaches in their value chain. Some economic zones in Metro Cebu such as the Cebu Business Park (CBP) have shown a greater green potential through their solid waste
management practices, green gas emission management and lighting system.
GOVERNANCE CONTEXT:
In the Philippines, as in other Southeast Asian countries, significant gaps are observed between national policy objectives and concrete actions taken by subnational governments on the ground. Despite decentralisation reforms, there is a capacity constraint at the subnational level, an over-reliance on regulatory approaches rather than outreach, collaboration and capacity building between the national and local governments. In terms of metropolitan governance, the Metro Cebu Development and Coordinating Board (MCDCB) is a promising initiative, a consortium of the 13 LGUs of Metro Cebu, regional line agencies of the national government, private sector representatives and civil society organisations. It is expected to be converted into the Mega Cebu Development Authority (MCDA).
Strategies to unlock and co-ordinate finance for urban green growth will also be critical. There are high discrepancies in the degree of autonomy of LGUs constituting Metro Cebu, and, generally speaking, tariffs and user charges are not sufficiently collected (6% of total revenues of Cebu’s LGUs on average). In addition, Cebu’s LGUs remain very much dependent on national government’s transfers but there is no public investment framework for green growth. Finally, similarly to Bandung, very low amounts of ODF have been committed to support green growth objectives in Cebu since 2002, while Manila has devoted around 69% of total environment-related ODF to cities.
Areas Initiatives
General Metro Cebu Vision 2050 / Roadmap Study for Sustainable Urban Development in Metro Cebu
Land use and transport
Cebu Bus Rapid Transit (BRT) The green loop and colon revitalization project Cebu-Cordova bridge
Water Improving and developing infrastructure (i.e. dams, reservoirs) and diversify sources of water
supply in the long-term (proposed in the Roadmap Study)
Waste
The 2000 Ecological Solid Waste management Act / “No separation, No collection” policy / Materials Recovery Facilities (MRFs) for final sorting, segregation composting and recycling at the Baranguay level
Vermicomposting (Kwarta sa Basura Project) and biogas digesting
Green industry Promotion of Green Economic Development Project (ProGED) Cebu Business Park
25
For more information, please see : OECD (2016e), Green Growth in Cebu, Philippines, OECD Publishing, Paris, forthcoming.

26
Type of activity and title Date Location
Consultation workshop Urban Green Growth in Dynamic Asia
May 2013 Stockholm, Sweden
Consultation workshop The conceptual framework on Urban Green Growth in Dynamic Asia
February 2014 Bangkok, Thailand
Consultation workshop The conceptual framework on Urban Green Growth in Dynamic Asia
March 2014 Jakarta, Indonesia
International conference Policy Forum on Urban Green Growth in Dynamic Asia from Concept to Implementation
June 2014 Paris, France
1st peer learning workshop Urban Green Growth and Climate Change Resilience in Bangkok
August 2014 Bangkok, Thailand
International conference Japan-OECD Policy Forum on Urban Development and Green Growth
October 2014 Tokyo, Japan
2nd peer learning workshop Spatial development strategies in Iskandar Malaysia: how to plan, manage and maintain local assets under rapid urbanisation?
November 2014 Iskandar Malaysia, Malaysia
3rd peer learning workshop Smart Cities and Green Growth
May 2015 Bandung, Indonesia
4th peer learning workshop Green Growth in Port Cities
June 2015 Hai Phong, Viet Nam
International conference Asia-Pacific Urban Forum (APUF 6)
October 2015 Jakarta, Indonesia
5th peer learning workshop Creating a Sustainable and Resilient Cebu: Land use, Water and Metropolitan Governance in the Context of Rapid Urbanisation
December 2015 Cebu, Philippines
International conference Green Growth and Sustainable Urban Development (COP21 side event)
December 2015 Paris, France
International conference Green Growth and Sustainable Development Forum (OECD)
November 2016 Paris, France
Table B.1. OECD Knowledge Sharing Workshops and Policy Forums (2013-16)
Source: Authors.
The Knowledge Sharing Platform on Urban Green Growth in Dynamic Asia
Why knowledge sharing?
Knowledge sharing can bring benefits to all the stakeholders through peer learning on an equal footing. Asian cities and national governments, in particular, could mutually learn from different practices, and therefore better address the urgent need to develop urban green growth policies and to implement them. Hearing from other local experiences on successful policy initiatives could provide cities with useful knowledge to take concrete action. In addition, institutions for development co-operation could support cities and countries in dynamic Asia more effectively by sharing their accumulated knowledge and tailoring their own activities to local specific needs. Knowledge sharing would therefore help to create synergies by assembling fragmented knowledge, and provide new inspiration to pursue and achieve urban green growth.
The Knowledge Sharing Platform on Urban Green Growth in Dynamic Asia
In 2013-14, several knowledge-sharing activities and
events were conducted under the framework of the project Urban Green Growth in Dynamic Asia with the support of the OECD Knowledge Sharing Alliance. Throughout these pilot activities, it was confirmed that knowledge sharing is particularly useful to ensure the coherence of different urban green growth initiatives among different actors and to share best practices among cities with similar challenges. The common consensus will further explore effective options for knowledge sharing on urban green growth.

27
Sector # Indicator Unit
Soci
al
1 Population living in informal settlements, as a share of
total urban population %
2 Gini coefficient
3 Average PISA score in mathematics, reading and
science
Eco
no
mic
4
Urban dwellers living under the poverty threshold
(USD 1.90 a day), as a percentage of total urban
population
%
5 Informal employment as a percentage of total
employment %
6
Contribution of the local economy to the
environmental goods and services sector:1
–Employment, as a share of total employment
–Gross value added, as a share of total GDP output
%
%
Ge
ner
al e
nvi
ron
men
t
7
Air pollution
– Annual average concentration of PM2.5
– Annual average concentration of PM10
µg/m3
µg/m3
8 Annual CO2 emissions per capita tonne/year/c
apita
9 Biochemical oxygen demand (BOD) in rivers and lakes mg/L
10 Open green space area ratio per 100 000 inhabitant Hectares
11 Mangrove forest preservation, as a share of mangrove
forest increase from previous year %
12 Estimated economic damage from natural disasters
(floods, droughts, earthquakes, etc.) as a share of GDP %
Lan
d-u
se
13 Population density on urban land residents/km
²
14 Sprawl Index %
15 Share of multi-family houses in total housing units %
Tran
spo
rt
16
Transport modal share in commuting (cars,
motorcycles, taxi, bus, metro, tram, bicycle,
pedestrian)
%
17 Average age of car fleet (total and by type) Years
18 Motorisation rate
number of
vehicles per
capita
19 Average travel speed on primary thoroughfares during
peak hour km/h
Sector # Indicator Unit
Ener
gy
20 Electricity consumption in households, per capita toe/dwelling
21 Average number of electrical interruptions per
year, per customer
22 Heavy metals emission intensity of manufacturing
industries
kg released per
million USD GVA
23
Proportion of total energy derived from RES as a
share of total city energy consumption (links to EU
target)
%
24
Average share of population undergoing prolonged
power outage in case of natural disaster over the
past five years
%
Wat
er a
nd
san
itat
ion
25 Percentage of water samples in a year that comply
with national potable water quality standards %
26 Total water consumption per capita L/day/capita
27 Non-revenue water %
28 Annual average of daily number of hours of
continuous water supply per household %
29
Percentage of residential and commercial
wastewater that is treated according to applicable
national standards
%
30 Percentage of dwellings damaged by the most
intense flooding in the last ten years %
Solid
was
te
31 Total solid waste generation per capita kg/year/capita
32 Share of the population with weekly municipal solid
waste collection %
33 Proportion of municipal solid waste that is sorted
and recycled %
34 Remaining life of current landfill(s) Years
Envi
ron
me
nta
l an
d
reso
urc
e p
rod
uct
ivit
y
35 GDP per unit of energy-related CO2 emitted USD per Mt CO2
36 Real income per unit of energy-related CO2 emitted USD per Mt CO2
37 GDP per unit of TPES GDP/TPES
Po
licy
resp
on
ses
(exa
mp
les)
38 Share of taxes, fees and charges in green growth
opportunity areas, in total local revenues %
39 International finance flows of importance to green
growth , as a share of total flow in each category %
Urban green growth indicators for Southeast Asia
The report proposes a set of green growth indicators. They are inspired by two existing sets of green growth indicators developed by the OECD (Green Growth in Cities (OECD, 2013) and Green Growth Indicators 2014 (OECD, 2014)) but are adapted to fit the context of Southeast Asian cities. They contain 39 indicators in total. The list provided does not exclude local and national governments to go more in depth in each sector and expand some sections on their own. Out of the 39 indicators, 12 are marked as core indicators and 27 are complementary indicators. The 39 indicators are grouped into 10 categories: social, economic, general environment, opportunity areas for green growth (land use, transport, energy, water and sanitation, solid waste); environmental and resource productivity; and policy responses.

For more information: www.oecd.org/greencities www.oecd.org/governance/regional-policy/knowledge-sharing-for-urban-green-growth-in-dynamic-asia.htm
Contact Tadashi MATSUMOTO, Ph.D Project Manager, Urban Green Growth / Knowledge Sharing Regional Development Policy, Public Governance and Territorial Development Directorate
Directorate for Public Governance and Territorial Development
References
@OECDgov
Matsumoto, T. and L. Daudey (2014), "Urban Green Growth in Dynamic Asia: A Conceptual Framework", OECD Regional Development Working Papers, No. 2014/12, OECD Publishing, Paris, http://dx.doi.org/10.1787/5js7svlw8m0x-en.
OECD (2013), Green Growth in Cities, OECD Publishing, Paris, http://dx.doi.org/10.1787/9789264195325-en.
OECD (2014), Green Growth Indicators 2014, OECD Publishing, Paris., http://dx.doi.org/10.1787/9789264202030-en
OECD (2015), All on Board: Making Inclusive Growth Happen, OECD Publishing, Paris, http://dx.doi.org/10.1787/9789264218512 -en.
OECD (2017a, forthcoming),Green Growth in Cebu, Philippines.
OECD (2017b, forthcoming), Green Growth in Iskandar Malaysia, Malaysia.
OECD (2016a), Green Growth in Bandung, Indonesia, OECD Publishing, Paris, http://dx.doi.org/10.1787/9789264264113-en.
OECD (2016b), Green Growth in Hai Phong, Viet Nam, OECD Publishing, Paris, http://dx.doi.org/10.1787/9789264260207-en.
OECD (2015), Green Growth in Bangkok, Thailand, OECD Publishing, Paris, http://dx.doi.org/10.1787/9789264237087-en.
Salim, R. (2013), Waste Not, Want Not: “Waste Banks” in Indonesia, available at: http://blogs.worldbank.org/eastasiapacific/w aste-not-want-not-waste-banks-indonesia
UN DESA (2014), World Urbanisation Prospects: The 2014 Revision, https://esa.un.org/unpd/wup/Publications/Files/WUP2014 -Report.pdf.
World Bank (2016), “Container port traffic (TEU: 20 foot equivalent units)”, World Development Indicators, http://data.worldbank.org/indicator/IS.SHP.GOOD.TU/countries.