Embed Size (px)
Citation preview

The Path to Customer-Centric Service A Candid Survey of Federal Managers
June 2015
Underwritten by:
Purpose After a series of events that arguably damaged the reputation of the federal government’s customer service programs, in 2015 the Obama Administration announced its intention to overhaul public services to make them more customer-centric. Customer service factors heavily in the Digital Services Playbook, while the Office of Management and Budget (OMB) has designated it a Cross-Agency Priority Goal, focusing on streamlining transactions, developing standards for high-impact services, and using technology to improve the customer experience.i
However, leading consumer studies and public opinion surveys have found that there is still much to be desired from federal customer service. According to the American Customer Satisfaction Index (ACSI), for instance, federal customer service continues to lag behind the private sector standard.ii Further, there is disagreement as to whether the challenges are primarily cultural or technological.
To better understand customer service from the perspective of the federal workforce, evaluate the drivers and challenges to reform, and shed light on improvements currently underway, Government Business Council (GBC) and Deloitte conducted a survey of federal managers.
2
Methodology GBC deployed a survey to a sample of Government Executive, Nextgov, Defense One, and Route 50 print and online subscribers on May 12, 2015. The pool of 410 respondents includes employees at the GS/GM 11-15 grade levels and members of the Senior Executive Service (SES). Respondents include representatives from at least 31 federal and defense agencies.
i. Office of Management and Budget, “Cross-Agency Priority Goals: Customer Service” http://www.performance.gov/node/3400/view?view=public#overview; ii. American Customer Satisfaction Index, “Federal Government Report 2014” http://www.theacsi.org/news-and-resources/customer-satisfaction-reports/reports-2014/acsi-federal-government-report-2014

Table of Contents
1 Executive Summary 4
2 Respondent Profile 6
3 Research Findings 14 i. The State of Federal Customer Experience 15 ii. Drivers and Obstacles 21 iii. Reforms Currently Underway 28
4 Final Considerations 34
3

4
1 Executive Summary
Executive Summary Perceptions of customer service quality differ between federal managers and the general public 65 percent of federal managers indicate that their organization goes above and beyond to deliver a customer experience tailored to users’ unique needs, and 67 percent say their organization’s service is on par with that from the private sector. However, according to leading consumer surveys, satisfaction with government services is at an eight-year low and the federal government ranks near the bottom in a cross-industry comparison.
The motivation to improve customer service, as well as the obstacles, vary depending on agency mission and constituency
Respondents who report that their agency’s core mission is regulation and enforcement perceive compliance with federal mandates as the leading driver of customer service improvements. Alternatively, those whose organizations are primarily focused on providing public services cite the need to improve engagement with citizens and customer satisfaction. Overall, respondents report that the obstacles to meaningful reform are budgetary, technological, and cultural. Public service-focused respondents, however, are more likely to cite outdated technologies, cultural resistance to change, poor training, and a lack of interagency collaboration as challenges.
Many agencies have yet to take key steps necessary to improve service Less than one-quarter of respondents say their organization uses analytics to define customer segments, integrates data with data collected by other agencies, uses a customer relationship management (CRM) system, or aligns incentives with attention to customer-centric service. Further, less than half believe that their organization does a good job soliciting feedback from customers and only 42 percent say their organization uses quantitative metrics to track performance toward customer service goals.
5
6
2 Respondent Profile

15%
10%
19%
24%
15%
13%
4%
Other
GS/GM-11
GS/GM-12
GS/GM-13
GS/GM-14
GS/GM-15
SES
The sample is comprised largely of senior officials in management roles
7
Job Grade Reports/Oversees
75% of respondents are GS/GM-12,
or military equivalent, and
above
Percentage of respondents, n=410
55%
17%
15%
6%
4%
3%
None
1-5
6-20
21-50
51-200
Over 200
45% of respondents oversee at least
one report

The sample includes respondents from a diverse array of job functions
8
20%
3%
4%
4%
6%
7%
7%
7%
11%
12%
19%
Other
Facilities management
Healthcare
Auditing
Agency leadership
Finance
Human capital
Technical/scientific
Acquisition and procurement
Administrative
Program/project management
Job Function
“Other” includes law enforcement,
information technology, communications, and
legal
Percentage of respondents, n=410

Most frequently represented agencies
Department of Agriculture Department of the Army Department of Defense Department of the Treasury Department of Veterans Affairs Department of the Navy Department of the Air Force Social Security Administration Department of Health and Human Services Department of Homeland Security General Services Administration Department of Transportation Department of Commerce Environmental Protection Agency Department of the Interior
Department of Energy Department of Housing and Urban Development Department of Justice National Aeronautics and Space Administration Department of Education Department of Labor Department of State Office of the Joint Chiefs of Staff United States Marine Corps Office of Personnel Management Small Business Administration U.S. Agency for International Development Executive Office of the President National Science Foundation Other agencies
9
Agencies listed in order of frequency. Not all participating agencies listed.

Respondents are affiliated with diverse core missions that shape the services they provide
10
Percentage of respondents, n=410
In general, how would you characterize the core mission of your specific bureau/sub-agency?
Public service provider (i.e., delivering transactional services like healthcare and social services on behalf of
the federal government)
39%
Knowledge creation (i.e., conducting or sponsoring research and/or disseminating
information)
Regulation and enforcement
(i.e., developing policy and/or enforcing legal
rules)
25%
9%
Don’t know
3% Other 24%

Respondents describe their organization’s core mission in their own words
11
Respondents who selected “Other” were asked to describe their bureau’s mission in their own words. Words used most frequently appear largest.
In general, how would you characterize the core mission of your specific bureau/sub-agency?

Respondents’ “customers” vary depending on their organization’s core mission
12
46%
59%
36%
22%
13%
38%
29% 27% 22%
Aggregate sample Public service providers Regulators
Individuals/members of the public Businesses/private organizations Other public sector entities
In general, whom does your bureau/sub-agency consider its primary “customers”?
Percentage of respondents, aggregate n=406, public service providers n=159, regulators n=100

Customer service initiatives must consider the differing agency missions and customer groups
13
Individuals/Members of the public
Businesses/Private Organizations
Other public sector entities
Public service
• Veterans Health Administration provides health services for veterans
• U.S. Postal Service delivers mail
• DLA evaluates and awards contracts to suppliers of materiel and equipment
• BLM awards permits for cattle grazing on public land
• Federal shared services (e.g., for HR, IT, financial management functions, etc.)
Knowledge creation
• Launch of a new space telescope by NASA
• Discovery of a new cancer drug through NIH-funded research
• US-CERT disseminates list of latest cyber threats to critical infrastructure providers
• OMB circulates best practices to help agencies improve customer service
• Research by GAO and CRS
Regulation and
enforcement
• TSA conducts airport safety screenings
• IRS issues penalties for tax code violations
• SEC requires financial institutions to implement new reporting requirements
• EPA enforces clean air regulations on firms
• CMS supervises states’ expansion of Medicaid benefits
• Treasury Dept. oversees implementation of open spending data initiatives
Major Customer Groups
Cor
e Ag
ency
Mis
sion
s
14
3 Research Findings

15
i. The State of Federal Customer Experience
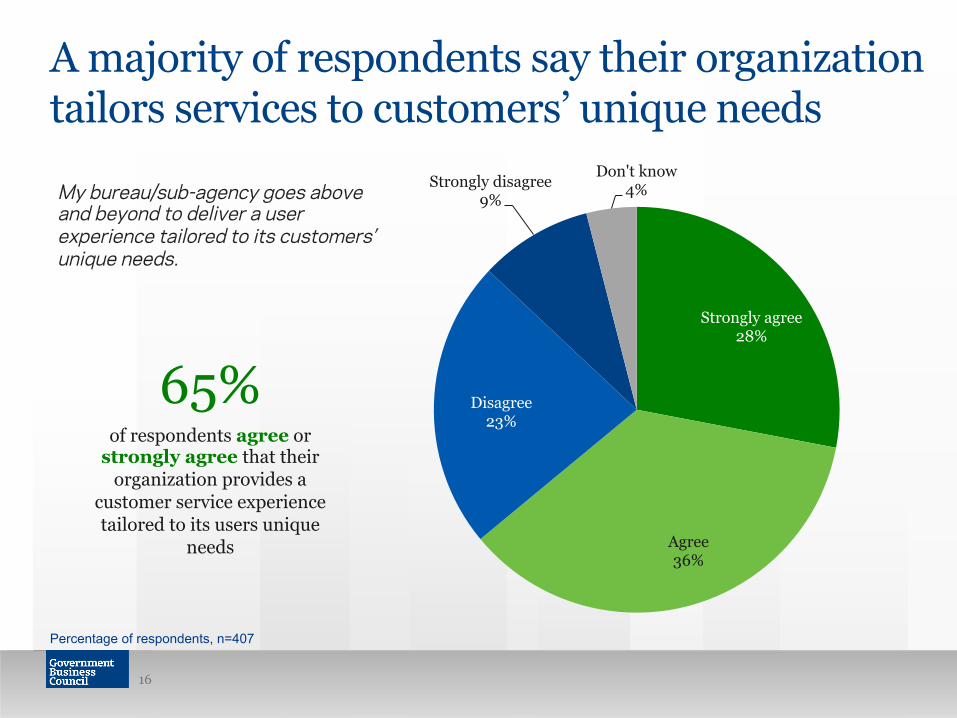
Strongly agree 28%
Agree 36%
Disagree 23%
Strongly disagree 9%
Don't know 4%
A majority of respondents say their organization tailors services to customers’ unique needs
16
Percentage of respondents, n=407
65%
of respondents agree or strongly agree that their
organization provides a customer service experience tailored to its users unique
needs
My bureau/sub-agency goes above and beyond to deliver a user experience tailored to its customers’ unique needs.

Strongly agree 29%
Agree 38%
Disagree 19%
Strongly disagree 10%
Don't know 4%
Two-thirds of respondents say their customer service is at least on par with the private sector
17
Percentage of respondents, n=408
67%
of respondents agree or strongly agree that their
organization provides a customer service experience
that is at least on par with the private sector
My bureau/sub-agency provides a customer service experience that is at least equal in quality to what one would expect from the private sector.

Respondent confidence in high service quality is consistent across customer groups
18
of respondents say their organization provides a level of customer service to individuals or members of the general public…
69% of respondents say their organization provides a level of customer service to businesses or private organizations…
68% of respondents say their organization provides a level of customer service to other public sector entities… 64%
Percentage of respondents, individuals/members of the public n=186, businesses/private organizations n=89, other public sector n=117
…that is on par with the private sector standard
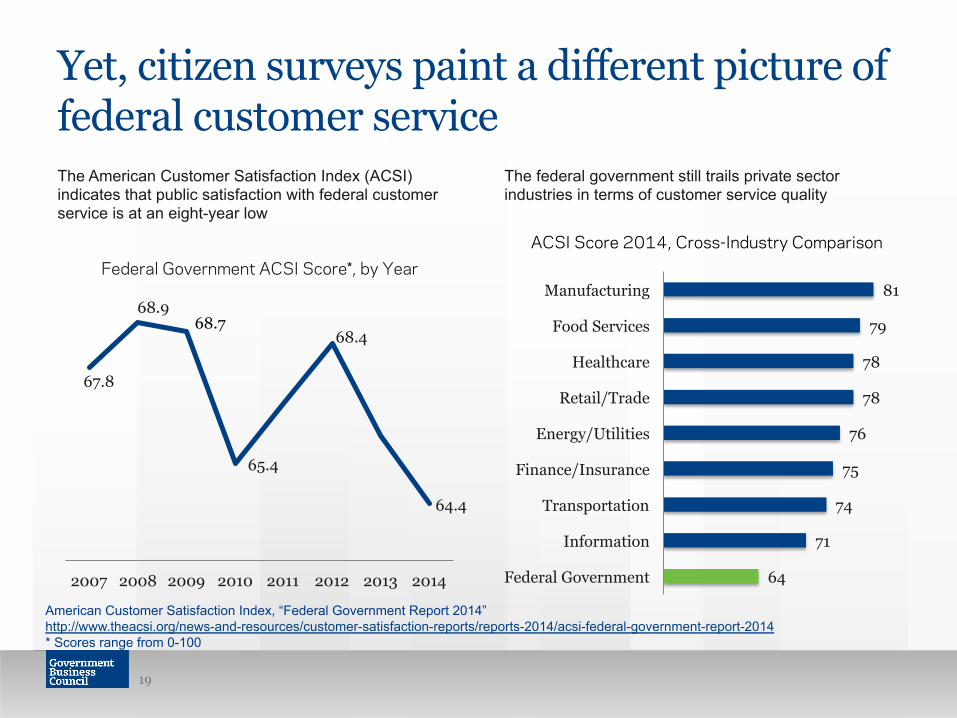
Yet, citizen surveys paint a different picture of federal customer service The American Customer Satisfaction Index (ACSI) indicates that public satisfaction with federal customer service is at an eight-year low
67.8
68.9
65.4
68.4
64.4
2007 2008 2009 2010 2011 2012 2013 2014
Federal Government ACSI Score*, by Year
68.7
The federal government still trails private sector industries in terms of customer service quality
64
71
74
75
76
78
78
79
81
Federal Government
Information
Transportation
Finance/Insurance
Energy/Utilities
Retail/Trade
Healthcare
Food Services
Manufacturing
ACSI Score 2014, Cross-Industry Comparison
19
American Customer Satisfaction Index, “Federal Government Report 2014” http://www.theacsi.org/news-and-resources/customer-satisfaction-reports/reports-2014/acsi-federal-government-report-2014 * Scores range from 0-100

Strongly agree 10%
Agree 46%
Disagree 27%
Strongly disagree 12%
Don't know 5%
Users of intra-governmental services have mixed feelings about customer service quality
20
Percentage of respondents who indicate they receive service from another department/agency, n=121
Only 56%
of respondents are satisfied with the services they
receive from other departments/agencies
I am satisfied with the quality of customer service I receive from other departments/agencies.

21
ii. Drivers and Obstacles

Compliance and citizen engagement top the list of factors driving customer service reforms
22
4%
6%
7%
30%
33%
37%
43%
44%
48%
52%
Don't know
None of the above
Other
Improving interagency collaboration
Improving employee productivity
Improving public trust in government
Reducing costs
Improving customer satisfaction with public services
Improving engagement with customers/citizens
Complying with federal mandates
Top Drivers of Customer Service Reforms
Percentage of respondents, n=408 Respondents were asked to select all that apply

52% 48%
44% 43% 47%
50%
57%
40%
60%
43% 39% 40%
Complying with federal mandates
Improving engagement with customers
Improving customer satisfaction
Reducing costs
Aggregate sample Public service providers Regulators
Compliance is paramount for regulators, just as customer satisfaction is for service providers
23
Top Drivers of Customer Service Reforms, by Core Mission
Percentage of respondents, aggregate sample n=408, public service providers n=159, regulators n=99 Respondents were asked to select all that apply

However, budgetary, technological, and cultural challenges impede necessary reforms
24
5%
9%
14%
26%
30%
33%
35%
38%
45%
55%
None of the above
Don't know
Compliance with privacy laws governing customer data
Misaligned employee incentives
Lack of leadership buy-in
Lack of coordination with other agencies
Lack of proper training
Cultural resistance to change
Outdated systems/technologies
Budget constraints
Top Obstacles to Improving Customer Service Quality
Percentage of respondents, n=403 Respondents were asked to select all that apply

Many of the challenges federal agencies face are structural
25
Sampling of open-ended responses
We have an exponentially expanding customer base due to the baby boomers reaching retirement age and a static or declining level of resources. In addition, customer expectations for new service delivery platforms (i.e., Internet, live chat, etc.) are increasing, but we do not have the resources to bring these platforms online as quickly as public preferences are changing. That creates a drag on our ability to affect change.
“
” Services need to be individualized but staffing levels have decreased, which decreases amount of attention each case can receive.
“ ”
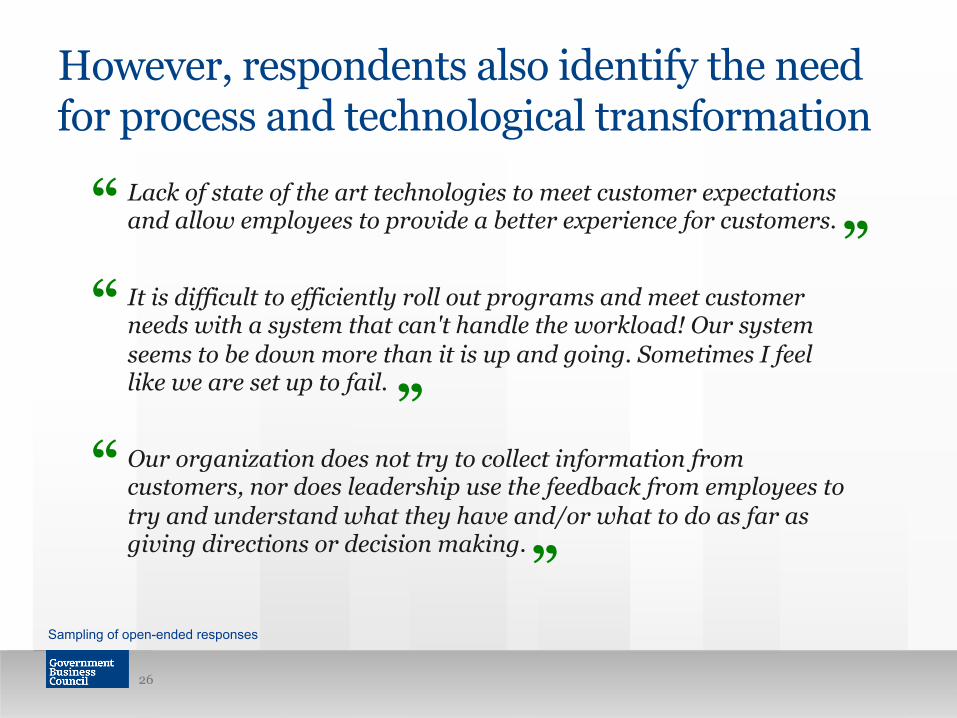
However, respondents also identify the need for process and technological transformation
26
Sampling of open-ended responses
“ ”
Lack of state of the art technologies to meet customer expectations and allow employees to provide a better experience for customers.
It is difficult to efficiently roll out programs and meet customer needs with a system that can't handle the workload! Our system seems to be down more than it is up and going. Sometimes I feel like we are set up to fail.
“
” Our organization does not try to collect information from customers, nor does leadership use the feedback from employees to try and understand what they have and/or what to do as far as giving directions or decision making.
“
”

55%
45%
38% 35% 33%
55% 55%
42% 38% 38%
56%
42%
35% 30%
33%
Budget constraints Outdated systems/technologies
Cultural resistance to change
Lack of proper training Lack of coordination with other agencies
Aggregate sample Public service providers Regulators
Public service providers perceive greater technological and cultural challenges
27
Percentage of respondents, aggregate sample n=403, public service providers n=159, regulators n=97 Respondents were asked to select all that apply
Top Obstacles to Improving Customer Service Quality, by Core Mission

28
iii. Reforms Currently Underway
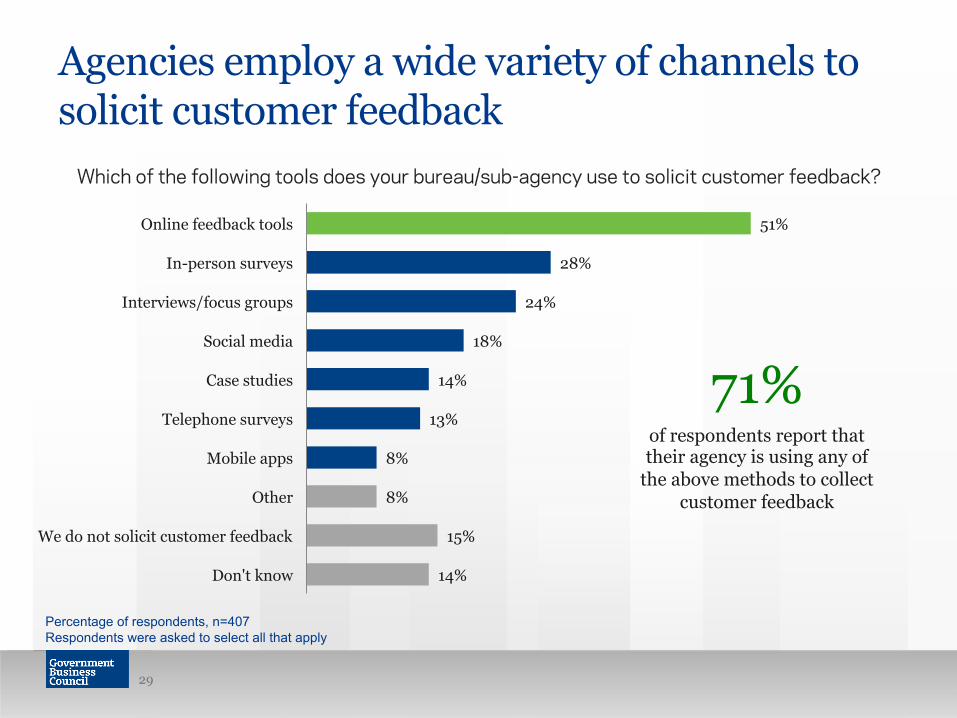
Agencies employ a wide variety of channels to solicit customer feedback
29
14%
15%
8%
8%
13%
14%
18%
24%
28%
51%
Don't know
We do not solicit customer feedback
Other
Mobile apps
Telephone surveys
Case studies
Social media
Interviews/focus groups
In-person surveys
Online feedback tools
Percentage of respondents, n=407 Respondents were asked to select all that apply
71%
of respondents report that their agency is using any of
the above methods to collect customer feedback
Which of the following tools does your bureau/sub-agency use to solicit customer feedback?

Strongly agree 11%
Agree 36%
Disagree 23%
Strongly disagree 13%
Don't know 17%
But less than half of respondents say their organizations do a good job collecting feedback
30
Percentage of respondents, n=407
Only 47%
of respondents agree or strongly agree that their
organization does a good job of soliciting customer
feedback
My bureau/sub-agency does a good job of soliciting customer feedback.

Strongly agree 11%
Agree 42%
Disagree 20%
Strongly disagree 10%
Don't know 17%
Half of respondents say their organizations clearly display customer service guidelines
31
Percentage of respondents, n=407
Only 53%
of respondents agree or strongly agree that their
organization clearly displays its customer service policies
and guidelines
My bureau/sub-agency clearly displays its customer service policies and guidelines for public consideration.
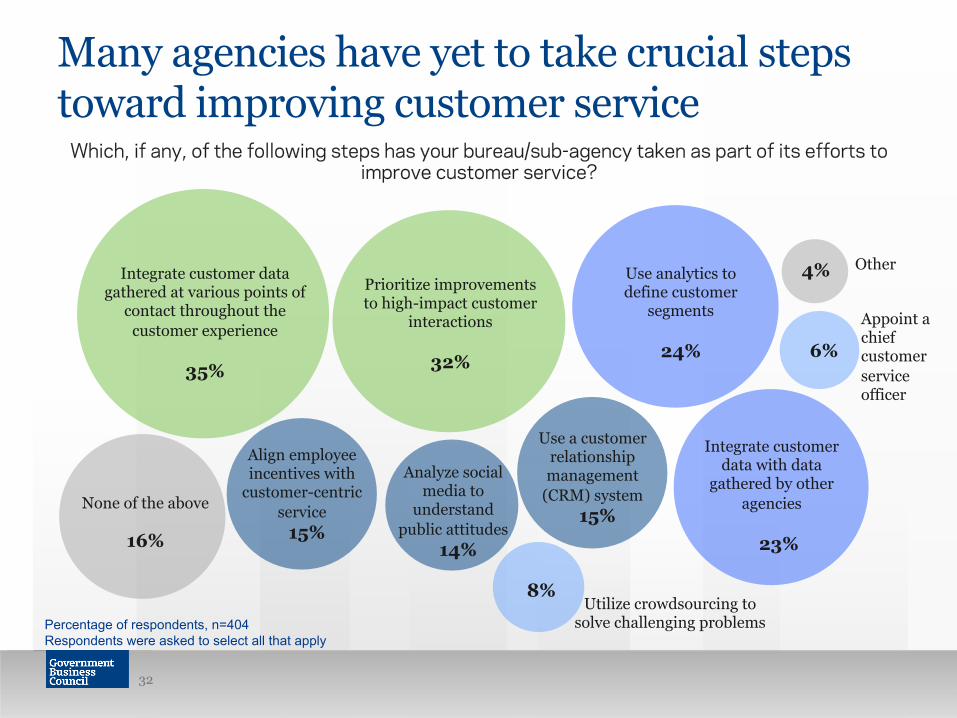
Many agencies have yet to take crucial steps toward improving customer service
32
Percentage of respondents, n=404 Respondents were asked to select all that apply
Which, if any, of the following steps has your bureau/sub-agency taken as part of its efforts to improve customer service?
Integrate customer data gathered at various points of
contact throughout the customer experience
35%
Prioritize improvements to high-impact customer
interactions
32%
6%
4% Use analytics to define customer
segments
24%
Integrate customer data with data
gathered by other agencies
23%
Other
Appoint a chief customer service officer
Use a customer relationship management
(CRM) system 15%
None of the above
16%
Align employee incentives with
customer-centric service 15%
Analyze social media to
understand public attitudes
14% 8%
Utilize crowdsourcing to solve challenging problems

Yes 42%
We have developed metrics,
but have yet to implement them
4%
No 17%
Don't know 37%
Less than half of respondents say their agencies use quantitative metrics to track performance
33
Percentage of respondents, n=409
Only 42%
of respondents report that their organization uses
quantitative metrics to track customer service
performance
Does your bureau/sub-agency use quantitative metrics to track its performance over time?

34
4 Final Considerations

To achieve more customer-centric service: Identify and prioritize cultural and process-driven improvements to customer service Although limited budgets will continue to be a reality for the foreseeable future, many of the challenges identified in this report can be addressed through a re-examination of current processes. Respondents, especially those in public service-focused organizations, indicate that overcoming cultural resistance to change and improving training and interagency collaboration could help agencies improve customer satisfaction. Further, less than half of respondents say their organizations are using quantitative metrics to track customer service performance, and even fewer report that their agency is taking other crucial steps like prioritizing improvements to high-impact services and aligning employee incentives with customer-centric service. Addressing these issues can make meaningful improvements in service quality despite the current budget environment.
Use customer feedback to help identify areas for improvement
Less than half of respondents say their organization is doing a good job of collecting customer feedback. By encouraging customers to voice their opinions on the services they receive, agencies can more readily identify problems that might have been overlooked or caused greater issues downstream. In addition, demonstrating responsiveness to customer feedback can help agencies build trust with their core constituencies and help improve overall satisfaction.
Leverage data and analytics to provide a more personalized user experience
Agencies have a diverse range of core missions and customer groups, which makes it essential that agencies tailor their services to users’ unique needs. While a majority of respondents believes that their agency is already doing this, there is ample room for improvement. Respondents indicate that agencies are behind the curve when it comes to integrating customer data from various touchpoints, as well as with data collected by other agencies. By adopting a more data-driven approach, agencies can better understand and anticipate the needs of their major constituencies and deliver better, more customer-centric service.
35

Underwritten by
About Deloitte Digital
Deloitte Digital is a digital consulting agency that brings together all the creative and technology capabilities, business acumen, and industry insight needed to help transform clients’ businesses. Learn more at www.deloittedigital.com.
Greg Pellegrino Principal Deloitte Consulting LLP
Tel. 571.882.7600 [email protected]
Nishita Henry Principal Deloitte Consulting LLP
Tel. 571.814.7440 [email protected]

About GBC
Contact
Zoe Grotophorst Director, Research & Content Services
Tel. 202.266.7335 [email protected]
govexec.com/GBC @GovBizCouncil
Our Mission
Government Business Council (GBC), the research arm of Government Executive Media Group, is dedicated to advancing the business of government through analysis and insight. GBC partners with industry to share best practices with top government decision makers, understanding the deep value inherent in industry’s experience engaging and supporting federal agencies.
37