Embed Size (px)
Citation preview

Professor Sue Horton (University of Waterloo)
Costing
Planning, Costing and FinancingCommunity of Practice
Questions

Nutrition-specific interventions
• Nutrition-specific interventions are expected to have their major outcome as improved nutrition
• Hence it makes sense to measure the costs per beneficiary, i.e. per person whose nutrition is to be improved
• Generally we are less concerned about other possible outcomes (e.g. jobs created for nutrition workers), and don’t measure these

Nutrition-sensitive interventions
• By contrast, the Agriculture Ministry has other major goals (increase incomes, reduce dependency on imported food, create rural employment for example: nutrition is a side benefit)
• The nutrition improvements occurring might be in urban areas (through food markets) – i.e. not even households with whom the Agriculture Ministry interacts
Nutrition-sensitive interventions
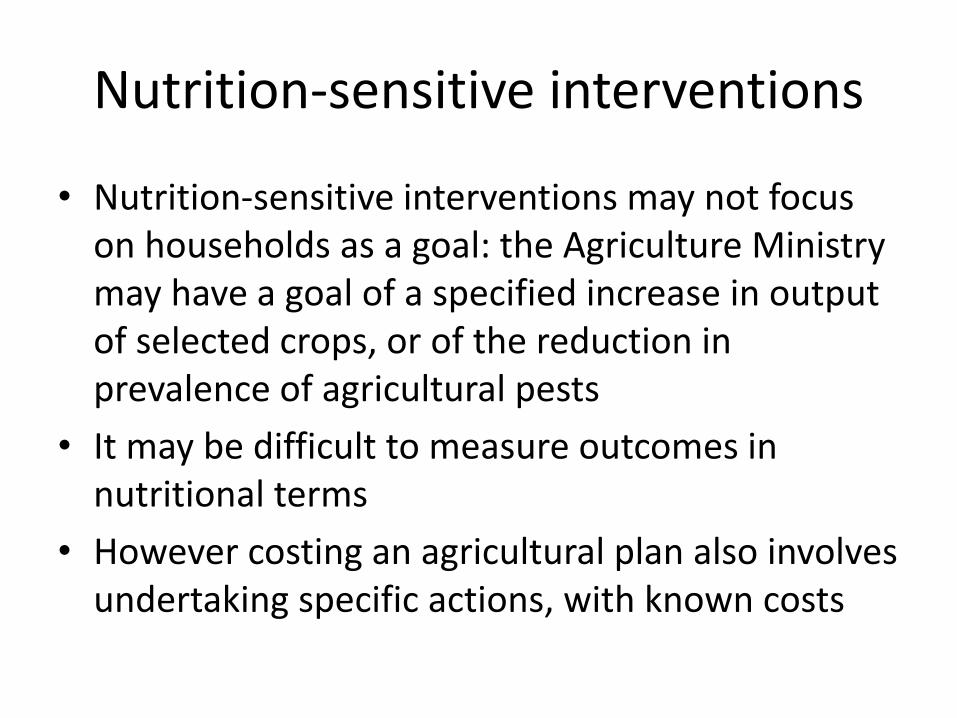
• Nutrition-sensitive interventions may not focus on households as a goal: the Agriculture Ministry may have a goal of a specified increase in output of selected crops, or of the reduction in prevalence of agricultural pests
• It may be difficult to measure outcomes in nutritional terms
• However costing an agricultural plan also involves undertaking specific actions, with known costs

Planning jointly for nutrition-specific and nutrition-sensitive investments
• For some nutrition-sensitive investments we can use same methodology as for nutrition-specific (number of beneficiaries, unit cost per beneficiary) – e.g. some aspects of education, WASH, social protection
• For agriculture:– In a few cases can identify cost per beneficiary household
with direct nutrition benefit in the same household– In some cases we can link numbers of beneficiary
households (farmers) with nutrition benefits to other households (landless, urban poor)
– In other cases link still more indirect: link acreage with improved irrigation with nutrition benefits to other households


Environment Model: Theoretical Framework
Environmen
t and Water
Strong or Weak
Associations for decision
making
Nutrition Sensitive
Sector
Interventions/Delivery Channels
OutcomeAreas
Predictors
Reduced diarrhea[diarrhea rate]
Promotion of access to water and sanitation
Safety of complementary foods
Contextual
Factors
% Rural Population
Adult Literacy Rates
Vaccination Rates
Source: Fanzo et al, 2014

Agriculture Model: Theoretical framework
Agriculture
Complementary feeding
(minimum acceptable diet)
Maternal nutrition[low birth weight; dietary patterns:
% energy from non staples, calories per
capita, micronutrient availability] Strong or
Weak Associations for decision
making
Nutrition Sensitive
Sector
Agricultural Investments Outcome areas Predictors
Inputs• Ag biodiversity• Fertilizer • Land available for agriculture• Water available for agriculture• MechanizationRural Infrastructure• Irrigation• Crop storage facilities• Road infrastructure• Port infrastructure• Mobile networkInstitutions and governance• Access to finance • Policy and legal framework• Accountability and
transparancy• Allocation of pub resourcesMarkets• Ag imports and exports• Ag import tarifsResearch• Ag R&D
Contextual factors
Economic setting and agricultural role in society• GNI per capita• GINI index• % rural population• % Ag value added• % Ag employmentHealth setting• Life expectancy• # physicians per
1000Gender• Girls/boys ratio in
secondary schoolEducation• Literacy
Source: Fanzo et al, 2014

WASH exampleIntervention Outcome Impact
Hand washing Diarrhea rates The likelihood of diarrhea for those who were exposed to hand washing interventions is 24% less likely than for those in the control group (RR= 0.76% CI: 0.62 to 0.93, p=0.0074)
Water treatment
Source: Fanzo et al 2014
Diarrhea rates The likelihood of diarrhea those who were exposed to water treatment intervention is 29% less likely than for those in control group (RR= 0.7073% CI: 0.56 to 0.90, p=0.0043).
• Suppose we have 100 households with malnourished children, and none of these households use appropriate handwashing
• Then if we provide handwashing training to all 100, we anticipate 24 households will improve nutritional status
• So number of beneficiaries – WASH – translates to an impact on nutrition within the same household
Agriculture – one example
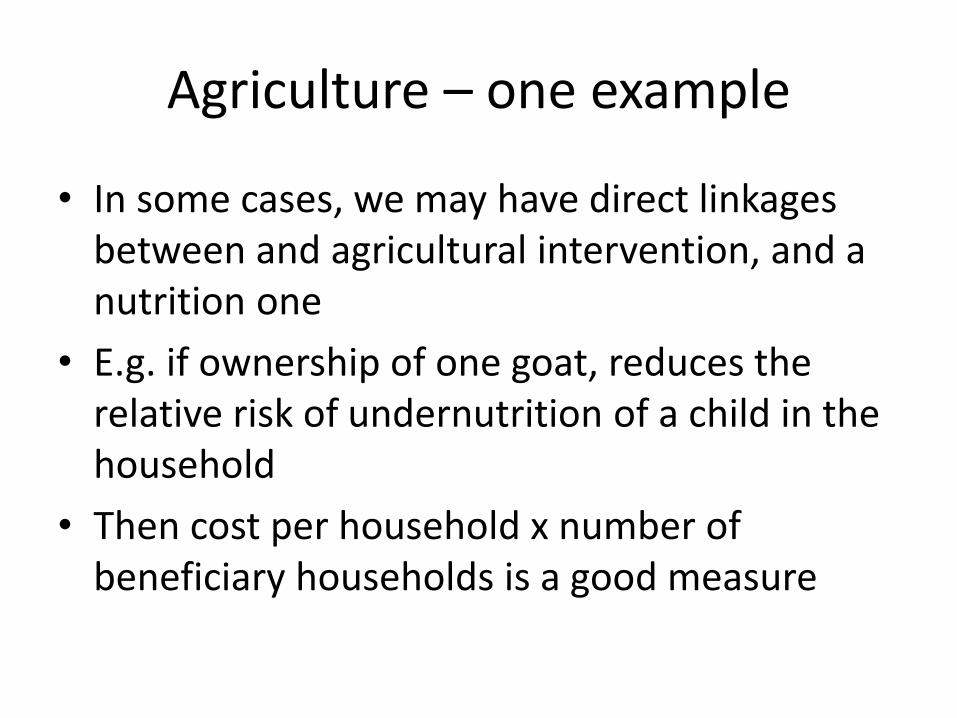
• In some cases, we may have direct linkages between and agricultural intervention, and a nutrition one
• E.g. if ownership of one goat, reduces the relative risk of undernutrition of a child in the household
• Then cost per household x number of beneficiary households is a good measure

Agriculture: second example
• Suppose that providing credit to an additional 1000 small farmers, leads to an increase in agricultural supply of a known amount (x%)
• And suppose this increase in agricultural supply is known to have a benefit for nutrition of y%
• Then if we know the cost of credit (admin costs, cost of bad loans), and the number of households to receive loans, we can calculate cost of the intervention AND estimate nutritional benefit
Agriculture: third example
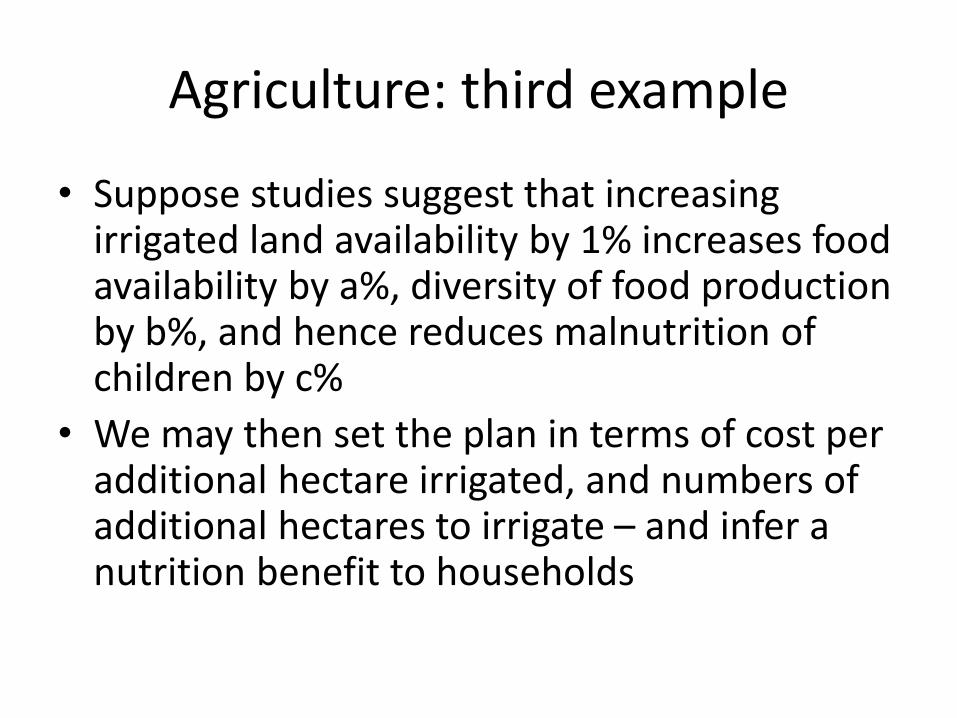
• Suppose studies suggest that increasing irrigated land availability by 1% increases food availability by a%, diversity of food production by b%, and hence reduces malnutrition of children by c%
• We may then set the plan in terms of cost per additional hectare irrigated, and numbers of additional hectares to irrigate – and infer a nutrition benefit to households

Common Results Framework
• When plans contain a variety of interventions, from a variety of sectors, some could be expressed in terms of numbers of beneficiaries, and unit cost per beneficiary is known
• Others could be expressed in different units, e.g. number of loans provided to small farmers, also with known unit cost
• But research informs us of the nutritional benefit