Embed Size (px)
Citation preview

Original title: Statøpis – Statistični pregled Slovenije 2014
Editors: Martin Bajželj, Katja Kalin, Lea Kozina, Peter Štemberger, Tina Žnidaršič
Infographics by Matjaž Erker
Translated by Boris Panič
The publication is available at: www.stat.si/eng/pub.asp
Information provided by the Information Centre:
Phone: +386 1 241 64 04
e-mail: [email protected]
@StatSlovenia
Issued and published by the Statistical Office of the Republic of Slovenia, Ljubljana, Litostrojska cesta 54 – © SURS – Use and publication of data is allowed provided the source is acknowledged – ISSN 2385-9334

STAT'O'BOOK 3
FOREWORD
Stat’o’book is our new publication that replaces two of our former publications, the Statistical Yearbook of the Republic of
Slovenia and Slovenia in Figures. The title is a fusion of two words, statistics and yearbook. Don’t worry. Stat’o’book does not
bring statistical methodology or complicated details. It wishes to present in a concise, clear and interesting manner some of the
data that in our opinion touch the lives of everyone.
We selected data that are interesting, topical and important. They are presented in a modern way with infographics and other
graphical presentations and with short commentaries. The content is divided into 21 chapters of equal length. The chapters
match statistical domains on our new website, which will be launched in early-2015 and will also enable access to contents that
used to be published in the Statistical Yearbook, so our faithful Yearbook readers need not worry that they will be in any way at
a disadvantage. Stat’o’book will be updated every year both in terms of content and design.
So, view the Stat’o’book at your own risk. After reading it you will never be the same again. You will know much more! J
Genovefa Ružić Director-General

STAT'O'BOOK 5
CONTENTS
FOREWORD ..................................................................................................................................................................... 3
COUNTRY AND DEVELOPMENTTERRITORY AND CLIMATE .................................................................................................................................................... 6
PEOPLE AND SOCIETYPOPULATION ....................................................................................................................................................................... 10
EDUCATION ......................................................................................................................................................................... 14
LABOUR AND UNEMPLOYMENT........................................................................................................................................... 18
EARNINGS AND LABOUR COSTS .......................................................................................................................................... 22
QUALITY OF LIFE .................................................................................................................................................................. 26
SOCIAL PROTECTION ........................................................................................................................................................... 30
CULTURE AND MEDIA .......................................................................................................................................................... 34
ENVIRONMENT AND NATURAL RESOURCESENVIRONMENT .................................................................................................................................................................... 38
AGRICULTURE, FORESTRY, FISHERY ...................................................................................................................................... 42
ENERGY ............................................................................................................................................................................... 46
ECONOMY AND FINANCEGDP AND NATIONAL ACCOUNTS ......................................................................................................................................... 50
PRICES AND INFLATION ....................................................................................................................................................... 54
FOREIGN ECONOMIC RELATIONS ......................................................................................................................................... 58
MANUFACTURING AND SERVICESCONSTRUCTION ................................................................................................................................................................... 62
INDUSTRY ............................................................................................................................................................................ 66
ENTERPRISES ....................................................................................................................................................................... 70
DEVELOPMENT AND TECHNOLOGY ..................................................................................................................................... 74
TRANSPORT ......................................................................................................................................................................... 78
TRADE AND SERVICES ......................................................................................................................................................... 82
TOURISM ............................................................................................................................................................................. 86
STATISTICAL SIGNS, ABBREVIATIONS AND UNITS OF MEASUREMENT .......................................................... 90

7STAT'O'BOOK / COUNTRY AND DEVELOPMENT
Sources:SMA,ARSO
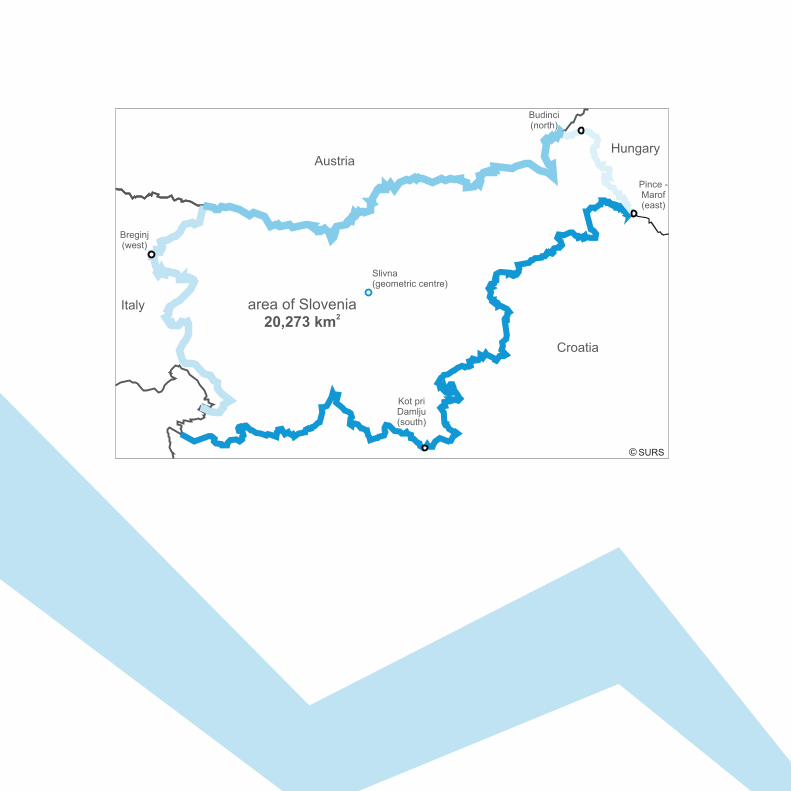
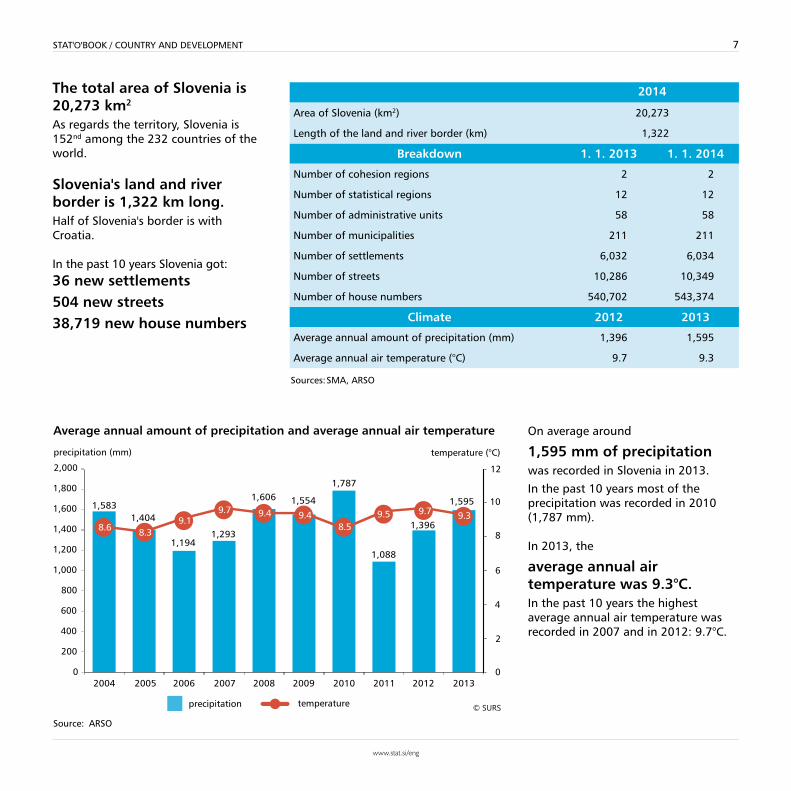
The total area of Slovenia is 20,273 km2
Asregardstheterritory,Sloveniais152ndamongthe232countriesoftheworld.
Slovenia's land and river border is 1,322 km long.HalfofSlovenia'sborderiswithCroatia.
Inthepast10yearsSloveniagot:36 new settlements 504 new streets38,719 new house numbers
2014
AreaofSlovenia(km2) 20,273
Lengthofthelandandriverborder(km) 1,322
Breakdown 1. 1. 2013 1. 1. 2014
Numberofcohesionregions 2 2
Numberofstatisticalregions 12 12
Numberofadministrativeunits 58 58
Numberofmunicipalities 211 211
Numberofsettlements 6,032 6,034
Numberofstreets 10,286 10,349
Numberofhousenumbers 540,702 543,374
Climate 2012 2013
Averageannualamountofprecipitation(mm) 1,396 1,595
Averageannualairtemperature(°C) 9.7 9.3
Average annual amount of precipitation and average annual air temperature
Source: ARSO
Onaveragearound
1,595 mm of precipitationwasrecordedinSloveniain2013.
Inthepast10yearsmostoftheprecipitationwasrecordedin2010(1,787mm).
In2013,the
average annual air temperature was 9.3°C.Inthepast10yearsthehighestaverageannualairtemperaturewasrecordedin2007andin2012:9.7°C.
8 STAT'O'BOOK / COUNTRY AND DEVELOPMENT
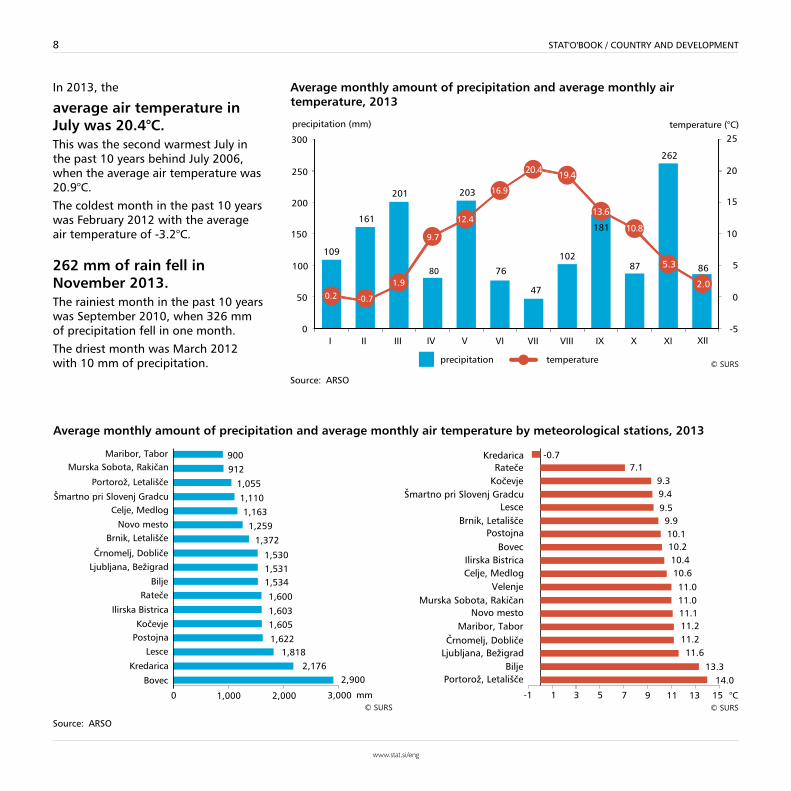
In 2013, the
average air temperature in July was 20.4°C.This was the second warmest July in the past 10 years behind July 2006, when the average air temperature was 20.9°C.
The coldest month in the past 10 years was February 2012 with the average air temperature of -3.2°C.
262 mm of rain fell in November 2013.The rainiest month in the past 10 years was September 2010, when 326 mm of precipitation fell in one month.
The driest month was March 2012 with 10 mm of precipitation.
Average monthly amount of precipitation and average monthly air temperature, 2013
Source: ARSO
Average monthly amount of precipitation and average monthly air temperature by meteorological stations, 2013
Source: ARSO

9STAT'O'BOOK / COUNTRY AND DEVELOPMENT
Total greenhouse gas emissions
Source: ARSO
The amount of greenhouse gas emissions was the highest in 2008. At that time 21,384 Gg of CO2 equivalent of these gases were emitted. A year later the amount of greenhouse gas emissions declined significantly; between 2009 and 2011 it was almost the same. The amount of greenhouse gas emissions declined again in 2012.
Greenhouse gases According to ARSO, the concentration of the most important greenhouse gas CO2 has increased by about 40% since 1750, while in the past 130 years the average global surface temperature increased by 0.85 ± 0.2°C.
The share of carbon dioxide among greenhouse gases is by far the largest: 83%.The share of methane among greenhouse gases is 10% and the share of nitrous oxide is 6%. Other greenhouse gases are present in much smaller quantities.
Since 1992 the share of nitrous oxide has decreased the most, while the share of partially fluorinated hydrocarbons has gone up.
Shares of individual gases in total greenhouse gas emissions, 2012
Source: ARSO


11STAT'O'BOOK / PEOPLE AND SOCIETY
At the end of 2013 on average
one in 21 residents of Slovenia was a foreign citizen, i.e. a citizen of one of the 142 countries of the world.
One in two settlements in Slovenia had fewer than 100 inhabitants, while the largest settlement, the capital Ljubljana, had 277,554 inhabitants at the end of 2013.
Marija and Francare the most common names in Slovenia.Most of the people have their birthdays on 1 January; the fewest on 31 December.
At the end of 2013 residents of Slovenia were
on average 42.3 years old. Men (40.7 years) were on average 3 years younger than women (43.8 years).
One in 7 residents of Slovenia was over 64 years old at the end of 2013.
Up to the age of 61 years there are more men than women in the population. At age 84 there are twice as many women as men and at age 87 three times as many.
2012 2013
number number mean age
Population as of 1 January 2,055,496 2,058,821 42.1
Live births 21,938 21,111 -
Deaths 19,257 19,334 76.1
Immigrants 15,022 13,871 33.0
Slovene citizens 2,741 2,250 40.3
foreign citizens 12,281 11,621 31.6
Emigrants 14,378 13,384 36.7
Slovene citizens 8,191 7,789 36.4
foreign citizens 6,187 5,595 37.1
Total increase 3,325 2,264 -
Population as of 31 December 2,058,821 2,061,085 42.3
- no occurrence of eventSource: SURS
Population by age
Source: SURS
12 STAT'O'BOOK / PEOPLE AND SOCIETY
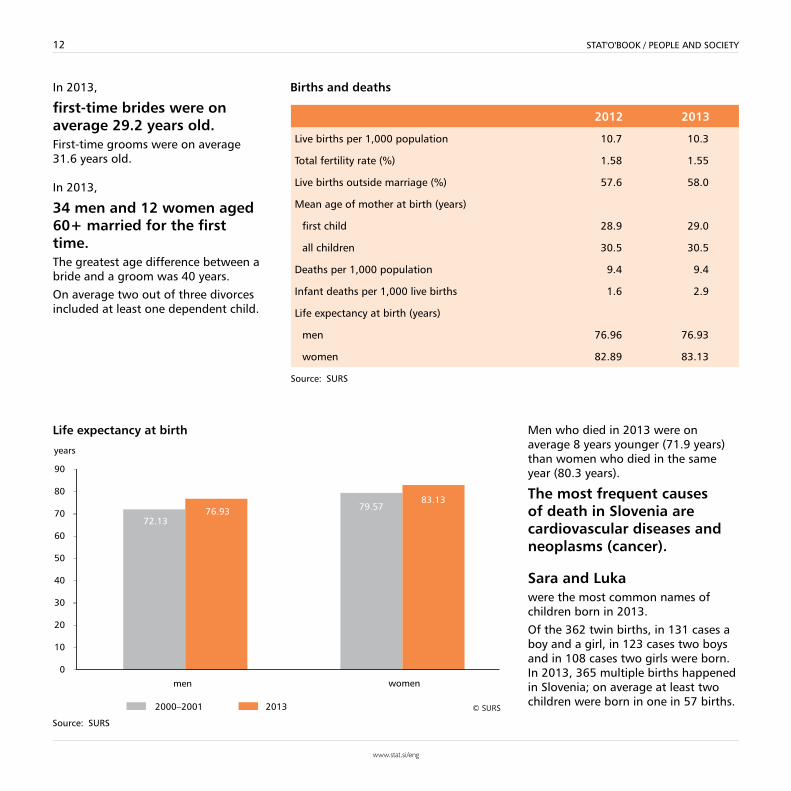
In 2013,
first-time brides were on average 29.2 years old. First-time grooms were on average 31.6 years old.
In 2013,
34 men and 12 women aged 60+ married for the first time. The greatest age difference between a bride and a groom was 40 years.
On average two out of three divorces included at least one dependent child.
Men who died in 2013 were on average 8 years younger (71.9 years) than women who died in the same year (80.3 years).
The most frequent causes of death in Slovenia are cardiovascular diseases and neoplasms (cancer).
Sara and Luka were the most common names of children born in 2013.
Of the 362 twin births, in 131 cases a boy and a girl, in 123 cases two boys and in 108 cases two girls were born.In 2013, 365 multiple births happened in Slovenia; on average at least two children were born in one in 57 births.
2012 2013
Live births per 1,000 population 10.7 10.3
Total fertility rate (%) 1.58 1.55
Live births outside marriage (%) 57.6 58.0
Mean age of mother at birth (years)
first child 28.9 29.0
all children 30.5 30.5
Deaths per 1,000 population 9.4 9.4
Infant deaths per 1,000 live births 1.6 2.9
Life expectancy at birth (years)
men 76.96 76.93
women 82.89 83.13
Source: SURS
Births and deaths
Life expectancy at birth
Source: SURS
13STAT'O'BOOK / PEOPLE AND SOCIETY
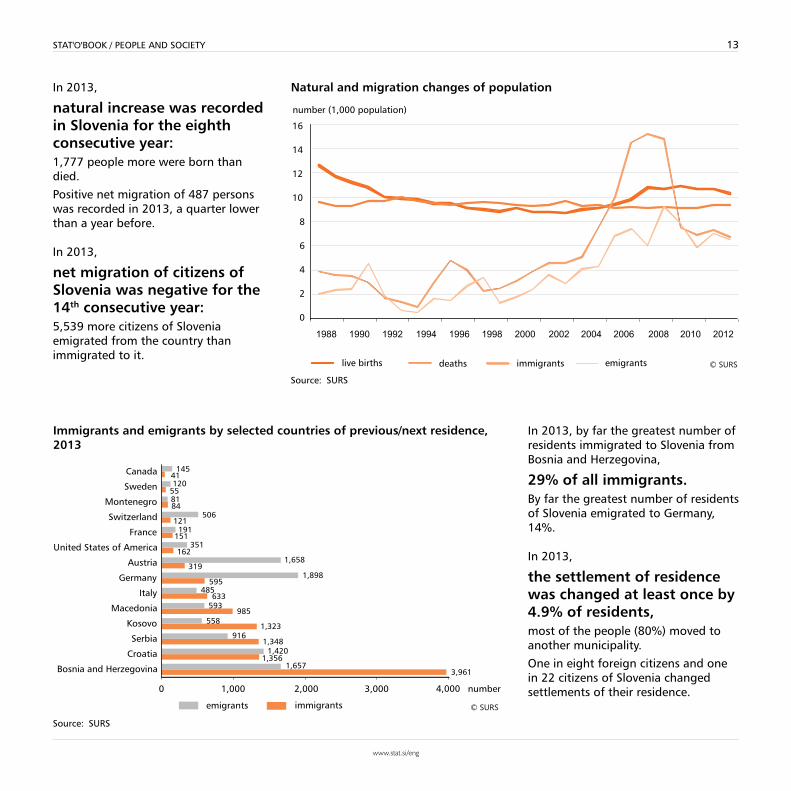
In 2013,
natural increase was recorded in Slovenia for the eighth consecutive year: 1,777 people more were born than died.
Positive net migration of 487 persons was recorded in 2013, a quarter lower than a year before.
In 2013,
net migration of citizens of Slovenia was negative for the 14th consecutive year: 5,539 more citizens of Slovenia emigrated from the country than immigrated to it.
In 2013, by far the greatest number of residents immigrated to Slovenia from Bosnia and Herzegovina,
29% of all immigrants. By far the greatest number of residents of Slovenia emigrated to Germany, 14%.
In 2013,
the settlement of residence was changed at least once by 4.9% of residents, most of the people (80%) moved to another municipality.
One in eight foreign citizens and one in 22 citizens of Slovenia changed settlements of their residence.
Natural and migration changes of population
Source: SURS
Immigrants and emigrants by selected countries of previous/next residence, 2013
Source: SURS

15STAT'O'BOOK / PEOPLE AND SOCIETY
In the 2013/14 school year
610 more children were enrolled in kindergartens and
2,178 more pupils were enrolled in basic schools than in the 2012/13 school year. On the other hand,
1,494 fewer pupilswere enrolled in upper secondary schools and
7,084 fewer studentswere enrolled in tertiary education. In 2013, there were
57 basic schools and institutions with adapted curriculum in Slovenia.They were attended by 1,807 pupils.
Beginning of the school year 2012/13 2013/14
Number of children in kindergartens 83,090 83,700
Number of kindergartens with units 938 960
Number of children in basic schools 161,051 163,229
Number of basic schools and units 785 782
Number of basic schools and institutions implementing adapted curriculum 57 57
Number of children in basic schools and institutions with adapted curriculum 1,724 1,807
Number of pupils in upper secondary schools 78,208 76,714
Number of students 97,706 90,622
Number of graduates 20,596 18,774
Number of scholarship recipients (pupils and students) 41,994 39,813
Source: SURS
Children in kindergartens
Source: SURS
In 2013,
75% of all children aged 1-5 were enrolled in kindergartens.The highest share of children in kindergartens was 3-5 years old.
In 2013, there were
on average 87 childrenper kindergarten (or kindergarten unit), which is on average 8 children per educator and assistant educator.
There were
10,558 educators and assistant educators in Slovenia in 2013, 98% of them women.

16 STAT'O'BOOK / PEOPLE AND SOCIETY
At the beginning of the 2013/14 school year 166,500 children were enrolled in basic education, of whom:
163,229 in basic school with regular curriculum, 1,807 in basic school with adapted curriculum and 1,499 in basic school with special curriculum.
In all basic schools irrespective of their organisational form in the 2013/14 school year the average class had 19 pupils. A basic school or its branch had on average 209 pupils.
Since 2007 the number of pupils enrolled in private basic schools had increased by 678.
Basic education, 2013/14
Schools with regular curriculum 782
Number of boys 83,733
Number of girls 79,496
Number of boys repeating the grade 715
Number of girls repeating the grade 390
Schools with adapted curriculum 57
Number of boys 1,126
Number of girls 681
Number of boys repeating the grade 84
Number of girls repeating the grade 52
Source: SURS
Pupils enrolled in upper secondary education by type of education, 2013/14
Source: SURS
92% of all 15-18-year-olds participate in upper secondary education.In the 2013/14 school year enrolment in general upper secondary education was 2 percentage points lower and in technical upper secondary education 1 percentage point higher than in the previous school year. Enrolment in short-term vocational and vocational upper secondary education was the same as in the previous school year.
In the 2012/13 school year
18,463 pupils finished upper secondary education, 42% of whom finished technical upper secondary education.

17STAT'O'BOOK / PEOPLE AND SOCIETY
In the 2013/14 academic year
half of people aged 19-24 in Slovenia participated in short-term higher and higher education.13,251 students participated in higher vocational education and 77,371 in higher education.
In the 2013/14 academic year the shares of part-time students were:
40% of students in higher vocational education,
15% of students in higher undergraduate studies,
22% of students in higher postgraduate studies.
Number of students by fields of study, 2013/14
Total 90,622
Social sciences, business and law 28,536
Engineering, manufacturing and construction 16,934
Science, mathematics and computing 9,197
Services 8,605
Health and welfare 8,458
Humanities and arts 7,949
Education 7,469
Agriculture and veterinary 3,475
Source: SURS
In 2013,
7,305 male students and 11,469 female students graduated from tertiary education.The number of graduates was three times higher than in 1980. The first 6 students studying according to Bologna study programs graduated in 2005. Since then the share of “Bologna” graduates has been steadily increasing; in 2013
two thirds of all graduates were “Bologna” graduates.
Graduates
Source: SURS
19STAT'O'BOOK / PEOPLE AND SOCIETY
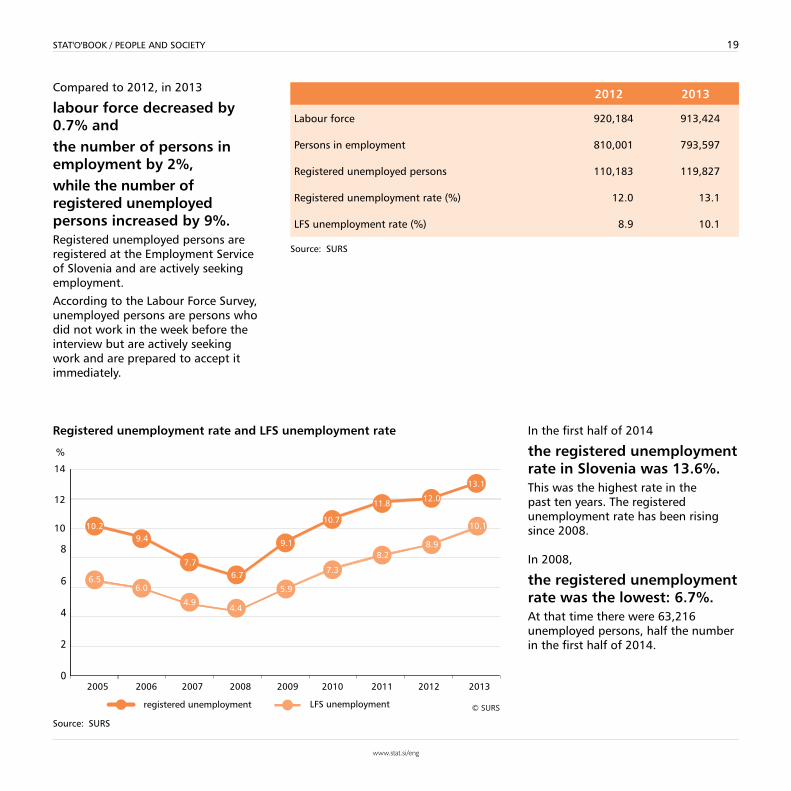
Compared to 2012, in 2013
labour force decreased by 0.7% andthe number of persons in employment by 2%,while the number of registered unemployed persons increased by 9%.Registered unemployed persons are registered at the Employment Service of Slovenia and are actively seeking employment.
According to the Labour Force Survey, unemployed persons are persons who did not work in the week before the interview but are actively seeking work and are prepared to accept it immediately.
In the first half of 2014
the registered unemployment rate in Slovenia was 13.6%.This was the highest rate in the past ten years. The registered unemployment rate has been rising since 2008.
In 2008,
the registered unemployment rate was the lowest: 6.7%.At that time there were 63,216 unemployed persons, half the number in the first half of 2014.
2012 2013
Labour force 920,184 913,424
Persons in employment 810,001 793,597
Registered unemployed persons 110,183 119,827
Registered unemployment rate (%) 12.0 13.1
LFS unemployment rate (%) 8.9 10.1
Source: SURS
Registered unemployment rate and LFS unemployment rate
Source: SURS

20 STAT'O'BOOK / PEOPLE AND SOCIETY
In 2013,
28% of registered unemployed persons had basic education or less.After 2008, when it was the lowest, the registered unemployment rate increased the most for people with basic education, by 16 percentage points. For people with upper secondary education it went up by 6 percentage points and for people with tertiary education by 4 percentage points. Since 2008, the registered unemployment rate for people who were unemployed for more than a year has gone up by 2.7 percentage points and for those who were unemployed for more than two years by 1.5 percentage points.
In 2013,
young people aged 15-24 had the highest registered unemployment rate. The registered unemployment rate for this age group was almost 30%; since 2008 it had increased by 17 percentage points. Among young people aged 25-29 years it was lower, but still above the average.
The registered unemployment rate of persons aged 50 or more was also higher than the average,although compared to 2008 it had increased less (by 6.3 percentage points) than the total registered unemployment rate.
2012 (%) 2013 (%)
Registered unemployment rate for men 11.5 12.5
Registered unemployment rate for women 12.6 13.8
Registered unemployment rate for persons with basic education or less 26.0 28.4
Registered unemployment rate for persons with upper secondary education 10.7 11.9
Registered unemployment rate for persons with tertiary education 6.2 7.2
Registered long-term unemployment rate (more than a year) 6.0 6.1
Registered very long-term unemployment rate (more than two years) 3.4 3.7
Source: SURS
Registered unemployment rate for selected population groups
Registered unemployment rate by age groups, 2013
Source: SURS
21STAT'O'BOOK / PEOPLE AND SOCIETY
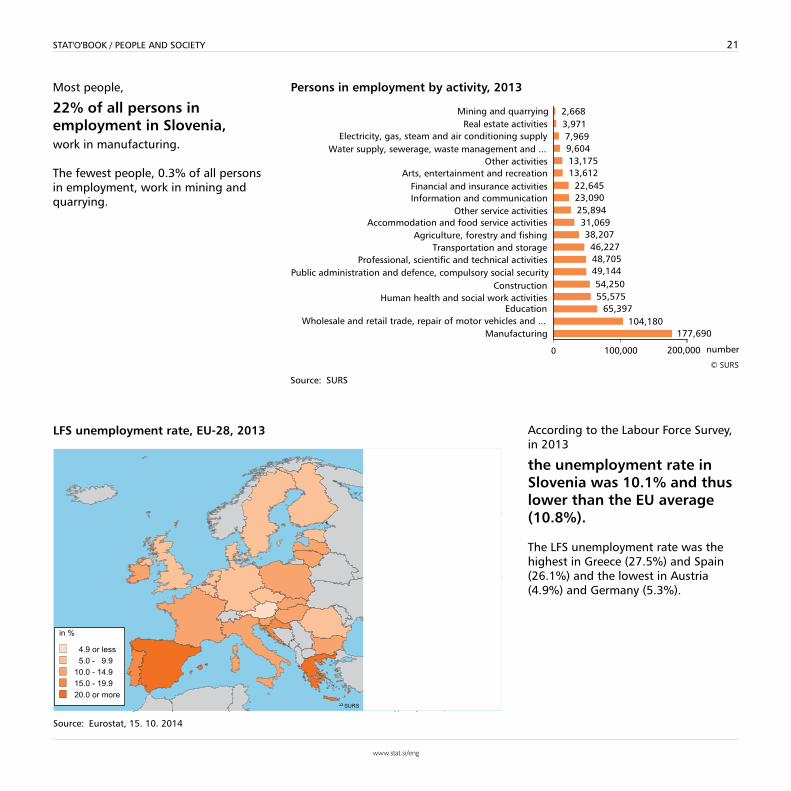
Most people,
22% of all persons in employment in Slovenia,work in manufacturing.
The fewest people, 0.3% of all persons in employment, work in mining and quarrying.
According to the Labour Force Survey, in 2013
the unemployment rate in Slovenia was 10.1% and thus lower than the EU average (10.8%).
The LFS unemployment rate was the highest in Greece (27.5%) and Spain (26.1%) and the lowest in Austria (4.9%) and Germany (5.3%).
Persons in employment by activity, 2013
Source: SURS
in %
4.9 or less
5.0 - 9.9
10.0 - 14.9
15.0 - 19.9
20.0 or more
SURS
Source: Eurostat, 15. 10. 2014
LFS unemployment rate, EU-28, 2013

23STAT'O'BOOK / PEOPLE AND SOCIETY
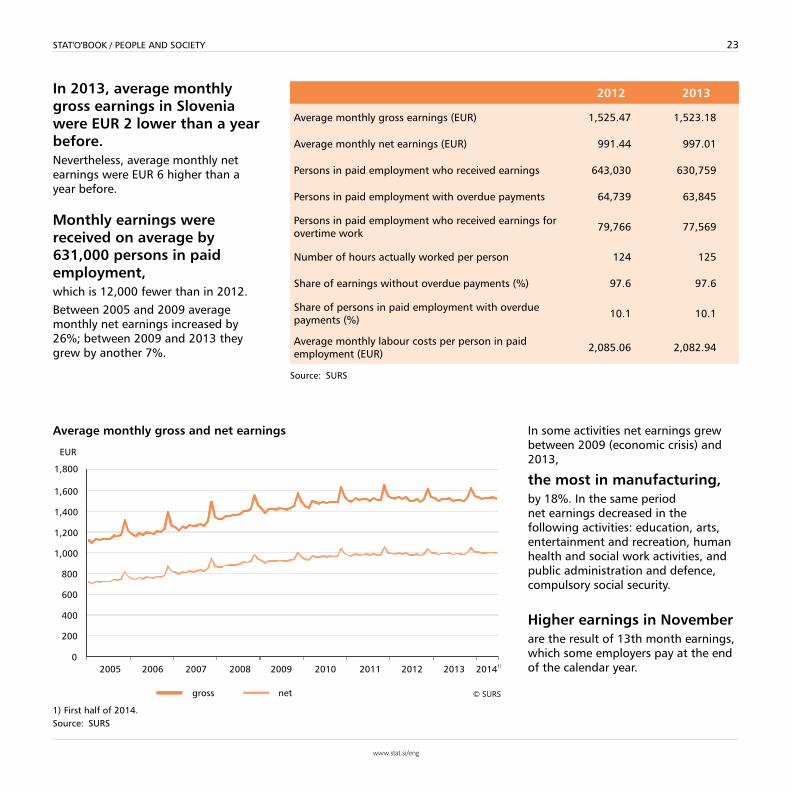
In 2013, average monthly gross earnings in Slovenia were EUR 2 lower than a year before.Nevertheless, average monthly net earnings were EUR 6 higher than a year before.
Monthly earnings were received on average by 631,000 persons in paid employment, which is 12,000 fewer than in 2012.
Between 2005 and 2009 average monthly net earnings increased by 26%; between 2009 and 2013 they grew by another 7%.
In some activities net earnings grew between 2009 (economic crisis) and 2013,
the most in manufacturing, by 18%. In the same period net earnings decreased in the following activities: education, arts, entertainment and recreation, human health and social work activities, and public administration and defence, compulsory social security.
Higher earnings in Novemberare the result of 13th month earnings, which some employers pay at the end of the calendar year.
2012 2013
Average monthly gross earnings (EUR) 1,525.47 1,523.18
Average monthly net earnings (EUR) 991.44 997.01
Persons in paid employment who received earnings 643,030 630,759
Persons in paid employment with overdue payments 64,739 63,845
Persons in paid employment who received earnings for overtime work 79,766 77,569
Number of hours actually worked per person 124 125
Share of earnings without overdue payments (%) 97.6 97.6
Share of persons in paid employment with overdue payments (%) 10.1 10.1
Average monthly labour costs per person in paid employment (EUR) 2,085.06 2,082.94
Source: SURS
Average monthly gross and net earnings
1) First half of 2014.Source: SURS
24 STAT'O'BOOK / PEOPLE AND SOCIETY
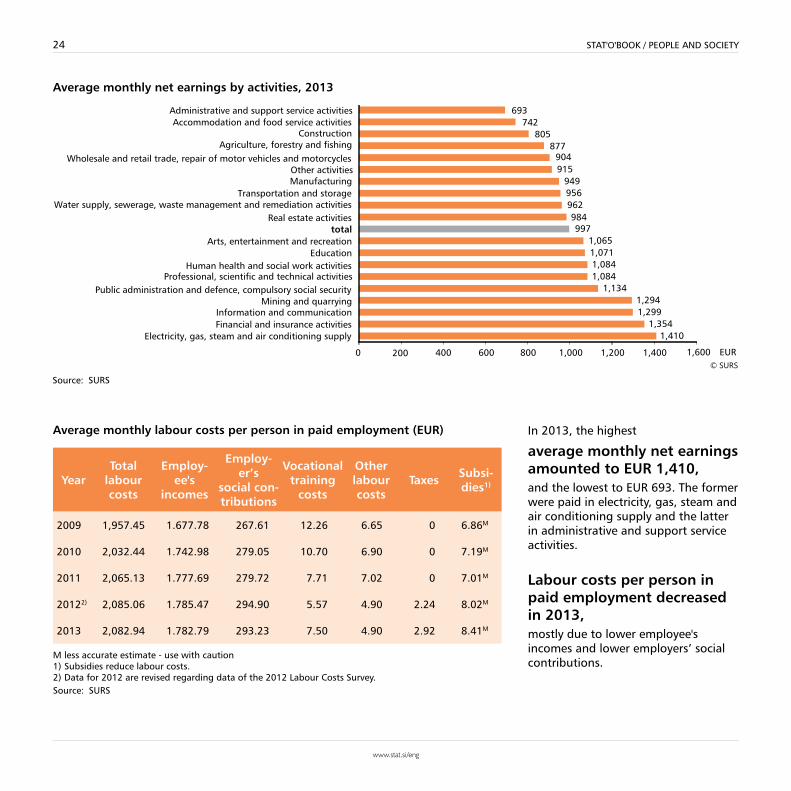
In 2013, the highest
average monthly net earnings amounted to EUR 1,410, and the lowest to EUR 693. The former were paid in electricity, gas, steam and air conditioning supply and the latter in administrative and support service activities.
Labour costs per person in paid employment decreased in 2013, mostly due to lower employee's incomes and lower employers’ social contributions.
Average monthly net earnings by activities, 2013
Source: SURS
Average monthly labour costs per person in paid employment (EUR)
YearTotal
labour costs
Employ-ee's
incomes
Employ-er’s
social con-tributions
Vocational training
costs
Other labour costs
Taxes Subsi- dies1)
2009 1,957.45 1.677.78 267.61 12.26 6.65 0 6.86M
2010 2,032.44 1.742.98 279.05 10.70 6.90 0 7.19M
2011 2,065.13 1.777.69 279.72 7.71 7.02 0 7.01M
20122) 2,085.06 1.785.47 294.90 5.57 4.90 2.24 8.02M
2013 2,082.94 1.782.79 293.23 7.50 4.90 2.92 8.41M
M less accurate estimate - use with caution1) Subsidies reduce labour costs.2) Data for 2012 are revised regarding data of the 2012 Labour Costs Survey.Source: SURS
25STAT'O'BOOK / PEOPLE AND SOCIETY
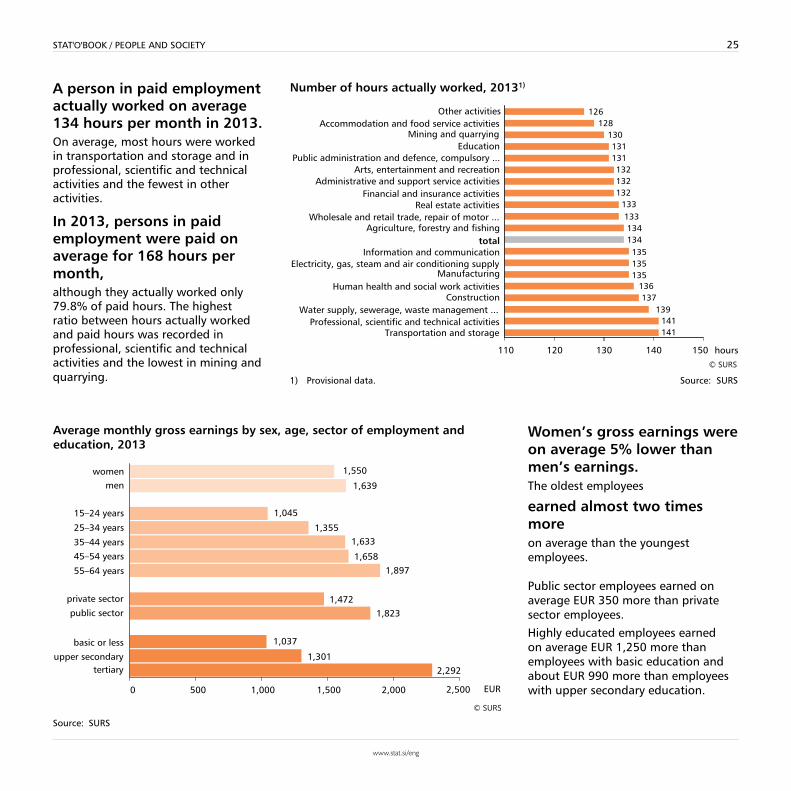
A person in paid employment actually worked on average 134 hours per month in 2013. On average, most hours were worked in transportation and storage and in professional, scientific and technical activities and the fewest in other activities.
In 2013, persons in paid employment were paid on average for 168 hours per month, although they actually worked only 79.8% of paid hours. The highest ratio between hours actually worked and paid hours was recorded in professional, scientific and technical activities and the lowest in mining and quarrying.
Women’s gross earnings were on average 5% lower than men’s earnings.The oldest employees
earned almost two times more on average than the youngest employees.
Public sector employees earned on average EUR 350 more than private sector employees.
Highly educated employees earned on average EUR 1,250 more than employees with basic education and about EUR 990 more than employees with upper secondary education.
Number of hours actually worked, 20131)
1) Provisional data. Source: SURS
Average monthly gross earnings by sex, age, sector of employment and education, 2013
Source: SURS


27STAT'O'BOOK / PEOPLE AND SOCIETY
In 2013,
the monthly at-risk-of-poverty threshold was EUR 593 net for a one-member household or the first adult person in a multi-member household.
A four-person household of two adults and two children younger than 14
had to have at least EUR 1,245 net monthly incometo be above the at-risk-of-poverty threshold.In 2013, people subjectively assessed overall life satisfaction by an average assessment of 7 (on the scale from 0 – not at all satisfied to 10 – completely satisfied).
The at-risk-of-poverty rate reached the highest levelin 2013.
The rate was the lowest before the onset of the economic crisis; then it started to rise and in 2013 it stood at 14.5%.
The calculation for 2013 is based on data on income in 2012.
The at-risk-of-poverty rate shows the share of people living in households in which net disposable income is below the at-risk-of-poverty threshold. This is relative poverty, which shows how many people are poor compared to others.
2012 2013
The at-risk-of-poverty or social exclusion rate (% of persons) 19.6 20.4
The at-risk-of-poverty rate (% of persons) 13.5 14.5
The severe material deprivation rate (% of persons) 6.6 6.7
The very low work intensity rate (% of persons aged 0-59 years) 7.5 8.0
Households that can afford:
keeping home adequately warm (% of households) 93 94
unexpected financial expenses of EUR 600 (% of households) 51 51
one week's annual holiday away from home (% of households) 67 66
Source: SURS
The at-risk-of-poverty rate
Source: SURS

28 STAT'O'BOOK / PEOPLE AND SOCIETY
In 2013,
410,000 people in Slovenia were at-risk-of-poverty or social exclusion, which is 18,000 more than a year before. The rate was 20.4%.
291,000 people were living below the at-risk-of-poverty threshold,which is one in seven people in Slovenia or 20,000 more than in the previous year.
Women are more vulnerable to poverty than men, particularly women after 64 years of age (26%)
Most of the people living
below the at-risk-of-poverty threshold in 2013 were retired (30%).Among households, the most vulnerable were households without working members (38% below the threshold), particularly those with dependent children (75% below the threshold).
As regards the type of households, one-member households (33%), single-parent households (30%) and couples with three or more children (17%) were the most vulnerable.
The at-risk-of-poverty rate was the lowest in households in which all adult members were in employment (4.2% below the threshold).
Source: SURS
Source: SURS
Persons at-risk-of-poverty or social exclusion

29STAT'O'BOOK / PEOPLE AND SOCIETY
Expenditure on transport, food, beverages, tobacco and housing represented almost half of total household consumption expenditure in 2012.
One-member households spent EUR 9,271, 22.0% on housing and 19.6% on food and non-alcoholic beverages.
Four-member households spent 2.5-times as much as one-member households, 21.4% on transport and 14.6% on food and non-alcoholic beverages.
In 2012, a household member consumed on average 54 litres of milk, 25 kg of bread, 25 kg of potato, 71 kg of vegetables, 65 kg of fruit and 48 kg of meat.
In 2013,
11,321 adults and 437 juveniles were convicted. Compared to 2012, the number of convicted adults increased by a third, mainly because due to the introduction of the pre-trial hearing and the agreement on the admission of guilt the cases are solved faster. The number of denounced, accused and convicted legal persons has been increasing for the past few years. The most frequently they find themselves in criminal proceedings due to
business fraud, violation of basic rights of employees and illegal employment.Most of the denounced legal persons are private construction companies.
Source: SURS
Source: SURS
Consumption expenditure, 2012

31STAT'O'BOOK / PEOPLE AND SOCIETY
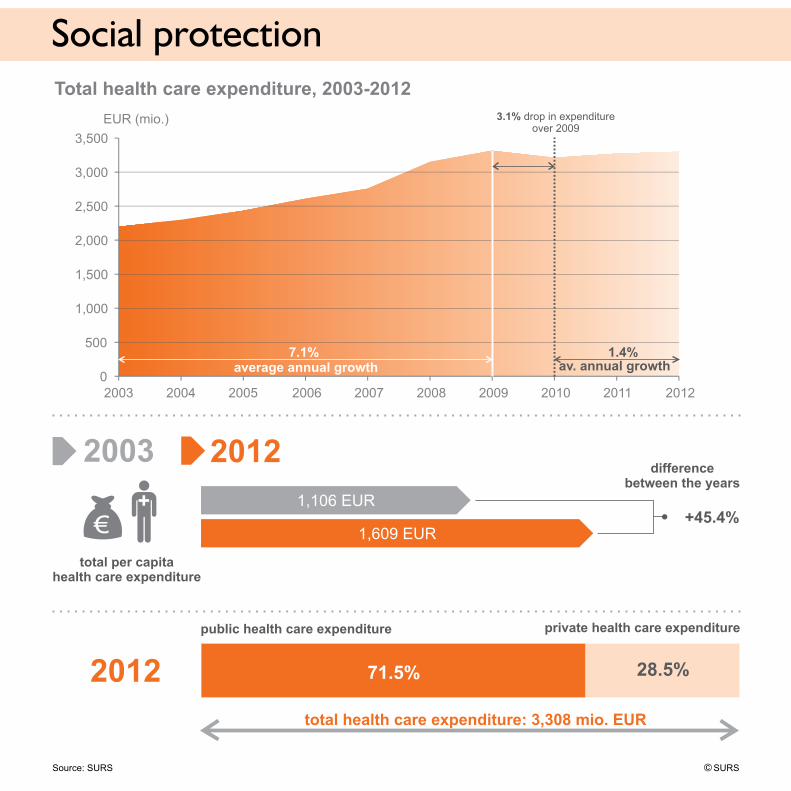
In 2012,
1% less was spent on social protection schemes than in 2011 (EUR 8,967 million), primarily due to changes in the legislation governing pensions and social protection.
The highest share of expenditure onsocial protection schemes was that of cash benefits, particularly pensions, i.e.two thirds (66.9%).
In 2012,
total health expenditure amounted to EUR 3,308 million,of which 28.5% from private sources.
Between 2003 and 2012 social protection expenditure and health expenditure each increased by a third.
About half of social protection expenditure is for pensions,while as regards health expenditure about half is for curative care.
2011 (mio. EUR)
2012 (mio. EUR)
Expenditure of social protection schemes 9,052 8,967
social benefits 8,884 8,800
in cash 6,021 5,889
in kind 2,862 2,911
administration costs 145 144
other 24 23
Health care expenditure 3,281 3,308
government sector 2,412 2,365
private sector 870 944
Source: SURS
Expenditure on social benefits and health care
Source: SURS
32 STAT'O'BOOK / PEOPLE AND SOCIETY
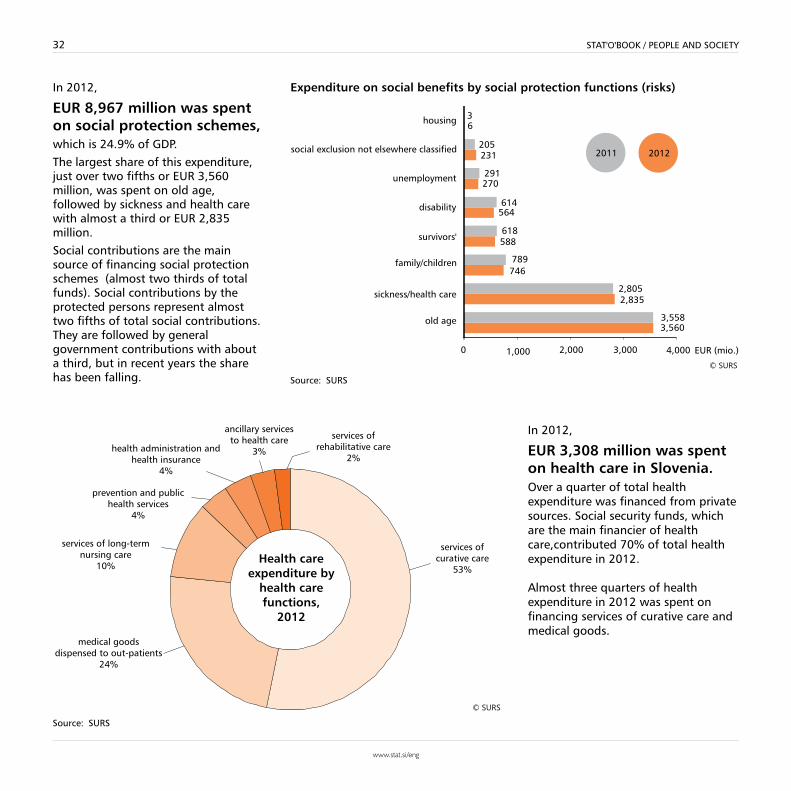
In 2012,
EUR 8,967 million was spent on social protection schemes, which is 24.9% of GDP.The largest share of this expenditure, just over two fifths or EUR 3,560 million, was spent on old age, followed by sickness and health care with almost a third or EUR 2,835 million.Social contributions are the main source of financing social protection schemes (almost two thirds of total funds). Social contributions by the protected persons represent almost two fifths of total social contributions. They are followed by general government contributions with about a third, but in recent years the share has been falling.
In 2012,
EUR 3,308 million was spent on health care in Slovenia.Over a quarter of total health expenditure was financed from private sources. Social security funds, which are the main financier of health care,contributed 70% of total health expenditure in 2012.
Almost three quarters of health expenditure in 2012 was spent on financing services of curative care and medical goods.
Expenditure on social benefits by social protection functions (risks)
Source: SURS
Source: SURS
33STAT'O'BOOK / PEOPLE AND SOCIETY
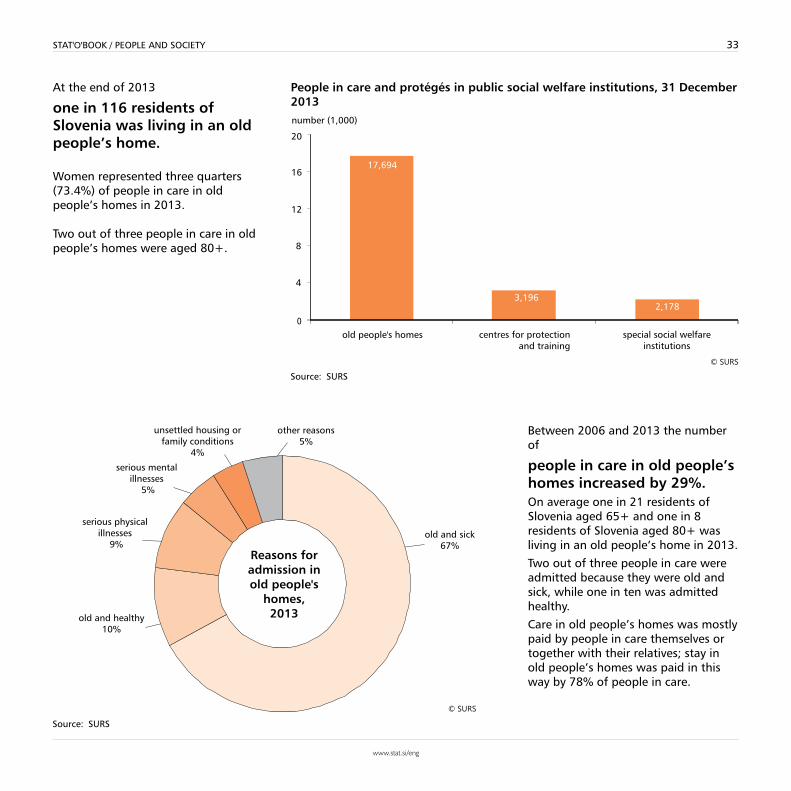
At the end of 2013
one in 116 residents of Slovenia was living in an old people’s home.
Women represented three quarters (73.4%) of people in care in old people’s homes in 2013.
Two out of three people in care in old people’s homes were aged 80+.
Between 2006 and 2013 the number of
people in care in old people’s homes increased by 29%.On average one in 21 residents of Slovenia aged 65+ and one in 8 residents of Slovenia aged 80+ was living in an old people’s home in 2013.
Two out of three people in care wereadmitted because they were old and sick, while one in ten was admitted healthy.
Care in old people’s homes was mostly paid by people in care themselves or together with their relatives; stay in old people’s homes was paid in this way by 78% of people in care.
People in care and protégés in public social welfare institutions, 31 December 2013
Source: SURS
Source: SURS

35STAT'O'BOOK / PEOPLE AND SOCIETY
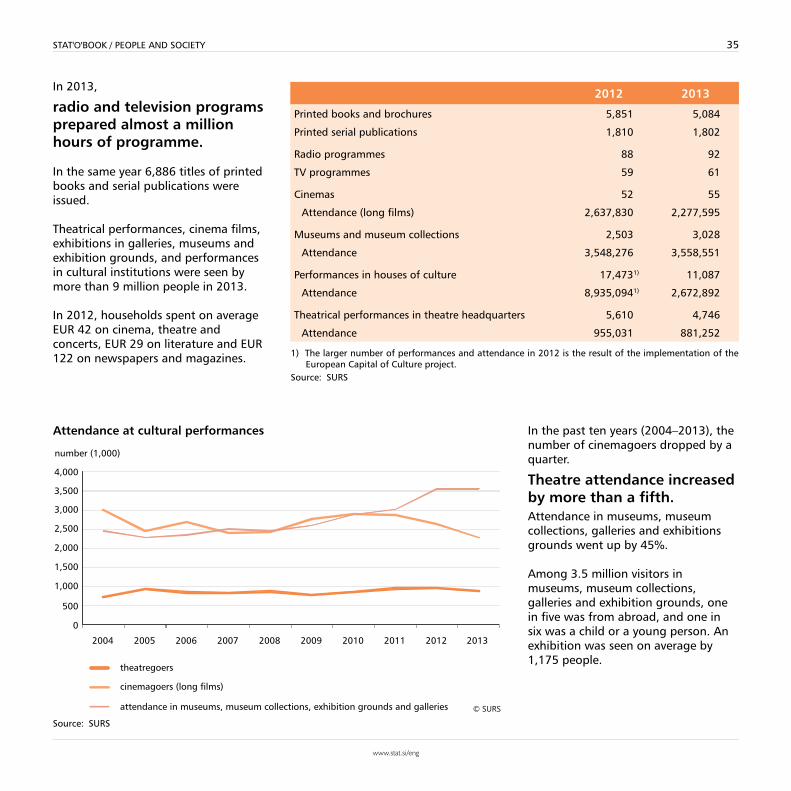
In 2013,
radio and television programs prepared almost a million hours of programme.
In the same year 6,886 titles of printed books and serial publications were issued.
Theatrical performances, cinema films, exhibitions in galleries, museums and exhibition grounds, and performances in cultural institutions were seen by more than 9 million people in 2013.
In 2012, households spent on average EUR 42 on cinema, theatre and concerts, EUR 29 on literature and EUR 122 on newspapers and magazines.
In the past ten years (2004–2013), the number of cinemagoers dropped by a quarter.
Theatre attendance increased by more than a fifth. Attendance in museums, museum collections, galleries and exhibitions grounds went up by 45%.
Among 3.5 million visitors in museums, museum collections, galleries and exhibition grounds, one in five was from abroad, and one in six was a child or a young person. An exhibition was seen on average by 1,175 people.
Attendance at cultural performances
Source: SURS
2012 2013
Printed books and brochures 5,851 5,084
Printed serial publications 1,810 1,802
Radio programmes 88 92
TV programmes 59 61
Cinemas 52 55
Attendance (long films) 2,637,830 2,277,595
Museums and museum collections 2,503 3,028
Attendance 3,548,276 3,558,551
Performances in houses of culture 17,4731) 11,087
Attendance 8,935,0941) 2,672,892
Theatrical performances in theatre headquarters 5,610 4,746
Attendance 955,031 881,252
1) The larger number of performances and attendance in 2012 is the result of the implementation of the European Capital of Culture project.
Source: SURS
36 STAT'O'BOOK / PEOPLE AND SOCIETY
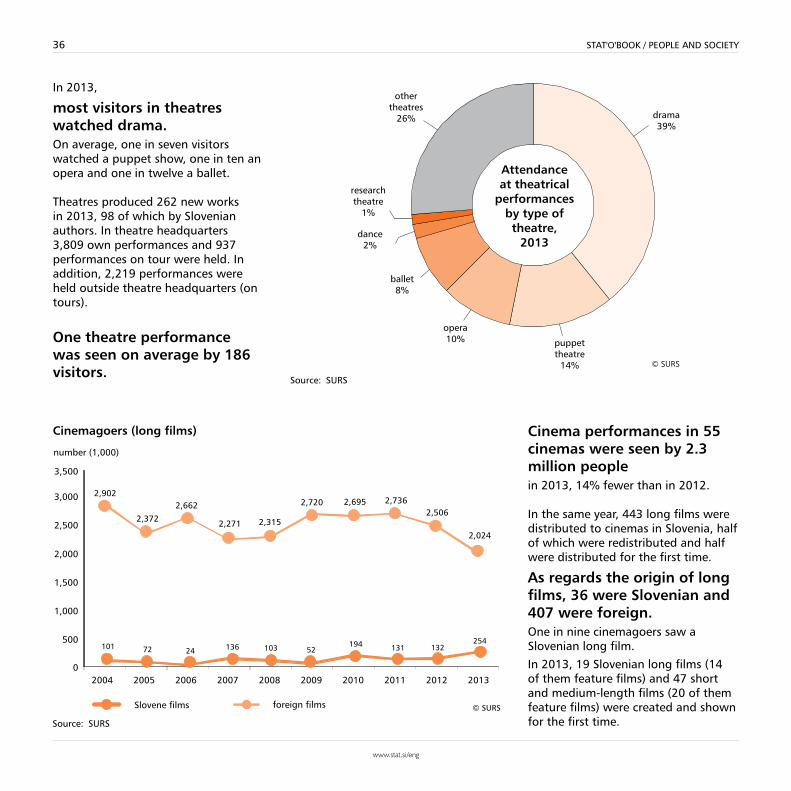
In 2013,
most visitors in theatres watched drama. On average, one in seven visitors watched a puppet show, one in ten an opera and one in twelve a ballet.
Theatres produced 262 new works in 2013, 98 of which by Slovenian authors. In theatre headquarters 3,809 own performances and 937 performances on tour were held. In addition, 2,219 performances were held outside theatre headquarters (on tours).
One theatre performance was seen on average by 186 visitors.
Cinema performances in 55 cinemas were seen by 2.3 million people in 2013, 14% fewer than in 2012.
In the same year, 443 long films were distributed to cinemas in Slovenia, half of which were redistributed and half were distributed for the first time.
As regards the origin of long films, 36 were Slovenian and 407 were foreign. One in nine cinemagoers saw a Slovenian long film.
In 2013, 19 Slovenian long films (14 of them feature films) and 47 short and medium-length films (20 of them feature films) were created and shown for the first time.
Source: SURS
Cinemagoers (long films)
Source: SURS
37STAT'O'BOOK / PEOPLE AND SOCIETY
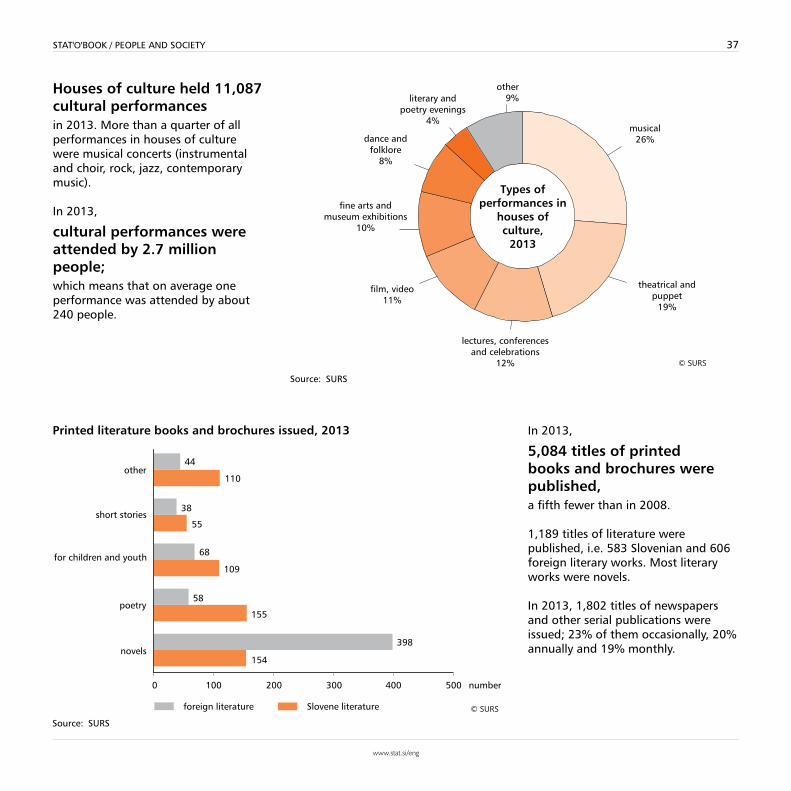
Houses of culture held 11,087 cultural performances in 2013. More than a quarter of all performances in houses of culture were musical concerts (instrumental and choir, rock, jazz, contemporary music).
In 2013,
cultural performances were attended by 2.7 million people; which means that on average one performance was attended by about 240 people.
In 2013,
5,084 titles of printed books and brochures were published, a fifth fewer than in 2008.
1,189 titles of literature were published, i.e. 583 Slovenian and 606 foreign literary works. Most literary works were novels.
In 2013, 1,802 titles of newspapers and other serial publications were issued; 23% of them occasionally, 20% annually and 19% monthly.
Source: SURS
Printed literature books and brochures issued, 2013
Source: SURS

39STAT'O'BOOK / ENVIRONMENT AND NATURAL RESOURCES
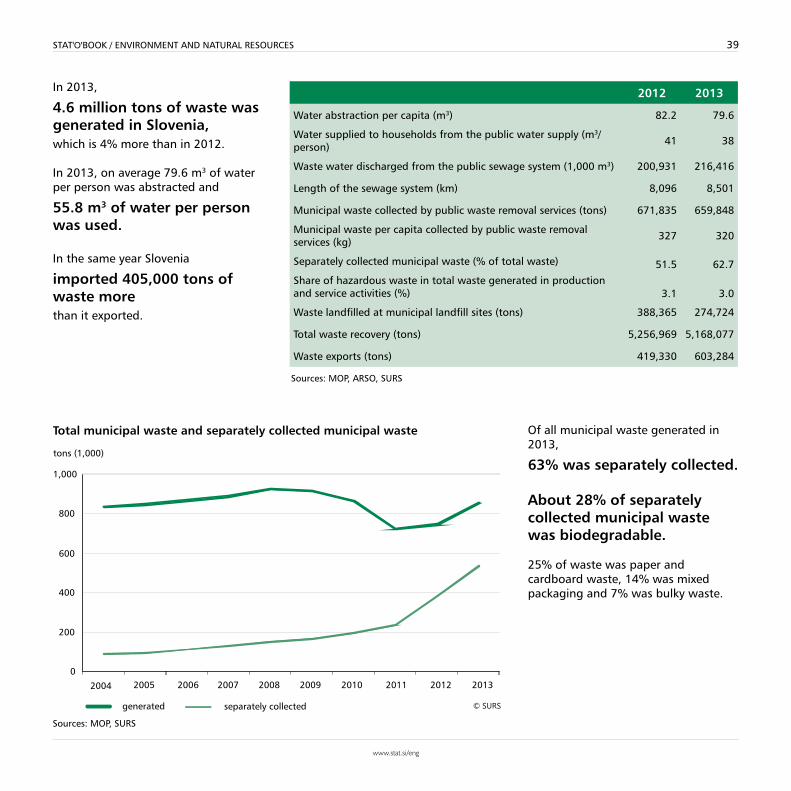
In 2013,
4.6 million tons of waste was generated in Slovenia, which is 4% more than in 2012.
In 2013, on average 79.6 m3 of water per person was abstracted and
55.8 m3 of water per person was used.
In the same year Slovenia
imported 405,000 tons of waste more than it exported.
2012 2013
Water abstraction per capita (m3) 82.2 79.6
Water supplied to households from the public water supply (m3/person) 41 38
Waste water discharged from the public sewage system (1,000 m3) 200,931 216,416
Length of the sewage system (km) 8,096 8,501
Municipal waste collected by public waste removal services (tons) 671,835 659,848
Municipal waste per capita collected by public waste removal services (kg) 327 320
Separately collected municipal waste (% of total waste) 51.5 62.7Share of hazardous waste in total waste generated in production and service activities (%) 3.1 3.0
Waste landfilled at municipal landfill sites (tons) 388,365 274,724
Total waste recovery (tons) 5,256,969 5,168,077
Waste exports (tons) 419,330 603,284
Sources: MOP, ARSO, SURS
Of all municipal waste generated in 2013,
63% was separately collected.
About 28% of separately collected municipal waste was biodegradable.
25% of waste was paper and cardboard waste, 14% was mixed packaging and 7% was bulky waste.
Total municipal waste and separately collected municipal waste
Sources: MOP, SURS
40 STAT'O'BOOK / ENVIRONMENT AND NATURAL RESOURCES
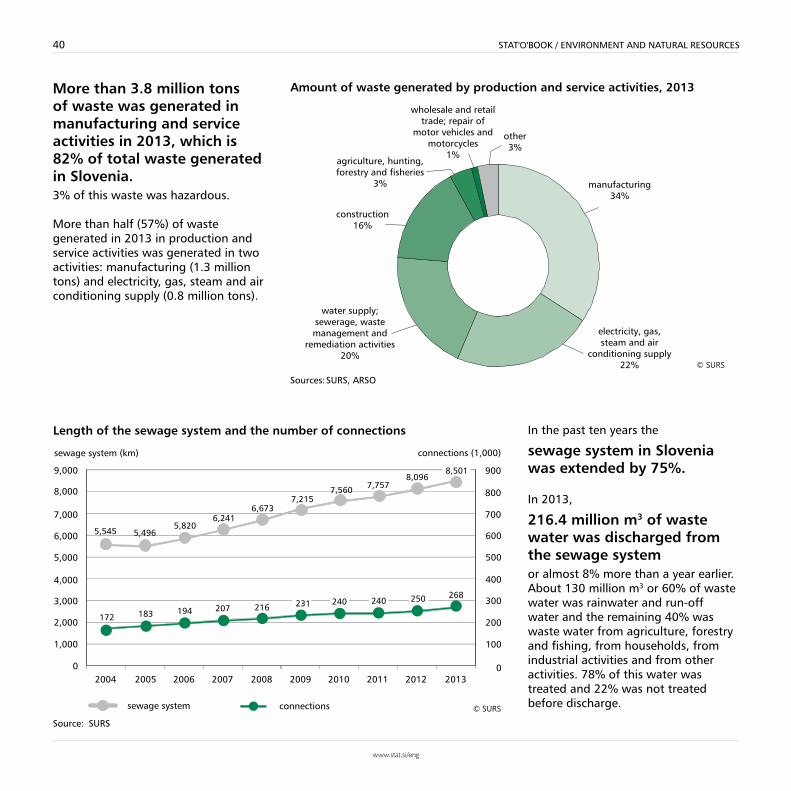
More than 3.8 million tons of waste was generated in manufacturing and service activities in 2013, which is 82% of total waste generated in Slovenia. 3% of this waste was hazardous.
More than half (57%) of waste generated in 2013 in production and service activities was generated in two activities: manufacturing (1.3 million tons) and electricity, gas, steam and air conditioning supply (0.8 million tons).
In the past ten years the
sewage system in Slovenia was extended by 75%.
In 2013,
216.4 million m3 of waste water was discharged from the sewage system or almost 8% more than a year earlier. About 130 million m3 or 60% of waste water was rainwater and run-off water and the remaining 40% was waste water from agriculture, forestry and fishing, from households, from industrial activities and from other activities. 78% of this water was treated and 22% was not treated before discharge.
Amount of waste generated by production and service activities, 2013
Sources: SURS, ARSO
Length of the sewage system and the number of connections
Source: SURS
41STAT'O'BOOK / ENVIRONMENT AND NATURAL RESOURCES
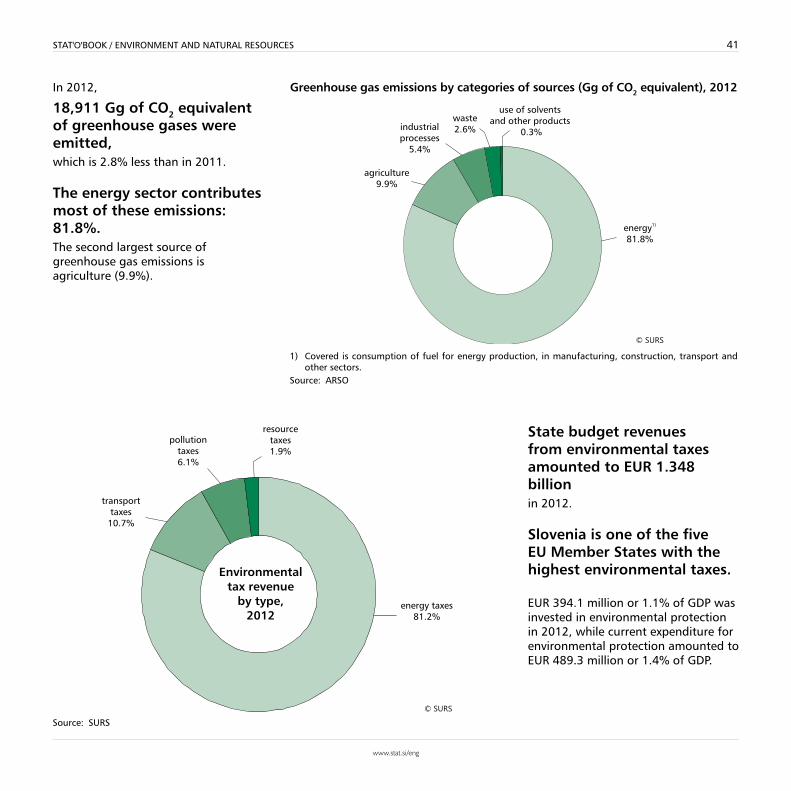
In 2012,
18,911 Gg of CO2 equivalent of greenhouse gases were emitted,which is 2.8% less than in 2011.
The energy sector contributes most of these emissions: 81.8%. The second largest source of greenhouse gas emissions is agriculture (9.9%).
State budget revenues from environmental taxes amounted to EUR 1.348 billionin 2012.
Slovenia is one of the five EU Member States with the highest environmental taxes.
EUR 394.1 million or 1.1% of GDP was invested in environmental protection in 2012, while current expenditure for environmental protection amounted to EUR 489.3 million or 1.4% of GDP.
Greenhouse gas emissions by categories of sources (Gg of CO2 equivalent), 2012
1) Covered is consumption of fuel for energy production, in manufacturing, construction, transport and other sectors.
Source: ARSO
Source: SURS


43STAT'O'BOOK / ENVIRONMENT AND NATURAL RESOURCES
In 2013, the indigenous production of
pig meat declined the most (by almost 20%), and of poultry meat the least (by 4%).
In the same year
almost 30% less wheat was producedthan in the previous year, partly because of smaller area sown (by 9%) and partly because of drought and subsequent lower yield per hectare (by 20%). Due to drought, the yield of other crops (potato, silage maize) was also lower as was the production of bovine meat and milk production.
Between 2000 and 2013
the number of agricultural holdings decreased by 16% to 72,377.
The number of annual work units (AWU) in agriculture declined by almost 30% between 2000 and 2010 and then increased by 7%, so that
total labour input in agriculture in 2013 was 82,746 AWU.
Annual work units (AWU) is the ratio between the number of hours spent in one year working in agriculture and one person in full-time employment in agriculture in one year (1,800 hours), which is used by national labour force statistics.
2012 2013
Net production of cow’s milk (1,000 l) 602,857 578,152
Indigenous production of bovine meat (1,000 t) 43 41
Indigenous production of pig meat (1,000 t) 36 29
Indigenous production of poultry meat (1,000 t) 62 60
Production of silage maize (1,000 t) 1,057 890
Production of wheat and spelt (1,000 t) 188 138
Production of potato (1,000 t) 79 62
Aquaculture (1,000 kg) 1,155 1,234
Marine fishing (1,000 kg) 329 238
Growing stock (1,000 m3) 337,817 342,409
Sources: SURS, ZGS, MKGP
Agricultural holdings and annual work units
Source: SURS

44 STAT'O'BOOK / ENVIRONMENT AND NATURAL RESOURCES
In 2013,
there were 477,023 hectares of utilised agricultural areaor 23.5% of the territory of Slovenia.
More than half (276,000 ha) of this area was permanent grassland and just over a third (almost 174,000 ha) was arable land. The remaining almost 6% (almost 27,000 ha) were permanent crops (vineyards, orchards and olive groves).
In 2013,
80% of agricultural holdings in Slovenia were engaged in livestock production. They mostly bred cattle (311,564 LSU) and pigs (33,213 LSU).
Between 2010 and 2013 the number of all livestock, except poultry, declined; the number of pigs (LSU) declined the most (by 25%).
Livestock unit (LSU) is a standard measurement unit that allows the aggregation of the various categories of livestock in order to be able to compare the data for individual years. One LSU is 500 kg of live weight of an animal.
Source: SURS
Source: SURS
45STAT'O'BOOK / ENVIRONMENT AND NATURAL RESOURCES
Annual gross increment and removals
Source: ZGS
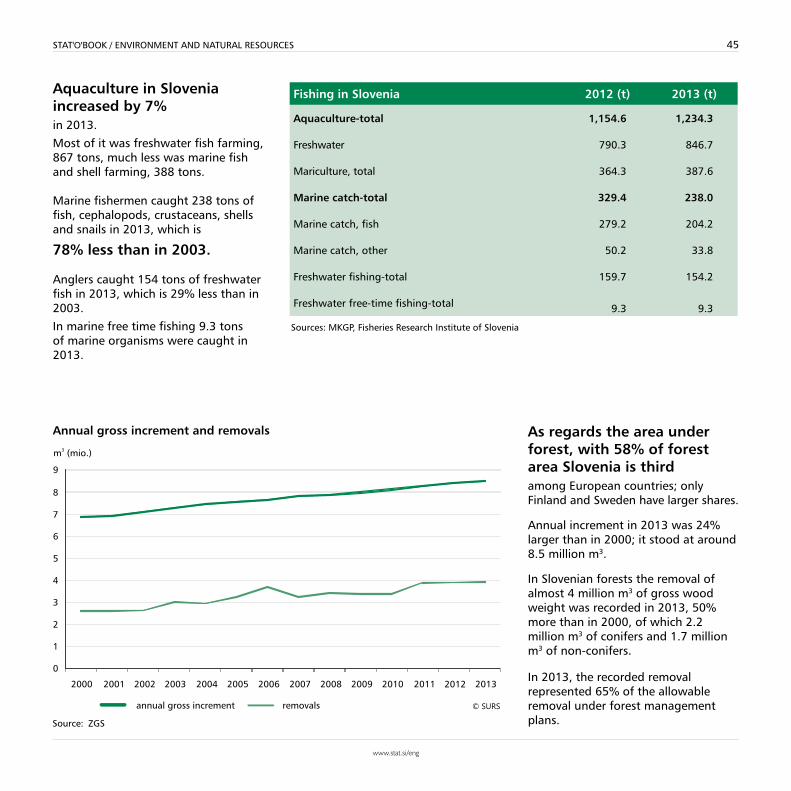
Aquaculture in Slovenia increased by 7% in 2013.
Most of it was freshwater fish farming, 867 tons, much less was marine fish and shell farming, 388 tons.
Marine fishermen caught 238 tons of fish, cephalopods, crustaceans, shells and snails in 2013, which is
78% less than in 2003.
Anglers caught 154 tons of freshwater fish in 2013, which is 29% less than in 2003.
In marine free time fishing 9.3 tons of marine organisms were caught in 2013.
As regards the area under forest, with 58% of forest area Slovenia is third among European countries; only Finland and Sweden have larger shares.
Annual increment in 2013 was 24% larger than in 2000; it stood at around 8.5 million m3.
In Slovenian forests the removal of almost 4 million m3 of gross wood weight was recorded in 2013, 50% more than in 2000, of which 2.2 million m3 of conifers and 1.7 million m3 of non-conifers.
In 2013, the recorded removal represented 65% of the allowable removal under forest management plans.
Fishing in Slovenia 2012 (t) 2013 (t)
Aquaculture-total 1,154.6 1,234.3
Freshwater 790.3 846.7
Mariculture, total 364.3 387.6
Marine catch-total 329.4 238.0
Marine catch, fish 279.2 204.2
Marine catch, other 50.2 33.8
Freshwater fishing-total 159.7 154.2
Freshwater free-time fishing-total 9.3 9.3
Sources: MKGP, Fisheries Research Institute of Slovenia


47STAT'O'BOOK / ENVIRONMENT AND NATURAL RESOURCES
In 2013, the
energy dependency of Slovenia was 47%. This was the lowest energy dependency rate in the past 14 years.
In 2013, per capita electricity consumption was 6,167 kWh, which means that each of us consumed on average
17 kWh of electricity per day.
Renewable energy sources are: hydro energy, geothermal energy, solar and wind energy, biomass, biogas, biofuels and industrial and municipal waste.
In 2013,
Slovenia met 22% of its energy needs from renewable energy sources. In the past nine years the share of renewables increased by 5 percentage points. The target that Slovenia should achieve by 2020 is 25% of energy from renewable sources in gross final energy consumption.
The share of renewable sources increased the most in heating and cooling; by 13 percentage points from 2004 to 32% in 2013. In 2013, almost a third of electricity in Slovenia was produced from renewable sources.
2012 2013
Indigenous production (1,000 toe) 3,550 3,564
Energy supply (1,000 toe) 6,982 6,797
Final consumption (1,000 toe) 4,953 4,851
Energy dependency (%) 50.9 46.9
Energy supply per capita (toe/capita) 3.4 3.3
Electricity consumption per capita (kWh/capita) 6,160 6,167
Source: SURS
Shares of energy from renewable sources in final gross energy consumption
Source: SURS

48 STAT'O'BOOK / ENVIRONMENT AND NATURAL RESOURCES
Among energy sources used for space heating in 2013
the highest share was that of wood fuel (52%), followed by light fuel oil (17%) and natural gas (13%).
As regards energy products for space heating, in the past four years the consumption of geothermal energy went up the most.
The share of solar energy in total energy sources used for heating was only 0.24%.
In mid-2014
100 kWh of electricity cost EUR 16,EUR 5 more than in mid-2008.
In this period the price of natural gas went up by 20%. In mid-2014
a standard cubic metre of natural gas cost EUR 0.71. Light fuel oil and district heat also became more expensive. In 2014,
1,000 litres of light fuel oil cost EUR 1,032 or EUR 75 more than six years ago. People using district heat paid in January 2014 EUR 59.38 per 1 MWh or EUR 16.11 more than in January 2008.
Energy sources-total 29,524
Firewood 15,487
Extra light heating oil 5,123
Natural gas 3,766
District heat 2,796
Electricity 1,348
Liquefied petroleum gas 475
Geothermal energy 446
Solar energy 71
Coal 11
Source: SURS, calculation by IJS-CEU
Household energy consumption for space heating (TJ), 2013
Energy prices for households
Source: SURS
49STAT'O'BOOK / ENVIRONMENT AND NATURAL RESOURCES
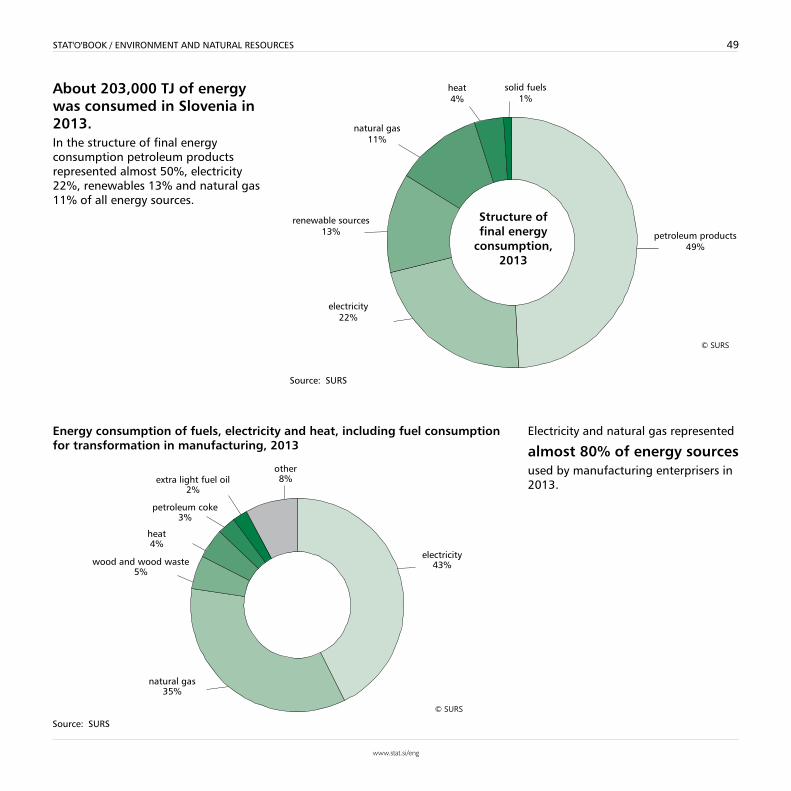
About 203,000 TJ of energy was consumed in Slovenia in 2013. In the structure of final energy consumption petroleum products represented almost 50%, electricity 22%, renewables 13% and natural gas 11% of all energy sources.
Electricity and natural gas represented
almost 80% of energy sourcesused by manufacturing enterprisers in 2013.
Source: SURS
Energy consumption of fuels, electricity and heat, including fuel consumption for transformation in manufacturing, 2013
Source: SURS

51STAT'O'BOOK / ECONOMY AND FINANCE
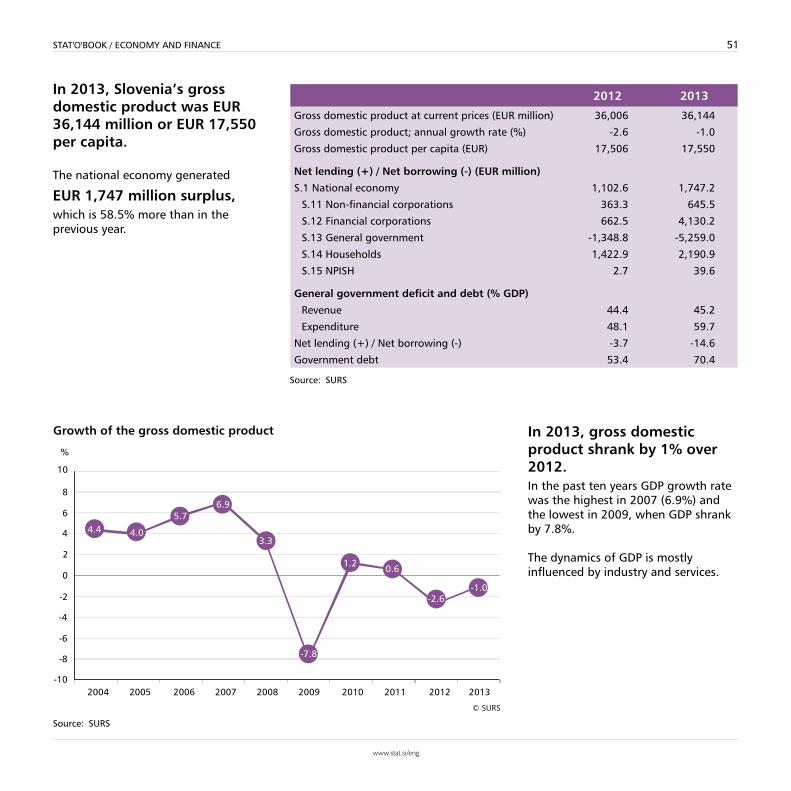
In 2013, Slovenia’s gross domestic product was EUR 36,144 million or EUR 17,550 per capita.
The national economy generated
EUR 1,747 million surplus, which is 58.5% more than in the previous year.
In 2013, gross domestic product shrank by 1% over 2012. In the past ten years GDP growth rate was the highest in 2007 (6.9%) and the lowest in 2009, when GDP shrank by 7.8%.
The dynamics of GDP is mostly influenced by industry and services.
2012 2013
Gross domestic product at current prices (EUR million) 36,006 36,144
Gross domestic product; annual growth rate (%) -2.6 -1.0
Gross domestic product per capita (EUR) 17,506 17,550
Net lending (+) / Net borrowing (-) (EUR million)
S.1 National economy 1,102.6 1,747.2
S.11 Non-financial corporations 363.3 645.5
S.12 Financial corporations 662.5 4,130.2
S.13 General government -1,348.8 -5,259.0
S.14 Households 1,422.9 2,190.9
S.15 NPISH 2.7 39.6
General government deficit and debt (% GDP)
Revenue 44.4 45.2
Expenditure 48.1 59.7
Net lending (+) / Net borrowing (-) -3.7 -14.6
Government debt 53.4 70.4
Source: SURS
Growth of the gross domestic product
Source: SURS

52 STAT'O'BOOK / ECONOMY AND FINANCE
The highest household final consumption expenditure in 2013 was for housing, followed by transport, and food and non-alcoholic beverages.
Between 2007 and 2013 the share of expenditure on recreation and culture declined the most (by 2 percentage points), while the share of expenditure on housing, water and energy went up the most (by 1.2 percentage points).
In the 2007–2013 period the share of household expenditure on non-durable goods increased by 5.8 percentage points.On the other hand, the shares of household expenditure on durable goods declined by 3.5 percentage points, on semi-durable goods by 1.0 percentage point and on services by 1.3 percentage points. We think that in the uncertain situation households postponed buying durable and semi-durable goods that are not absolutely necessary.
Household final consumption expenditure, 2013
Source: SURS
Expenditure on goods (by durability) and services in final household consumption
Source: SURS
53STAT'O'BOOK / ECONOMY AND FINANCE
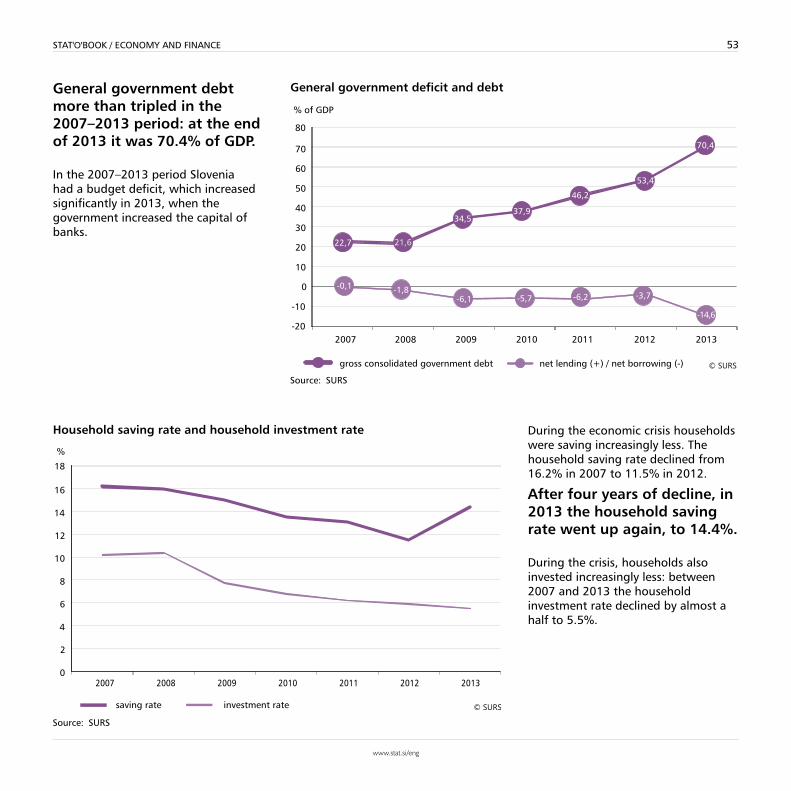
General government debt more than tripled in the 2007–2013 period: at the end of 2013 it was 70.4% of GDP.
In the 2007–2013 period Slovenia had a budget deficit, which increased significantly in 2013, when the government increased the capital of banks.
During the economic crisis households were saving increasingly less. The household saving rate declined from 16.2% in 2007 to 11.5% in 2012.
After four years of decline, in 2013 the household saving rate went up again, to 14.4%.
During the crisis, households also invested increasingly less: between 2007 and 2013 the household investment rate declined by almost a half to 5.5%.
General government deficit and debt
Source: SURS
Household saving rate and household investment rate
Source: SURS

55STAT'O'BOOK / ECONOMY AND FINANCE
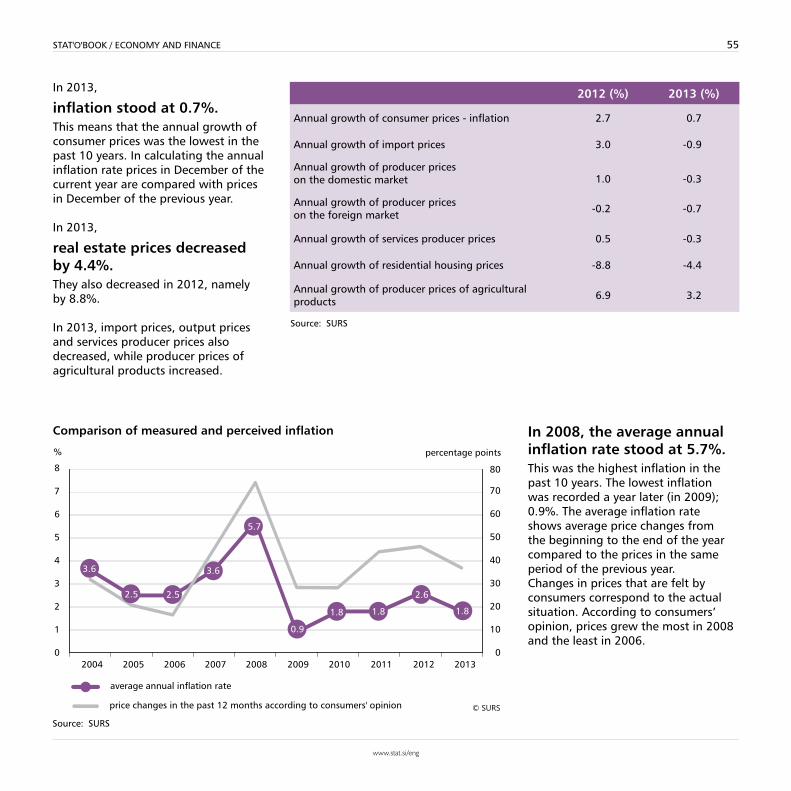
In 2013,
inflation stood at 0.7%.This means that the annual growth of consumer prices was the lowest in the past 10 years. In calculating the annual inflation rate prices in December of the current year are compared with prices in December of the previous year.
In 2013,
real estate prices decreased by 4.4%.They also decreased in 2012, namely by 8.8%.
In 2013, import prices, output prices and services producer prices also decreased, while producer prices of agricultural products increased.
In 2008, the average annual inflation rate stood at 5.7%.This was the highest inflation in the past 10 years. The lowest inflation was recorded a year later (in 2009); 0.9%. The average inflation rate shows average price changes from the beginning to the end of the year compared to the prices in the same period of the previous year. Changes in prices that are felt by consumers correspond to the actual situation. According to consumers’ opinion, prices grew the most in 2008 and the least in 2006.
2012 (%) 2013 (%)
Annual growth of consumer prices - inflation 2.7 0.7
Annual growth of import prices 3.0 -0.9
Annual growth of producer prices on the domestic market 1.0 -0.3
Annual growth of producer prices on the foreign market -0.2 -0.7
Annual growth of services producer prices 0.5 -0.3
Annual growth of residential housing prices -8.8 -4.4
Annual growth of producer prices of agricultural products 6.9 3.2
Source: SURS
Comparison of measured and perceived inflation
Source: SURS

56 STAT'O'BOOK / ECONOMY AND FINANCE
In 2013, a kilogram of white bread cost on average 2 cents more than in 2012. In the same year, the price of a kilogram of dessert apples went up on average by 27 cents and of a litre of edible oil by a cent. The price of salt went down by a cent.
Average price of a monthly train ticket did not change compared to 2012. On the other hand, the price of a cinema ticket went up by 23 cents.
In restaurants and similar establishments the price of a classical pizza went up on average by 15 cents and the price of a cup of coffee by a cent.
In 2013,
consumer prices in the EU were on average 1% higher than in 2012; in Slovenia they went up by 0.9%. Among Member States, the prices went up the most in Estonia, Austria and the UK (on average by 2%) and down the most in Greece (-1.8%), Cyprus (-1.3%) and Bulgaria (-0.9%). Price growth in the international environment is measured with the harmonised index of consumer prices (HICP), which is used for comparing inflation rates between countries and groups of countries that calculate it. The index is an economic indicator that measures changes in prices of goods and services bought by households for final consumption.
Average retail prices of some productsPrices 2012 (EUR)
Prices 2013 (EUR)
Growth rate (%)
White bread (kg) 1.83 1.85 1.1
Edible oil (l) 2.02 2.03 0.5
Table salt (kg) 0.4 0.39 –2.5
Dessert apples (kg) 1.15 1.42 23.5
Cough syrup, 150-200 ml (bottle) 7.16 7.31 2.1
Passenger transport by train (50 km), second class (monthly pass) 129.28 129.28 0.0
Cinema ticket, normal length, evening 5.12 5.35 4.5
Pizza (classical), large 6.39 6.54 2.3
Cup of coffee in a café 1.15 1.16 0.9
Source: SURS
Annual price growth according to the HICP, EU-28, December 2013
Source: Eurostat, 15. 10. 2014
in %
-0.1 or less
0.0 - 0.4
0.5 - 0.9
1.0 - 1.4
1.5 or moreSURS
57STAT'O'BOOK / ECONOMY AND FINANCE
EUR 1,946 per m2 of useful floor space was the average price of a newly built flat in 2013.
EUR 1,486 per m2
of useful floor space was the average price of an existing flat in 2013.
EUR 1,205 per m2
of useful floor space was the average price of an existing family house with land in 2013.
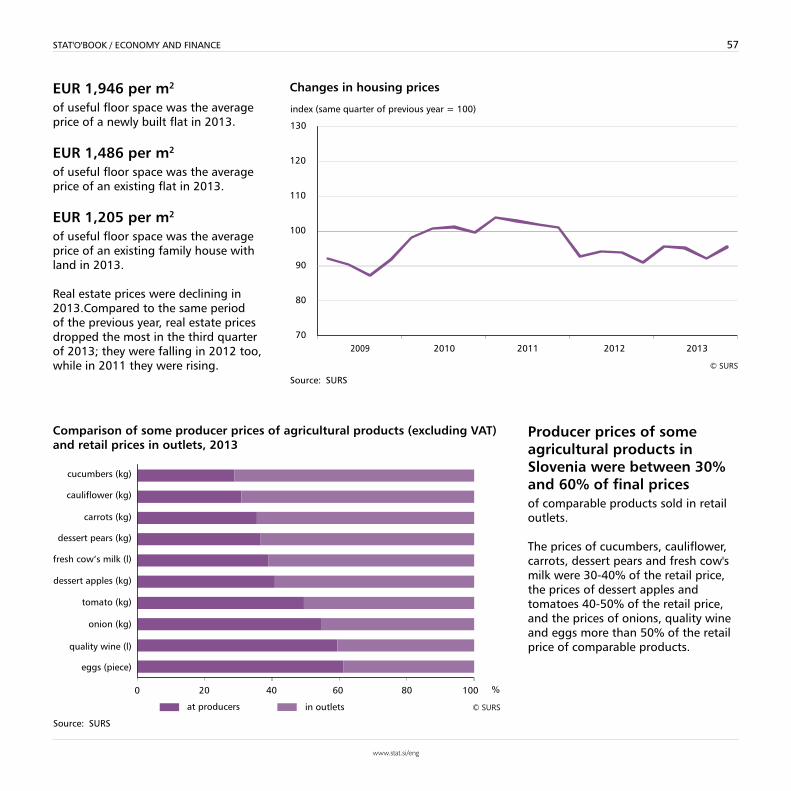
Real estate prices were declining in 2013.Compared to the same period of the previous year, real estate prices dropped the most in the third quarter of 2013; they were falling in 2012 too, while in 2011 they were rising.
Producer prices of some agricultural products in Slovenia were between 30% and 60% of final prices of comparable products sold in retail outlets.
The prices of cucumbers, cauliflower, carrots, dessert pears and fresh cow's milk were 30-40% of the retail price, the prices of dessert apples and tomatoes 40-50% of the retail price, and the prices of onions, quality wine and eggs more than 50% of the retail price of comparable products.
Changes in housing prices
Source: SURS
Comparison of some producer prices of agricultural products (excluding VAT) and retail prices in outlets, 2013
Source: SURS


59STAT'O'BOOK / ECONOMY AND FINANCE
In 2013, Slovenia
exported EUR 21.5 billion of goods. Compared to 2012, this was 2.3% more.
In 2013, Slovenia
imported EUR 22.1 billion of goods.Compared to 2012, this was 0.2% more.
In the past three years exports and imports have been about the same. The value of exports in 2013 was 7.5% higher than in 2008; in the same comparison the value of imports was 4.0% lower. Between 2004 and 2013 the values of exports and imports decreased the most over the previous year in 2009: exports by 19% and imports by 25%.
In 2013,
the trade balance was the lowest in the past 10 years. The difference between exports and imports was the largest in 2008, when the value of imports was EUR 3 billion higher than the value of exports.
2012 2013
Exports (EUR million) 21,061 21,549
Imports (EUR million) 22,078 22,114
Trade balance (EUR million) -1,017 -565
Exports as % of imports 95 97
Source: SURS
Exports and imports of goods
Source: SURS
60 STAT'O'BOOK / ECONOMY AND FINANCE
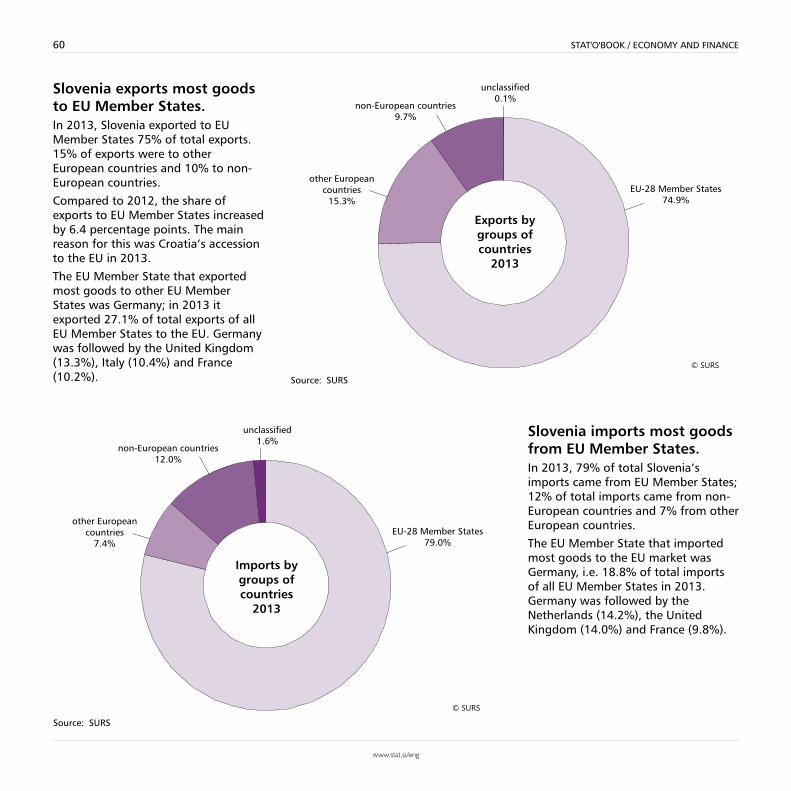
Slovenia exports most goods to EU Member States. In 2013, Slovenia exported to EU Member States 75% of total exports. 15% of exports were to other European countries and 10% to non-European countries.
Compared to 2012, the share of exports to EU Member States increased by 6.4 percentage points. The main reason for this was Croatia’s accession to the EU in 2013.
The EU Member State that exported most goods to other EU Member States was Germany; in 2013 it exported 27.1% of total exports of all EU Member States to the EU. Germany was followed by the United Kingdom (13.3%), Italy (10.4%) and France (10.2%).
Slovenia imports most goods from EU Member States. In 2013, 79% of total Slovenia’s imports came from EU Member States; 12% of total imports came from non-European countries and 7% from other European countries.
The EU Member State that imported most goods to the EU market was Germany, i.e. 18.8% of total imports of all EU Member States in 2013. Germany was followed by the Netherlands (14.2%), the United Kingdom (14.0%) and France (9.8%).
Source: SURS
Source: SURS
61STAT'O'BOOK / ECONOMY AND FINANCE
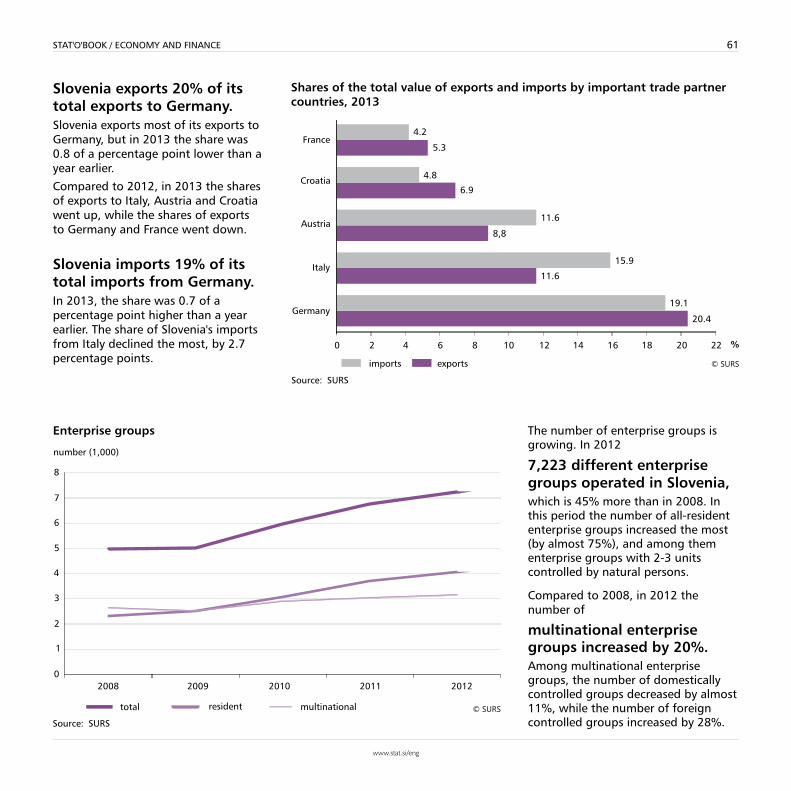
Slovenia exports 20% of its total exports to Germany.Slovenia exports most of its exports to Germany, but in 2013 the share was 0.8 of a percentage point lower than a year earlier.
Compared to 2012, in 2013 the shares of exports to Italy, Austria and Croatia went up, while the shares of exports to Germany and France went down.
Slovenia imports 19% of its total imports from Germany.In 2013, the share was 0.7 of a percentage point higher than a year earlier. The share of Slovenia's imports from Italy declined the most, by 2.7 percentage points.
The number of enterprise groups is growing. In 2012
7,223 different enterprise groups operated in Slovenia,which is 45% more than in 2008. In this period the number of all-resident enterprise groups increased the most (by almost 75%), and among them enterprise groups with 2-3 units controlled by natural persons.
Compared to 2008, in 2012 the number of
multinational enterprise groups increased by 20%. Among multinational enterprise groups, the number of domestically controlled groups decreased by almost 11%, while the number of foreign controlled groups increased by 28%.
Shares of the total value of exports and imports by important trade partner countries, 2013
Source: SURS
Enterprise groups
Source: SURS
63STAT'O'BOOK / MANUFACTURING AND SERVICES
Source: SURS
2012 2013
Number of completed buildings 4,160 3,662
Useful floor space of completed buildings (m2) 1,791,059 1,409,238
Number of completed dwellings 4,307 3,484
Useful floor space of completed dwellings (m2) 596,388 507,928
Number of building permits 3,205 3,443
Number of dwellings planned 3,095 3,112
Value of construction put in place on buildings (EUR) 837,371,991 723,654,573
Value of construction put in place on civil engineering (EUR) 913,165,854 957,316,683
Buildings for which building permits were issued and planned dwellings
Source: SURS
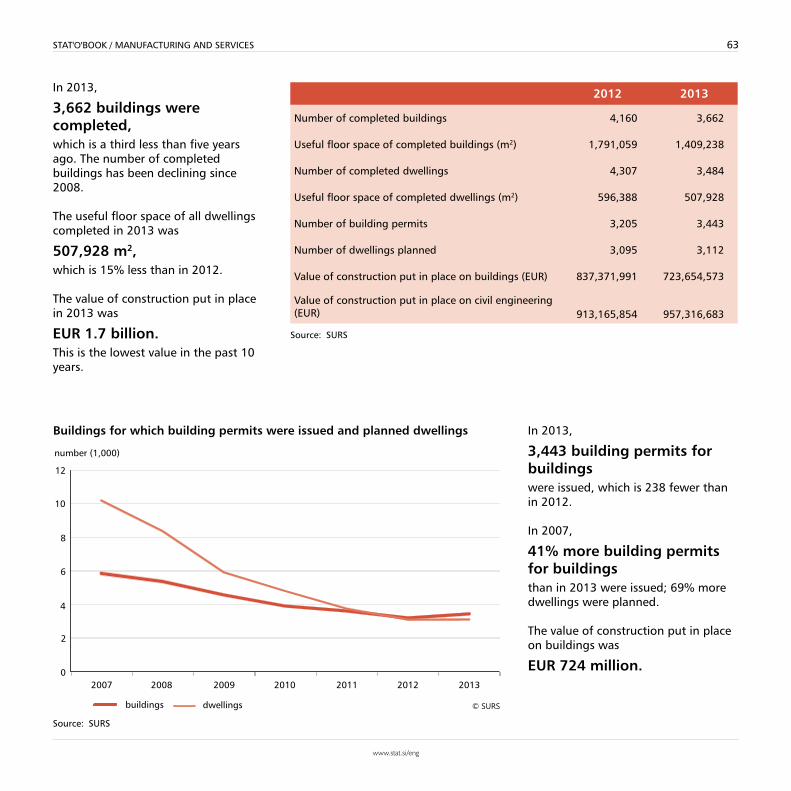
In 2013,
3,662 buildings were completed, which is a third less than five years ago. The number of completed buildings has been declining since 2008.
The useful floor space of all dwellings completed in 2013 was
507,928 m2, which is 15% less than in 2012.
The value of construction put in place in 2013 was
EUR 1.7 billion. This is the lowest value in the past 10 years.
In 2013,
3,443 building permits for buildings were issued, which is 238 fewer than in 2012.
In 2007,
41% more building permits for buildings than in 2013 were issued; 69% more dwellings were planned.
The value of construction put in place on buildings was
EUR 724 million.
STAT'O'BOOK / MANUFACTURING AND SERVICES64
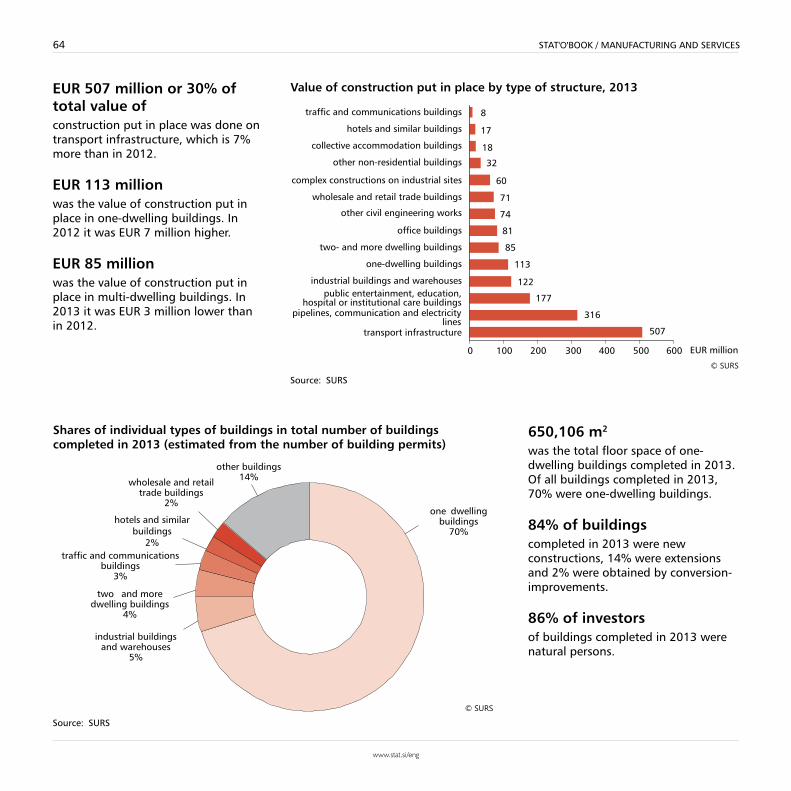
Value of construction put in place by type of structure, 2013
Source: SURS
Shares of individual types of buildings in total number of buildings completed in 2013 (estimated from the number of building permits)
Source: SURS
EUR 507 million or 30% of total value of construction put in place was done on transport infrastructure, which is 7% more than in 2012.
EUR 113 million was the value of construction put in place in one-dwelling buildings. In 2012 it was EUR 7 million higher.
EUR 85 million was the value of construction put in place in multi-dwelling buildings. In 2013 it was EUR 3 million lower than in 2012.
650,106 m2
was the total floor space of one-dwelling buildings completed in 2013. Of all buildings completed in 2013, 70% were one-dwelling buildings.
84% of buildingscompleted in 2013 were new constructions, 14% were extensions and 2% were obtained by conversion-improvements.
86% of investors of buildings completed in 2013 were natural persons.

65STAT'O'BOOK / MANUFACTURING AND SERVICES
Source: SURS
Total Urban settlements
Non-urban settlements
Dwellings 857,007 443,182 413,825
Useful floor space of dwellings (1,000 m2) 68,990 31,537 37,453
Average floor space of a dwelling (m2) 80.5 71.2 90.5
Average floor space per person (m2) 33.5 30.8 36.2
Average number of persons in a dwelling 2.4 2.3 2.5
Dwellings in Slovenia (estimated by the housing fund), 2013
Equipment of dwellings and auxiliary spaces (estimated by the housing fund), 2013
Source: SURS
According to the Housing Fund of the Republic of Slovenia, there were
857,007 dwellings in Slovenia in 2013.The total floor space of these dwellings was 68,990,176 m2.
The average floor space of a dwelling was 81 m2.On average dwellings were larger in non-urban settlements.
There were on average 2.4 people per dwelling. In urban settlements the average floor space per person was 31 m2 and in non-urban settlements 36 m2.
More than 90% of dwellingshad electricity, kitchen, water supply, toilet and bathroom.
79% of dwellings had central heating.
56% of dwellings were connected to the public sewage system.
Most of the dwellings (21%) were built between 1971 and 1980,followed by dwellings built between 1981 and 1990 (17%) and dwellings built between 1961 and 1970 (14%).

67STAT'O'BOOK / MANUFACTURING AND SERVICES
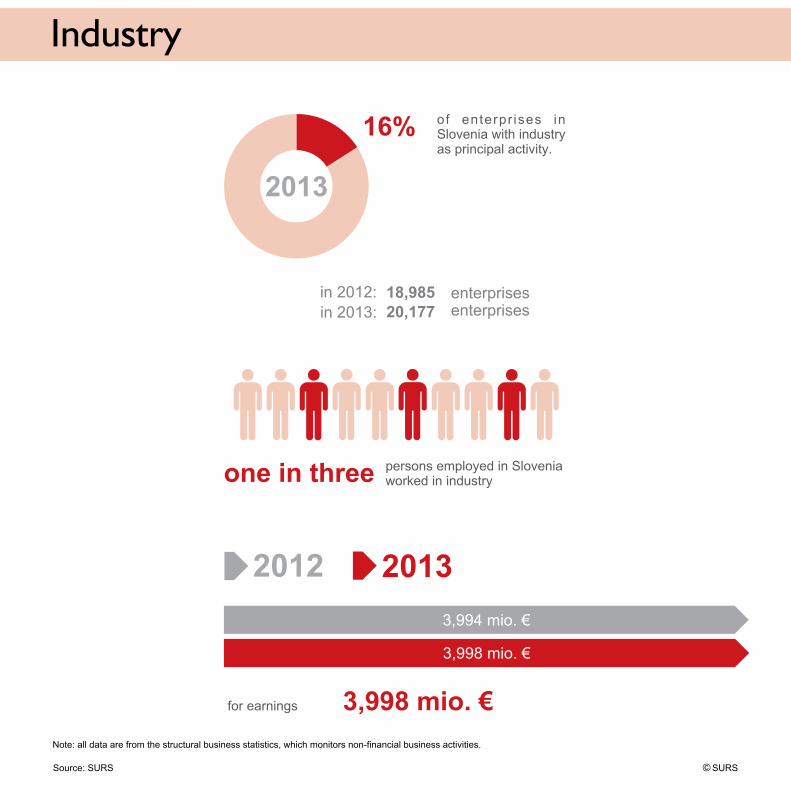
Industrial enterprises in Slovenia sold EUR 18.3 billion of industrial products and servicesin 2013.
More than 70% of turnover of industrial products and services was generated with sale on foreign markets.
Sale declined in both activities: in manufacturing by 1% and in mining and quarrying by 40%. The large drop in turnover in mining and quarrying was the result of the reclassification of one enterprise into another activity.
In Slovenia the index of industrial production was on average lower in 2013 than in 2012 (by 1.4%); however, in the first half of 2014 it started to grow again.
Trends in the industrial production index have been very similar in Slovenia and in the EU-28 since 2007.
Compared to 2008, in 2013 the average annual growth of the index was 7.8% lower in the EU-28 and 11.8% lower in Slovenia.
1) The total does not add up due to rounding.Source: SURS
2012 (mio. EUR)
2013 (mio. EUR)
Industry – turnover: 18,4981) 18,3251)
domestic market 5,185 5,428
foreign market 13,312 12,897
Mining and quarrying – turnover 100 60
Manufacturing – turnover 18,398 18,266
Industrial production1) in Slovenia and the EU-28
1) Seasonally adjusted data.2) Data for 2014 are provisional. Sources: SURS, Eurostat, 4. 9. 2014
STAT'O'BOOK / MANUFACTURING AND SERVICES68
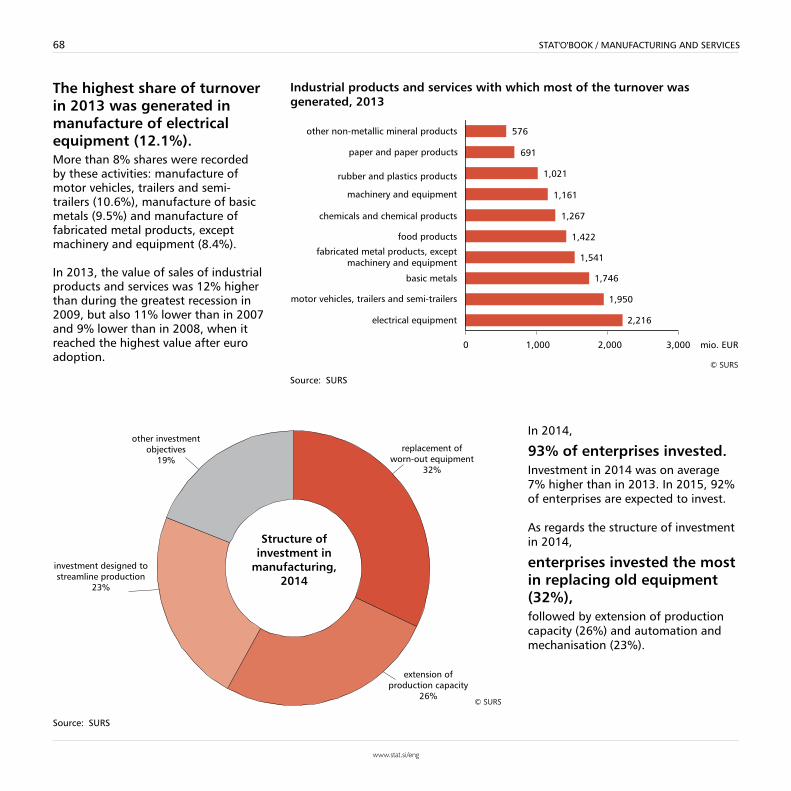
The highest share of turnover in 2013 was generated in manufacture of electrical equipment (12.1%). More than 8% shares were recorded by these activities: manufacture of motor vehicles, trailers and semi-trailers (10.6%), manufacture of basic metals (9.5%) and manufacture of fabricated metal products, except machinery and equipment (8.4%). In 2013, the value of sales of industrial products and services was 12% higher than during the greatest recession in 2009, but also 11% lower than in 2007 and 9% lower than in 2008, when it reached the highest value after euro adoption.
In 2014,
93% of enterprises invested.Investment in 2014 was on average 7% higher than in 2013. In 2015, 92% of enterprises are expected to invest.
As regards the structure of investment in 2014,
enterprises invested the most in replacing old equipment (32%), followed by extension of production capacity (26%) and automation and mechanisation (23%).
Industrial products and services with which most of the turnover was generated, 2013
Source: SURS
Source: SURS

69STAT'O'BOOK / MANUFACTURING AND SERVICES
Labour productivity increased in 2013 over 2012 by 1.9%.Labour productivity has been growing since 2005; it only declined in 2009 (economic crisis), i.e. by 8.1% compared to 2008.
The labour productivity index is the ratio between the industrial production index and the index of persons in employment.
The competitive position of enterprises improved in 2013 compared to 2012 only on the domestic market (by 2 percentage points);on the markets outside the EU it deteriorated by 3 percentage points, while on the markets of other EU Member States it was the same.
The values of these indicators were the lowest in 2009.
Labour productivity in industry
Source: SURS
Competitive position on the domestic market, markets of other EU Member States and markets outside the EU
Source: SURS

71STAT'O'BOOK / MANUFACTURING AND SERVICES
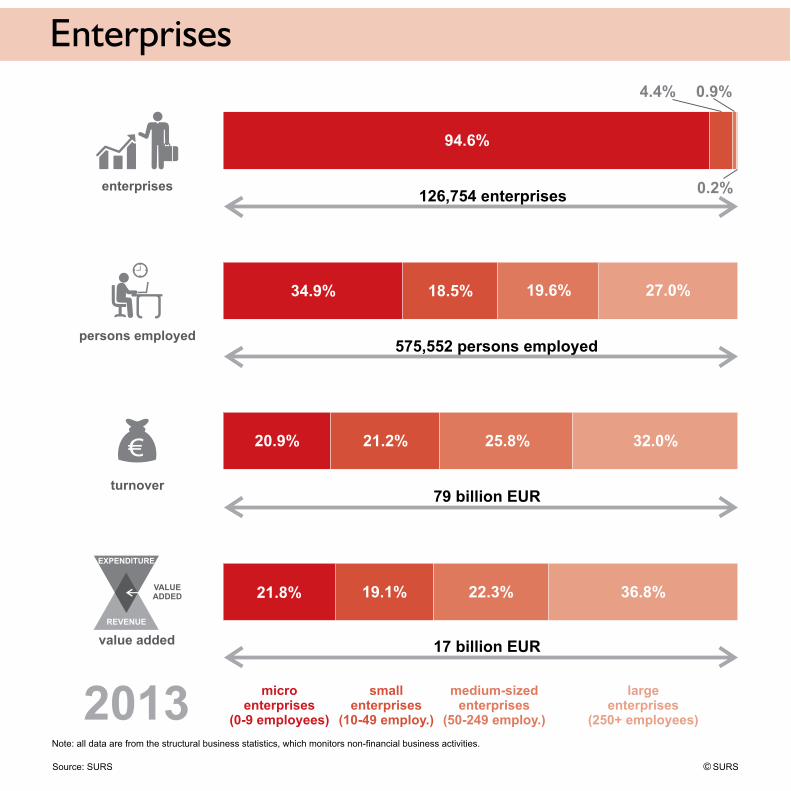
There were
126,754 enterprises with 572,552 employeesregistered in non-financial business activities in Slovenia in 2013. They generated EUR 79,193 million of turnover.
Compared to 2012, the number of enterprises went up by 5.9%, the number of persons employed went down by 0.3% and turnover declined by 1.6%.
15,395 enterprise births were recorded in 2012; they employed 17,536 people. As regards the organisational form, most of these enterprises were natural persons (68%).
12,620 enterprise deaths were recorded in 2012, which is the highest number in the observed period; they employed 14,873 people. As regards the organisational form, most of these enterprises were natural persons (82%).
1) Provisional data.Source: SURS
2012 20131)
Enterprises (number) 119,644 126,754
Persons employed (number) 574,479 572,552
Turnover (1,000 EUR) 80,451,791 79,192,931
Value added (1,000 EUR) 17,139,993 17,349,870
Earnings (1,000 EUR) 9,318,229 9,239,699
Purchase of goods and services - total (1,000 EUR) 62,975,420 61,442,286
Gross investment in tangible goods (1,000 EUR) 3,663,774 3,461,753
Business demography
1) Provisional data for 2012.Source: SURS

STAT'O'BOOK / MANUFACTURING AND SERVICES72
Of all enterprise births in 2007, 53% were still active in 2012. In 2012, the five-year survival rate of enterprises was 3 percentage points lower than a year before.
Most of the enterprises that were born in 2007 and were still active in 2012 had no employees (69.4%) and the fewest had 10 or more employees (0.5%).
Enterprises that have no employees are mostly sole proprietors.
There were
393 high-growth enterprises in terms of employment in Slovenia in 2012; 19% of them were less than five years old (gazelles).
There were also 861 medium-growth enterprises in terms of employment; 7% of them were less than five years old (young medium-growth enterprises).
A high-growth enterprise is an enterprise with average annual growth greater than 20% over a three-year period. A medium-growth enterprise is an enterprise with average annual growth between 10% and 20% over a three-year period and at least five employees at the beginning of the growth period.
Source: SURS
High-growth and medium-growth enterprises, gazelles and young medium-growth enterprises by employment growth, 2012
Source: SURS
73STAT'O'BOOK / MANUFACTURING AND SERVICES
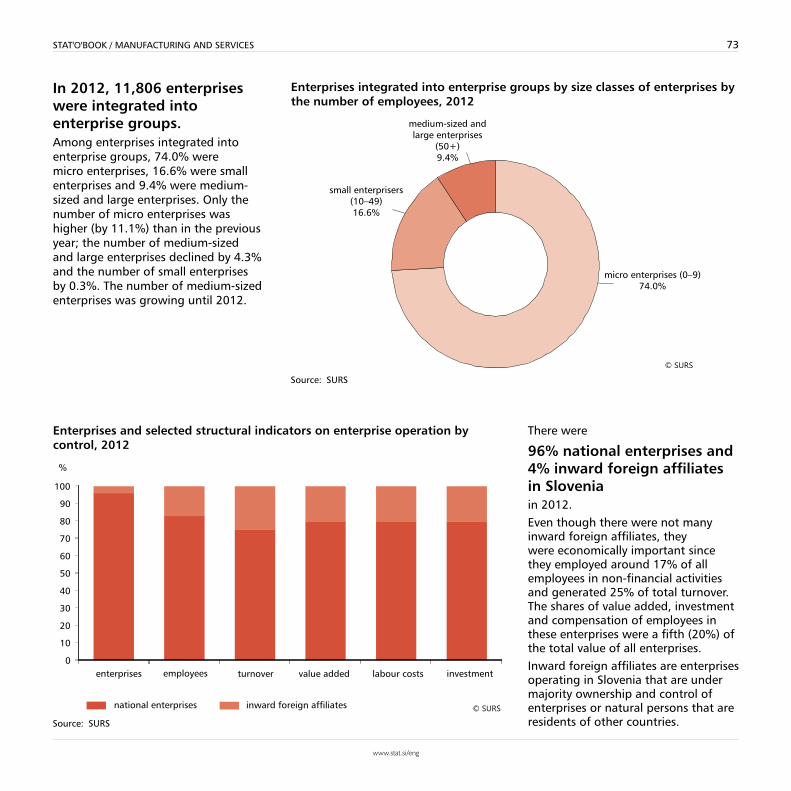
In 2012, 11,806 enterprises were integrated into enterprise groups. Among enterprises integrated into enterprise groups, 74.0% were micro enterprises, 16.6% were small enterprises and 9.4% were medium-sized and large enterprises. Only the number of micro enterprises was higher (by 11.1%) than in the previous year; the number of medium-sized and large enterprises declined by 4.3% and the number of small enterprises by 0.3%. The number of medium-sized enterprises was growing until 2012.
There were
96% national enterprises and 4% inward foreign affiliates in Slovenia in 2012.Even though there were not many inward foreign affiliates, they were economically important since they employed around 17% of all employees in non-financial activities and generated 25% of total turnover. The shares of value added, investment and compensation of employees in these enterprises were a fifth (20%) of the total value of all enterprises. Inward foreign affiliates are enterprises operating in Slovenia that are under majority ownership and control of enterprises or natural persons that are residents of other countries.
Enterprises integrated into enterprise groups by size classes of enterprises by the number of employees, 2012
Source: SURS
Enterprises and selected structural indicators on enterprise operation by control, 2012
Source: SURS
75STAT'O'BOOK / MANUFACTURING AND SERVICES
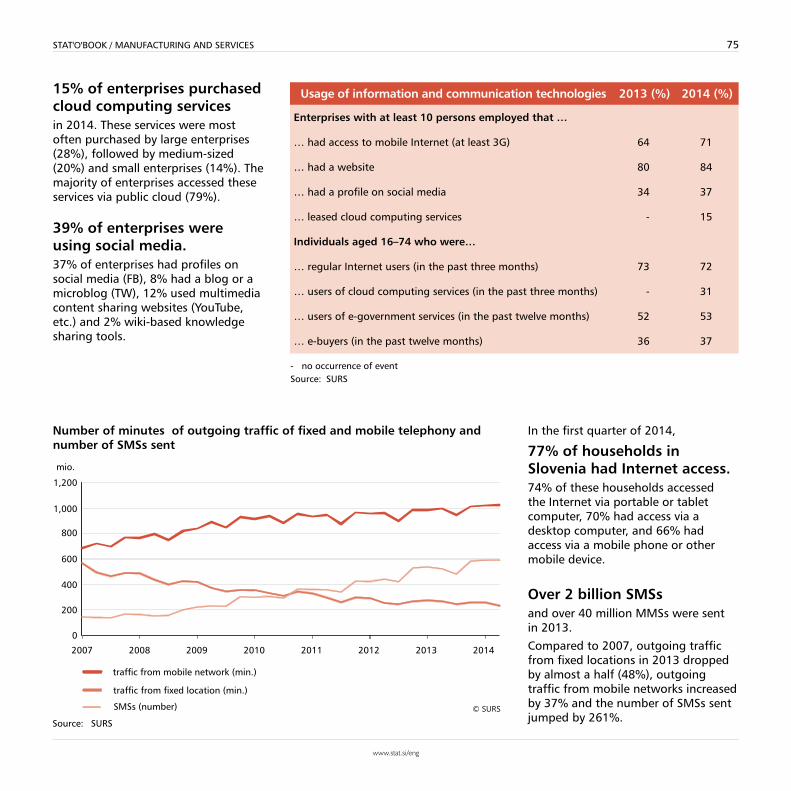
15% of enterprises purchased cloud computing services in 2014. These services were most often purchased by large enterprises (28%), followed by medium-sized (20%) and small enterprises (14%). The majority of enterprises accessed these services via public cloud (79%).
39% of enterprises were using social media. 37% of enterprises had profiles on social media (FB), 8% had a blog or a microblog (TW), 12% used multimedia content sharing websites (YouTube, etc.) and 2% wiki-based knowledge sharing tools.
In the first quarter of 2014,
77% of households in Slovenia had Internet access.74% of these households accessed the Internet via portable or tablet computer, 70% had access via a desktop computer, and 66% had access via a mobile phone or other mobile device.
Over 2 billion SMSs and over 40 million MMSs were sent in 2013.
Compared to 2007, outgoing traffic from fixed locations in 2013 dropped by almost a half (48%), outgoing traffic from mobile networks increased by 37% and the number of SMSs sent jumped by 261%.
- no occurrence of eventSource: SURS
Usage of information and communication technologies 2013 (%) 2014 (%)
Enterprises with at least 10 persons employed that …
… had access to mobile Internet (at least 3G) 64 71
… had a website 80 84
… had a profile on social media 34 37
… leased cloud computing services - 15
Individuals aged 16–74 who were…
… regular Internet users (in the past three months) 73 72
… users of cloud computing services (in the past three months) - 31
… users of e-government services (in the past twelve months) 52 53
… e-buyers (in the past twelve months) 36 37
Number of minutes of outgoing traffic of fixed and mobile telephony and number of SMSs sent
Source: SURS
STAT'O'BOOK / MANUFACTURING AND SERVICES76
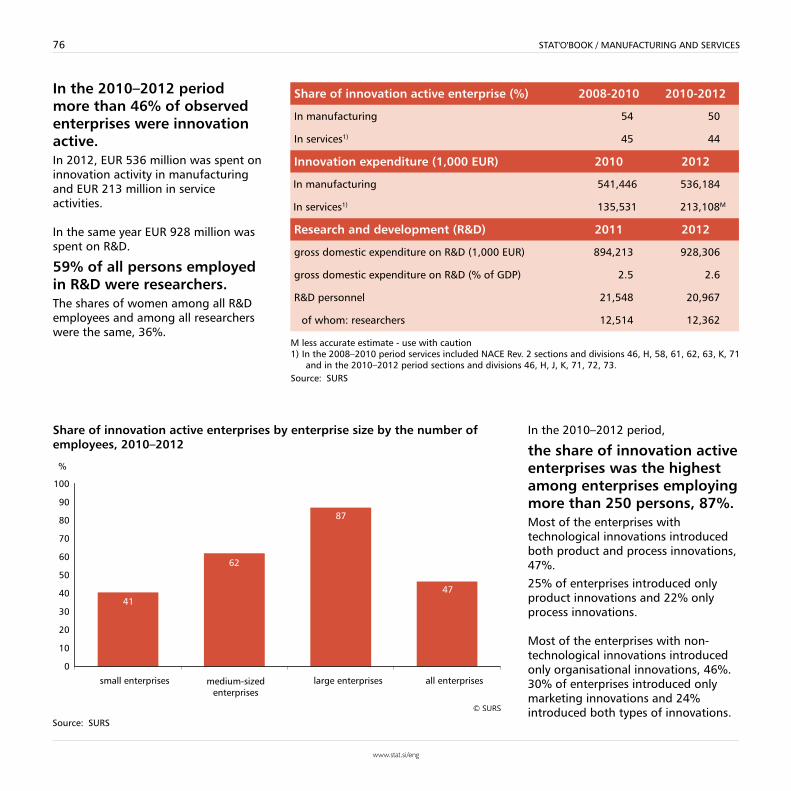
In the 2010–2012 period more than 46% of observed enterprises were innovation active. In 2012, EUR 536 million was spent on innovation activity in manufacturing and EUR 213 million in service activities.
In the same year EUR 928 million was spent on R&D.
59% of all persons employed in R&D were researchers. The shares of women among all R&D employees and among all researchers were the same, 36%.
In the 2010–2012 period,
the share of innovation active enterprises was the highest among enterprises employing more than 250 persons, 87%. Most of the enterprises with technological innovations introduced both product and process innovations, 47%.
25% of enterprises introduced only product innovations and 22% only process innovations.
Most of the enterprises with non-technological innovations introduced only organisational innovations, 46%. 30% of enterprises introduced only marketing innovations and 24% introduced both types of innovations.
M less accurate estimate - use with caution 1) In the 2008–2010 period services included NACE Rev. 2 sections and divisions 46, H, 58, 61, 62, 63, K, 71
and in the 2010–2012 period sections and divisions 46, H, J, K, 71, 72, 73.Source: SURS
Share of innovation active enterprise (%) 2008-2010 2010-2012
In manufacturing 54 50
In services1) 45 44
Innovation expenditure (1,000 EUR) 2010 2012
In manufacturing 541,446 536,184
In services1) 135,531 213,108M
Research and development (R&D) 2011 2012
gross domestic expenditure on R&D (1,000 EUR) 894,213 928,306
gross domestic expenditure on R&D (% of GDP) 2.5 2.6
R&D personnel 21,548 20,967
of whom: researchers 12,514 12,362
Share of innovation active enterprises by enterprise size by the number of employees, 2010–2012
Source: SURS

77STAT'O'BOOK / MANUFACTURING AND SERVICES
As one of the sources of funding R&D, companies contributed EUR 578 millionin 2012, which was 62% of total sources of funding R&D in Slovenia.
Most of the funds for R&D were spent in the business enterprise sector, i.e. EUR 703.1 million or 76% of total R&D expenditure.
44.3% of researchers were employed in the business enterprise sector,38% in the higher education sector, 17.5% in the government sector and only 0.1% in the private non-profit sector.
There were
7,779 doctorate holders in Slovenia in 2012. Women represented 41% of all doctorate holders.
Most of the doctorate holders had doctorate
degrees in natural sciences, 27%, and the fewest had doctorate degrees in agricultural sciences (5%). According to estimates, 91% of doctorate holders were employed, 6% were inactive and 2% were unemployed. 63% of doctorate holders were satisfied with their principal jobs; the biggest dissatisfaction was expressed in terms of opportunities for advancement and salary.
Source: SURS
Source: SURS


79STAT'O'BOOK / MANUFACTURING AND SERVICES
In 2013,
passenger cars in Slovenia were on average 9.1 years old.In the 2004–2013 period the average age of passenger cars increased by 1.7 years.
Compared to 2012,
in 2013 around 5 million (12%) more passengers were carried in urban scheduled transport and around 900,000 passengers more were carried in railway transport.
1) Provisional data.Sources: DRSC, MZI, SURS
2012 2013
Length of roads1) (km) 38,985 38,874
Length of railway tracks (km) 1,209 1,209
Road motor vehicles as of 31 December 1,393,645 1,396,691
New road motor vehicles registered for the first time 67,094 68,592
Average age of passenger cars (years) 8.7 9.1
Urban public scheduled transport (1,000 passengers) 42,760 47,752
Railway passenger transport (1,000 passengers) 15,512 16,420
Air passenger transport (1,000 passengers) 1,171 1,279
Road goods transport (1,000 tonnes) 62,759 65,340
Railway goods transport (1,000 tonnes) 15,828 17,156
Port traffic of goods (1,000 tonnes) 16,907 17,184
Number of people killed in road traffic accidents 130 125
There were
18,904 road traffic accidents in Slovenia in 2013, which means that in the past ten years their number declined by more than a half (56%). The number of registered passenger cars increased by 14% in the past ten years to 1,063,795 in 2013.
In 2013,
most road traffic accidents happened in June, 1,707,and as regards the days of the week on Fridays (17%).
Road traffic accidents and passenger cars
Source: SURS
STAT'O'BOOK / MANUFACTURING AND SERVICES80
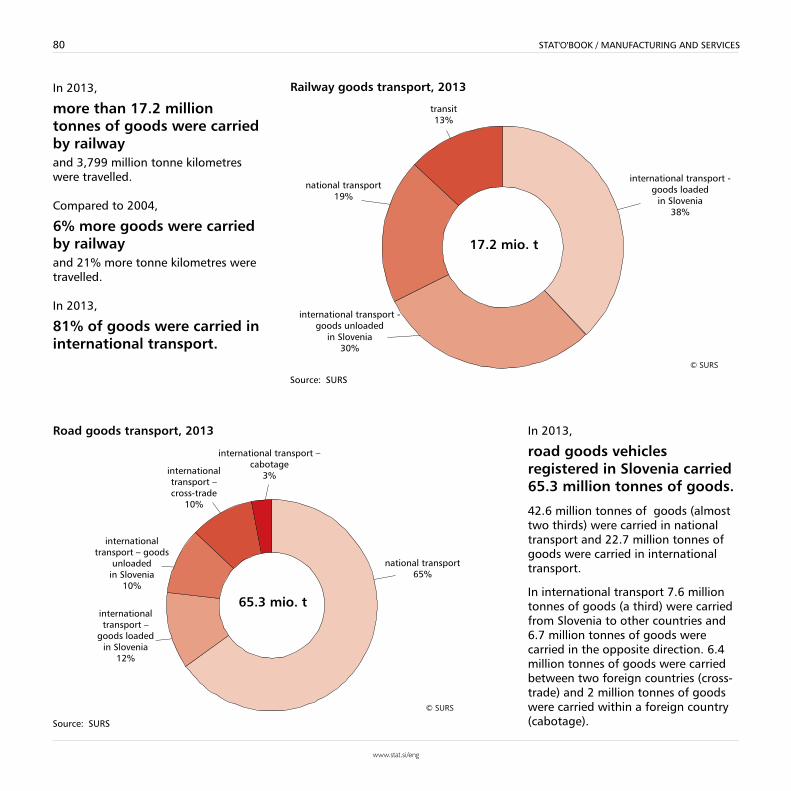
In 2013,
more than 17.2 million tonnes of goods were carried by railwayand 3,799 million tonne kilometres were travelled.
Compared to 2004,
6% more goods were carried by railway and 21% more tonne kilometres were travelled.
In 2013,
81% of goods were carried in international transport.
In 2013,
road goods vehicles registered in Slovenia carried 65.3 million tonnes of goods.
42.6 million tonnes of goods (almost two thirds) were carried in national transport and 22.7 million tonnes of goods were carried in international transport.
In international transport 7.6 million tonnes of goods (a third) were carried from Slovenia to other countries and 6.7 million tonnes of goods were carried in the opposite direction. 6.4 million tonnes of goods were carried between two foreign countries (cross-trade) and 2 million tonnes of goods were carried within a foreign country (cabotage).
Railway goods transport, 2013
Source: SURS
Road goods transport, 2013
Source: SURS
81STAT'O'BOOK / MANUFACTURING AND SERVICES
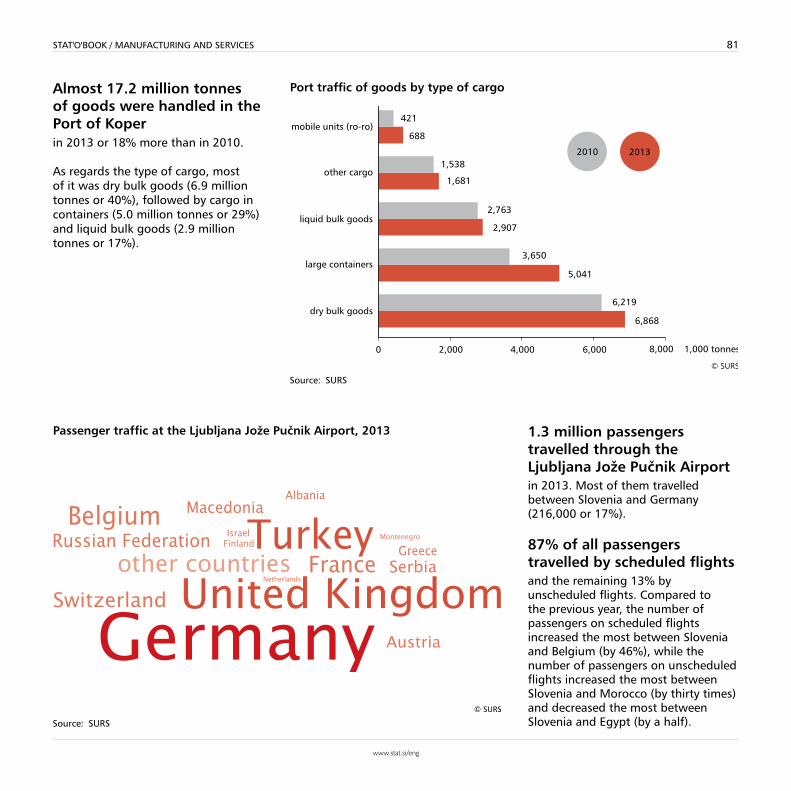
Almost 17.2 million tonnes of goods were handled in the Port of Koper in 2013 or 18% more than in 2010.
As regards the type of cargo, most of it was dry bulk goods (6.9 million tonnes or 40%), followed by cargo in containers (5.0 million tonnes or 29%) and liquid bulk goods (2.9 million tonnes or 17%).
1.3 million passengers travelled through the Ljubljana Jože Pučnik Airport in 2013. Most of them travelled between Slovenia and Germany (216,000 or 17%).
87% of all passengers travelled by scheduled flights and the remaining 13% by unscheduled flights. Compared to the previous year, the number of passengers on scheduled flights increased the most between Slovenia and Belgium (by 46%), while the number of passengers on unscheduled flights increased the most between Slovenia and Morocco (by thirty times) and decreased the most between Slovenia and Egypt (by a half).
Port traffic of goods by type of cargo
Source: SURS
Passenger traffic at the Ljubljana Jože Pučnik Airport, 2013
Source: SURS
© SURS
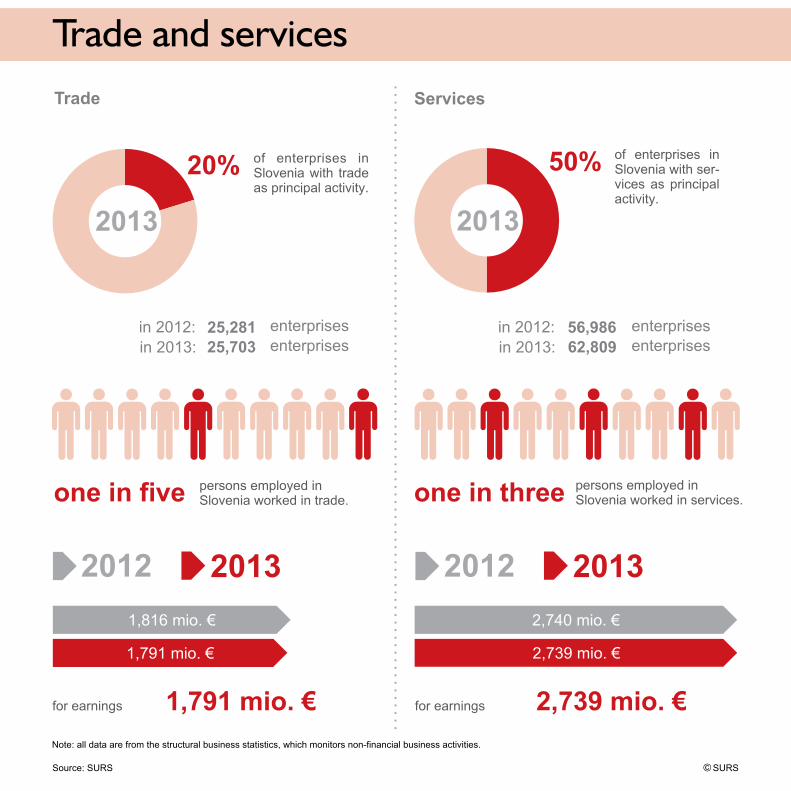
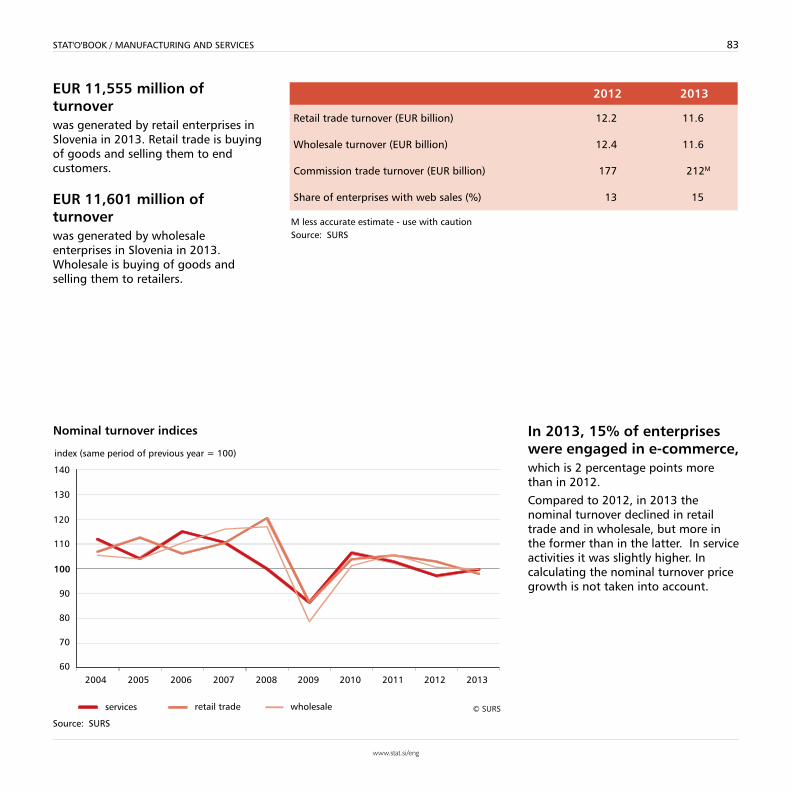
83STAT'O'BOOK / MANUFACTURING AND SERVICES
EUR 11,555 million of turnover was generated by retail enterprises in Slovenia in 2013. Retail trade is buying of goods and selling them to end customers.
EUR 11,601 million of turnover was generated by wholesale enterprises in Slovenia in 2013. Wholesale is buying of goods and selling them to retailers.
M less accurate estimate - use with cautionSource: SURS
2012 2013
Retail trade turnover (EUR billion) 12.2 11.6
Wholesale turnover (EUR billion) 12.4 11.6
Commission trade turnover (EUR billion) 177 212M
Share of enterprises with web sales (%) 13 15
Nominal turnover indices
Source: SURS
In 2013, 15% of enterprises were engaged in e-commerce,which is 2 percentage points more than in 2012.
Compared to 2012, in 2013 the nominal turnover declined in retail trade and in wholesale, but more in the former than in the latter. In service activities it was slightly higher. In calculating the nominal turnover price growth is not taken into account.

STAT'O'BOOK / MANUFACTURING AND SERVICES84
EUR 8.6 billion of turnover was generated by retail enterprises (excluding those selling motor vehicles) in 2013.
EUR 259 million less turnover than in v 2012 was generated by retail sale of automotive fuels.
EUR 169 million less turnover than in 2012 was generated by retail sale of information and communication equipment in specialised stores.
Retail trade turnover by principal activity of enterprise
M less accurate estimate - use with cautionSource: SURS
Source: SURS
The highest share of turnover was generated by retail sale of food (19%) and retail sale of fuels (18%).
4 or more percent of total turnover was generated by retail sale of cars (9%), clothing and footwear (6%), medical instruments and supplies (5%), beverages (5%) and tobacco (4%).

85STAT'O'BOOK / MANUFACTURING AND SERVICES
Wholesale turnover on the domestic market by principal activity of enterprise EUR 7.2 billion of turnover was generated by wholesale trade, except of motor vehicles and motorcycles in 2013.
Wholesale of information and communication equipment generated
EUR 68 million more turnover than in 2012.
Enterprises dealing with wholesale on a fee or contract basis generated
EUR 249 million less turnoverthan in 2012.
The highest share of turnover was generated by wholesale of coke and refined petroleum products and by wholesale of pharmaceutical goods (11%).
5 or more percent of total turnover was generated by wholesale of food (9%), cars (8%), computer, electronic and optical products (7%), tobacco (6%), chemicals and chemical products (6%) and unprocessed wood and ores (5%).
Source: SURS
M less accurate estimate - use with cautionSource: SURS
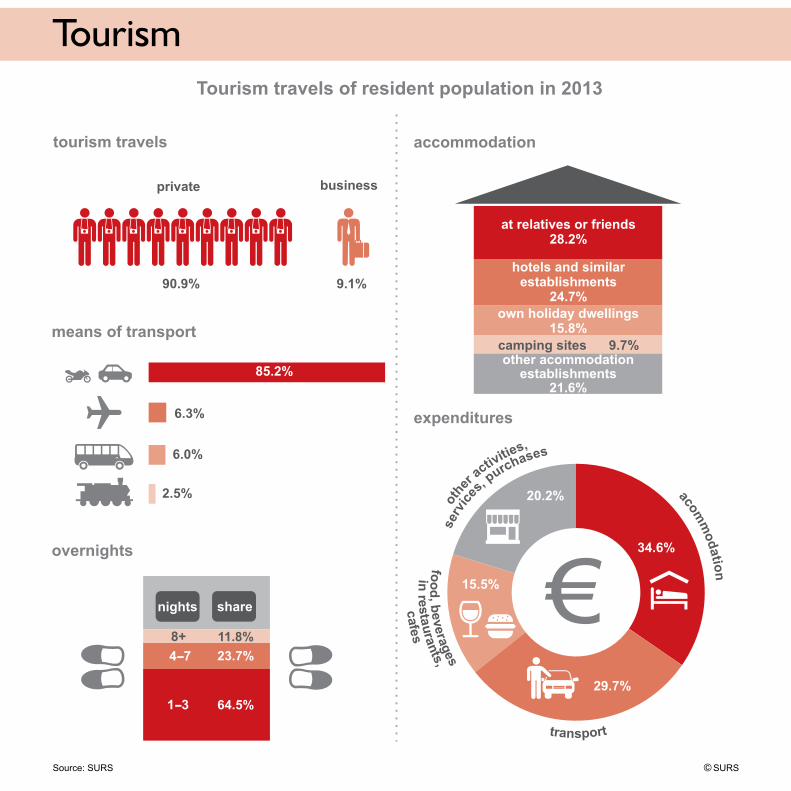
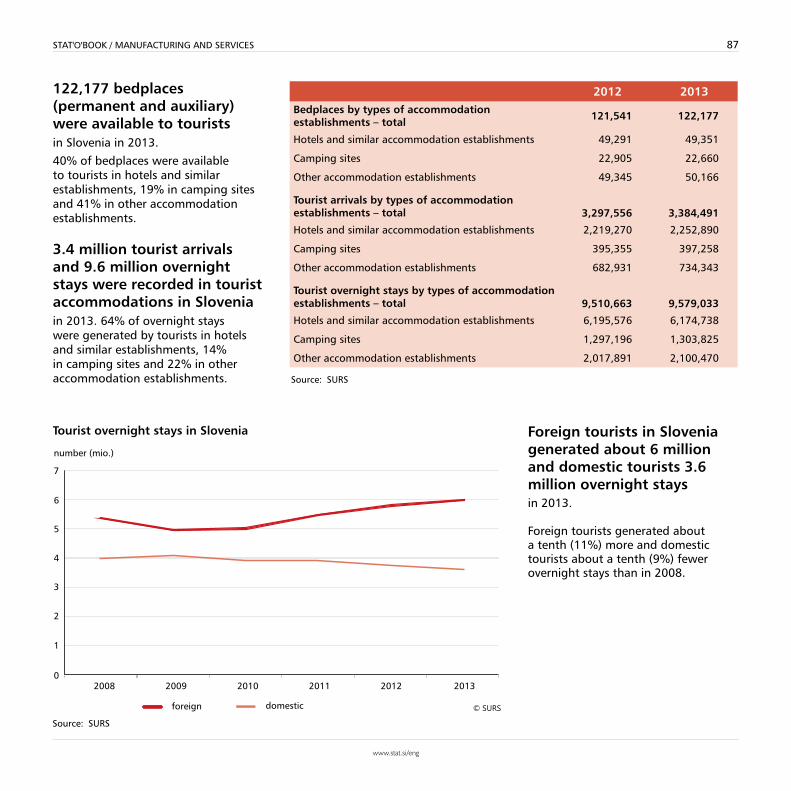
87STAT'O'BOOK / MANUFACTURING AND SERVICES
122,177 bedplaces (permanent and auxiliary) were available to tourists in Slovenia in 2013.
40% of bedplaces were available to tourists in hotels and similar establishments, 19% in camping sites and 41% in other accommodation establishments.
3.4 million tourist arrivals and 9.6 million overnight stays were recorded in tourist accommodations in Sloveniain 2013. 64% of overnight stays were generated by tourists in hotels and similar establishments, 14% in camping sites and 22% in other accommodation establishments. Source: SURS
2012 2013Bedplaces by types of accommodation establishments – total 121,541 122,177
Hotels and similar accommodation establishments 49,291 49,351
Camping sites 22,905 22,660
Other accommodation establishments 49,345 50,166
Tourist arrivals by types of accommodation establishments – total 3,297,556 3,384,491
Hotels and similar accommodation establishments 2,219,270 2,252,890
Camping sites 395,355 397,258
Other accommodation establishments 682,931 734,343
Tourist overnight stays by types of accommodation establishments – total 9,510,663 9,579,033
Hotels and similar accommodation establishments 6,195,576 6,174,738
Camping sites 1,297,196 1,303,825
Other accommodation establishments 2,017,891 2,100,470
Foreign tourists in Slovenia generated about 6 million and domestic tourists 3.6 million overnight staysin 2013.
Foreign tourists generated about a tenth (11%) more and domestic tourists about a tenth (9%) fewer overnight stays than in 2008.
Tourist overnight stays in Slovenia
Source: SURS
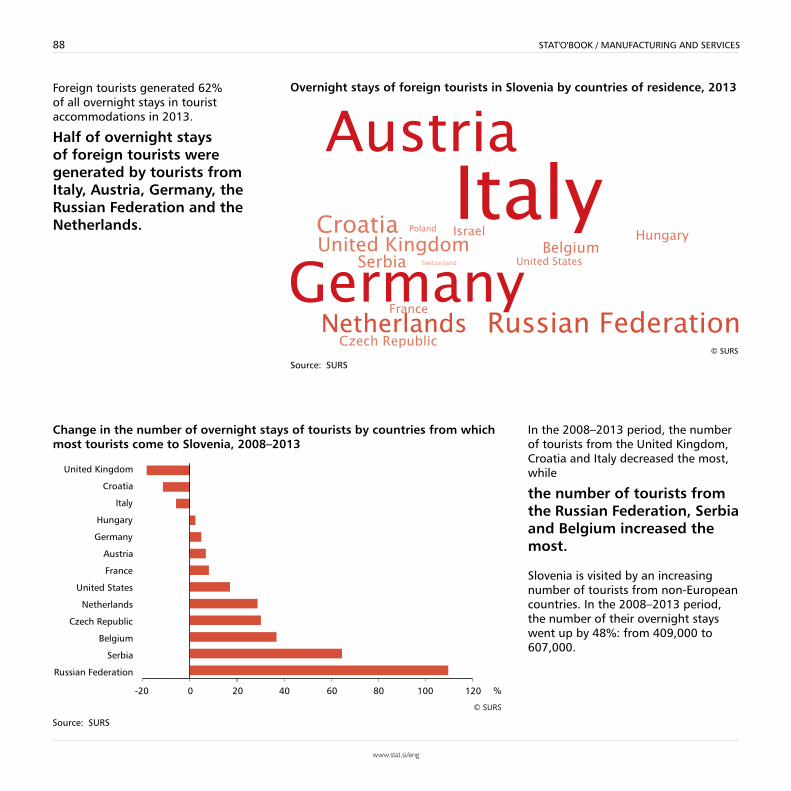
STAT'O'BOOK / MANUFACTURING AND SERVICES88
Change in the number of overnight stays of tourists by countries from which most tourists come to Slovenia, 2008–2013
Source: SURS
Foreign tourists generated 62% of all overnight stays in tourist accommodations in 2013.
Half of overnight stays of foreign tourists were generated by tourists from Italy, Austria, Germany, the Russian Federation and the Netherlands.
In the 2008–2013 period, the number of tourists from the United Kingdom, Croatia and Italy decreased the most, while
the number of tourists from the Russian Federation, Serbia and Belgium increased the most.
Slovenia is visited by an increasing number of tourists from non-European countries. In the 2008–2013 period, the number of their overnight stays went up by 48%: from 409,000 to 607,000.
Overnight stays of foreign tourists in Slovenia by countries of residence, 2013
Source: SURS
© SURS
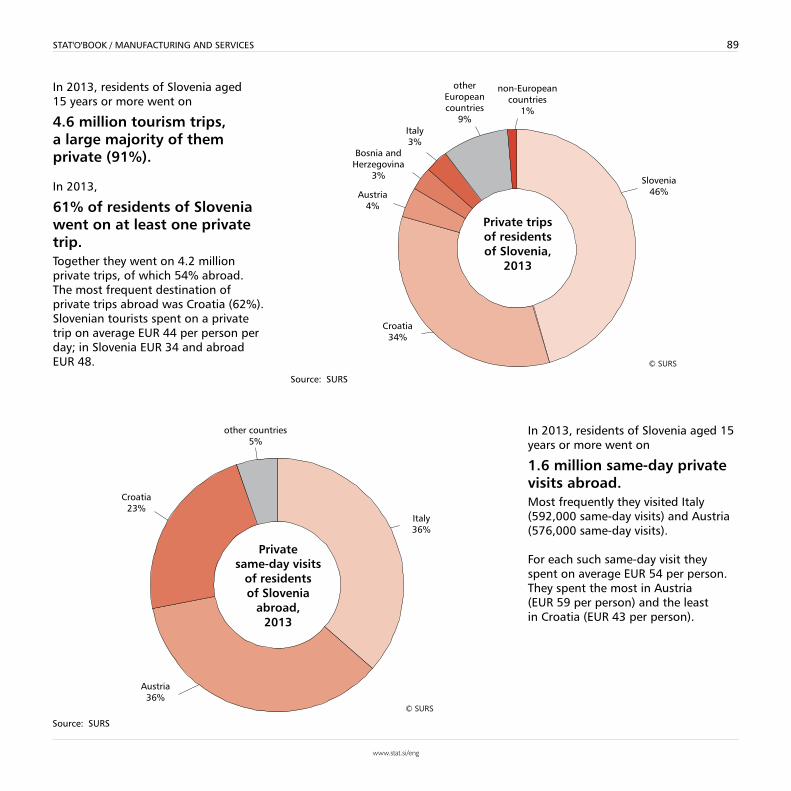
89STAT'O'BOOK / MANUFACTURING AND SERVICES
In 2013, residents of Slovenia aged 15 years or more went on
4.6 million tourism trips, a large majority of them private (91%).
In 2013,
61% of residents of Slovenia went on at least one private trip. Together they went on 4.2 million private trips, of which 54% abroad. The most frequent destination of private trips abroad was Croatia (62%). Slovenian tourists spent on a private trip on average EUR 44 per person per day; in Slovenia EUR 34 and abroad EUR 48.
Source: SURS
Source: SURS
In 2013, residents of Slovenia aged 15 years or more went on
1.6 million same-day private visits abroad.Most frequently they visited Italy (592,000 same-day visits) and Austria (576,000 same-day visits).
For each such same-day visit they spent on average EUR 54 per person. They spent the most in Austria (EUR 59 per person) and the least in Croatia (EUR 43 per person).
STAT'O'BOOK 90
STATISTICAL SIGNS, ABBREVIATIONS AND UNITS OF MEASUREMENT
ø averageM less accurate estimate - use with caution- no occurrence of event
% percent°C degrees CelsiusEUR euroGg gigagramGJ gigajouleha hectarekg kilogramkm kilometrekm2 square kilometrekWh kilowatt-hourl litrem3 cubic metremin. minutemio. millionmm millimetreMWh megawatt-hour Sm3 standard cubic metret ton/tonne = 1,000 kgTJ terajouletoe ton of oil equivalent CH4 methaneCO2 carbon dioxideHFCs hydrofluorocarbonsN2O nitrous oxidePFCs perfluorcarbonsSF6 sulphur hexafluoride
AWU annual work unit GDP gross domestic productHICP harmonised index of consumer prices LSU livestock unitLUCF land use change and forestryNace Statistical classification of economic activities in the European CommunityNPISH non-profit institutions serving householdsR&D research and developmentVAT value-added tax
ARSO Slovenian Environment AgencyIJS-CEU Jožef Stefan InstituteDRSC Slovenian Roads AgencyEurostat Statistical Office of the European UnionMKGP Ministry of Agriculture, Forestry and FoodMOP Ministry of the Environment and Spatial Planning MZI Ministry of InfrastructureSMA Surveying and Mapping Authority of the Republic of SloveniaSURS Statistical Office of the Republic of SloveniaZGS Slovenian Forest Service
Images for some infographics were obtained from: http://www.flaticon.com.

HOW TO OBTAIN STATISTICAL DATA AND INFORMATION?
• on Statistical Office’s website www.stat.si/eng
• via mail, phone, fax and e-mailadress: Statistical Office of the Republic of Slovenia,Litostrojska cesta 54, 1000 Ljubljana, Slovenia
phone: +386 1 241 64 04 fax: +386 1 241 53 44 answering machine: +386 1 475 65 55
e-mail: [email protected]
• by ordering statistical publicationsadress: Statistical Office of the Republic of Slovenia,Litostrojska cesta 54, 1000 Ljubljana, Sloveniaphone: +386 1 241 52 85fax: +386 1 241 53 44e-mail: [email protected]
• by visiting the Information Centre office hours: Monday to Thursday from 9.00 to 15.30 Friday from 9.00 to 14.30