Embed Size (px)
Citation preview

Thomas Liebig International Migration Division
Directorate for Employment, Labour and
Social Affairs
Settling In
OECD-EU Indicators of Immigrant
Integration and related OECD work
Paris, 1 October 2015

In the OECD, one person in five has a migration
background
Population share of immigrants and of native-born offspring of immigrants, around 2013
Percentage of the total population
0
10
20
30
40
50
60
70Immigrants (foreign-born) Native-born with at least one foreign-born parent%

Recent arrivals have problems to integrate in
virtually all countries…
Differences in employment rates of recent (<10 years of residence) and settled (>=10 years)
immigrants compared to those of native-born, persons aged 15-64 years old, 2012-13
Percentage points
Differences in the outcomes of recent arrivals across countries
largely reflect differences in the composition of the immigrant intake
by migration category
-30
-25
-20
-15
-10
-5
0
5
10
15Settled immigrants Recent immigrants
…and this holds in particular for refugees
Employment rate by immigrant category and duration of stay in European OECD countries, 2008
0%
25%
50%
75%
100%
1 2 3 4 5 6 7 8 9 10 11-14 15-19
Duration of stay (years)
International protection Work or study Family
The average duration of 5-6 years can be shorter if the economic
climate is favourable and integration policy well-designed
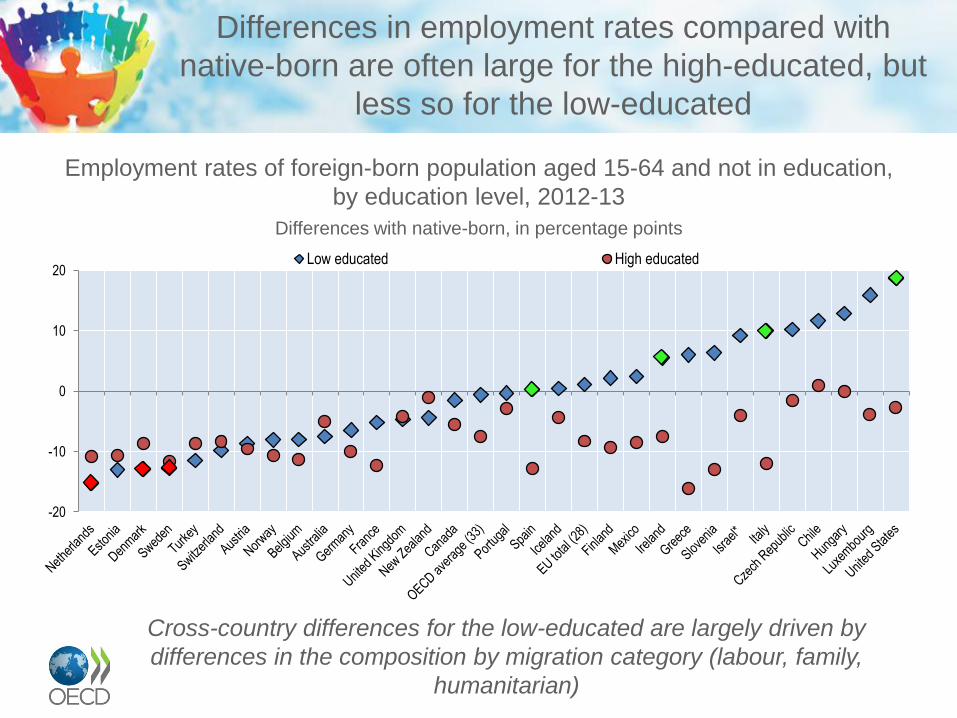
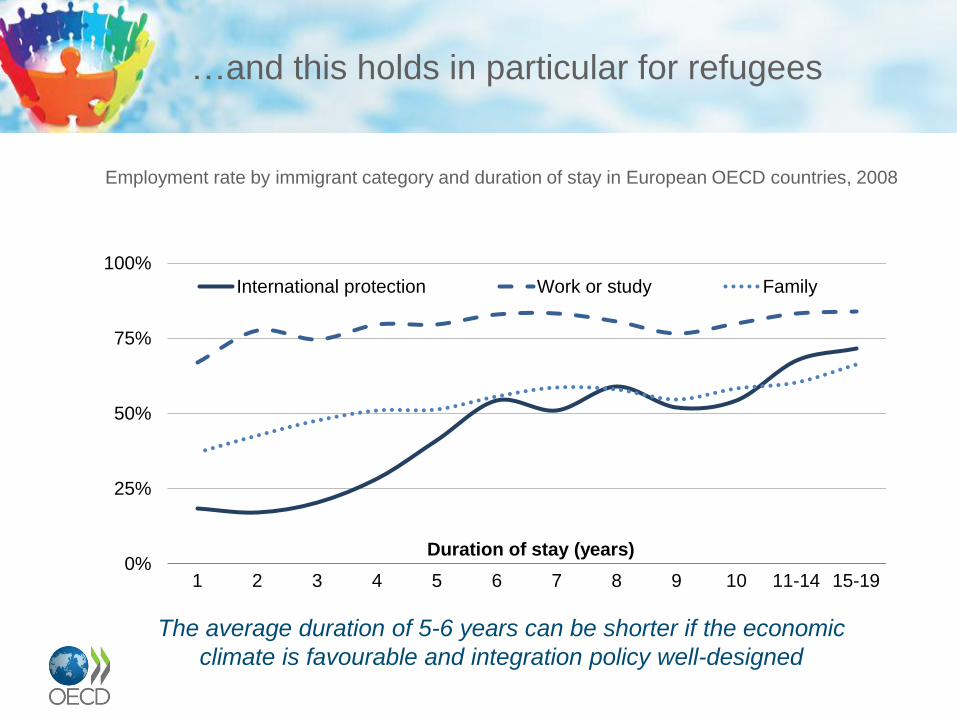
Differences in employment rates compared with
native-born are often large for the high-educated, but
less so for the low-educated
Employment rates of foreign-born population aged 15-64 and not in education,
by education level, 2012-13
Differences with native-born, in percentage points
Cross-country differences for the low-educated are largely driven by
differences in the composition by migration category (labour, family,
humanitarian)
-20
-10
0
10
20Low educated High educated

In Europe, offspring of immigrants are twice as
often among the most marginalised
Youth (15-34) who are both low-educated and not in employment, education and
training (NEET), by origin of parents, around 2013
0
5
10
15
20
25
30
Native-born offspring of native-born Youth with migrant background%

There is a high sentiment of discrimination among
immigrant offspring in Europe
Persons who consider themselves members of a group that is or has been
discriminated against on the ground of ethnicity, nationality or race,
selected OECD countries, 2002-12
As a percentage of all foreign-born/native-born with two foreign-born parents, persons aged 15-64 and 15-34
0
5
10
15
20
25
30
35
40
Foreign-born (15-64) Native-born with 2 foreign-born parents (15-34)

The scoreboard: comparisons across peer groups
- How do immigrant vs. native differences compare
with those in other countries?
8
Settlement
countries
Longstanding countries of immigration Destinations with
significant recent
and humanitarian
migration
many recent and
high-educated
immigrants
longstanding lower-
educated immigrants
Au
str
alia
New
Ze
ala
nd
Isra
el
Can
ad
a
Lu
xe
mb
ou
rg
Sw
itze
rla
nd
Unite
d S
tate
s
Unite
d K
ing
do
m
Au
str
ia
Be
lgiu
m
Ge
rma
ny
Fra
nce
Neth
erl
an
ds
Sw
ed
en
Norw
ay
Den
ma
rk
Fin
lan
d
Employment current
trend
Overqualification current
trend
Poverty current
trend
Overcrowding current
trend
Health current
trend
Youth: PISA scores current
trend
Youth: NEET rate current

Scoreboard (cont.)
9
New destinations with many recent
labour migrants Countries with immigrant
population shaped by border
changes Low-educated High
educated
Sp
ain
Ita
ly
Po
rtu
ga
l
Gre
ece
Ire
lan
d
Ice
lan
d
Esto
nia
Slo
ve
nia
Cze
ch
Rep
ub
lic
Hun
ga
ry
Slo
va
k R
ep
ub
lic
Po
lan
d
Employment current
trend
Overqualification current
trend
Poverty current
trend
Overcrowding current
trend
Health current
trend
Youth: Education
(PISA )
current
trend
Youth: NEET current

• Increasing heterogeneity of immigration flows - both in terms of category (labour,
family, free mobility, humanitarian) and skills levels within these categories - requires
tailor-made approaches
• For immigrants lacking basic skills, significant and long-term investment must be
made without immediate pay-off
• In Southern Europe, many low-skilled migrants arrived just prior to the crisis, raising
issues of long-term employability and appropriate targeting (i.e. who is likely to stay?)
• Family migrants who do not depend on benefits are often neglected in integration
measures, although they are a large group – and the impact extends on their children
• Children of immigrants are entering the labour market in growing numbers, and their
outcomes are often unfavourable
• Large inflows of humanitarian migrants and their settlement, including in countries
with little experience in dealing with such flows
1
0
New challenges

Act soon after arrival: early labour market integration and integration
into the school system is crucial for long-term success
Place refugees where the jobs are – and not where cheap housing is
available
Acknowledge that refugee’s needs differ with their skills levels –
there is no «one size fits all»
Start the integration process with a stock-taking of the skills of
refugees and build up on these skills
Link language training with on-the-job experience
Integrating refugees –
Key issues from OECD work to consider

12
Selected key OECD work on integration:
OECD-EU Indicators of Immigrant Integration:
https://www.compareyourcountry.org/indicators-of-
immigrant-integration
Further information: [email protected]
…the Integration of the Children of Immigrants
… Country Studies
… Immigrant Entrepreneurship
… Naturalisation and Integration Outcomes