Embed Size (px)
Citation preview
Rising FaRes at the tuRnstile the entry is becoming the barrier to economic mobility for low-income new Yorkers
Findings from the 2014 Unheard Third survey of New York City residents
March, 2015 www.cssny.org

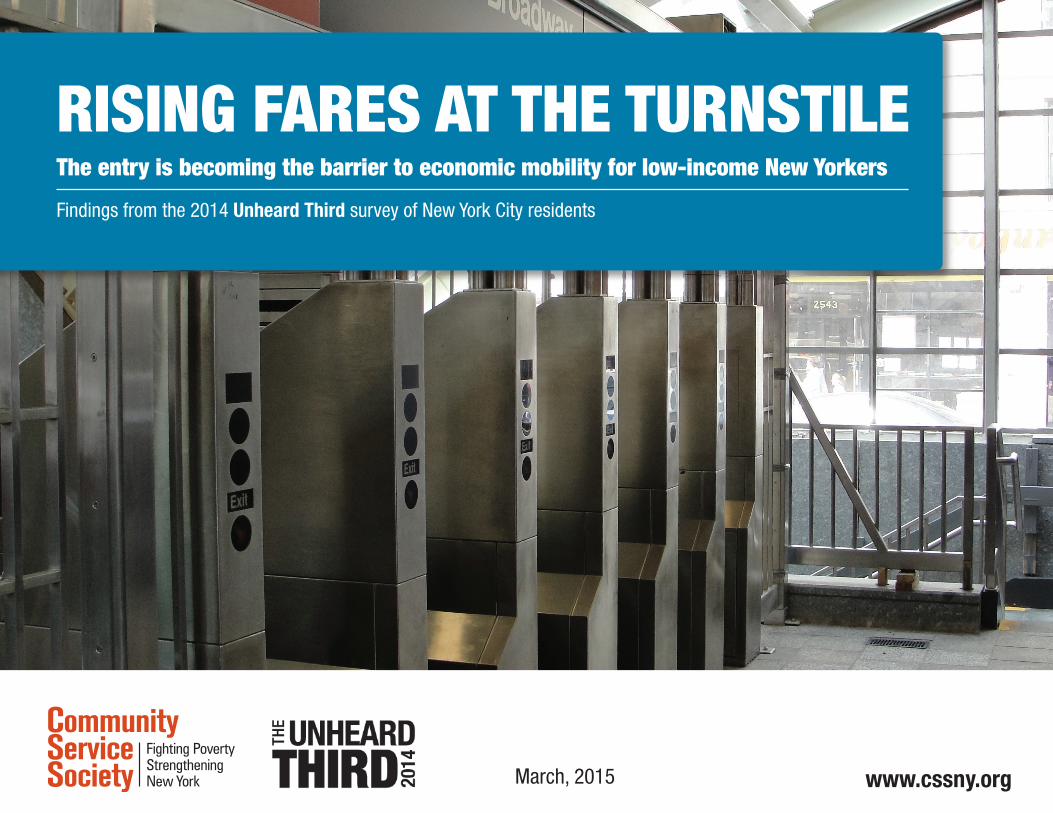
Being UnaBle To afford sUBway and BUs fares now ranks as The mosT-reporTed hardship among poor new yorkers.
% of poor reporting hardship on Unheard Third (2014)
www.cssny.org
11%12%
16%16%
18%18%
19%22%
23%23%23%
25%29%29%
32%33%
0% 5% 10% 15% 20% 25% 30% 35%
Received assistance fom charity, religious, or community organization
Been threatened by foreclosure or eviction
Not gotten or postponed medical care or surgery
Moved in with other people
Received free food or meals from a food pantry or soup kitchen
Had gas, electricity, or telephone turned off
Went hungry because there wasn't enough money to buy food
Had hours, wages, or tips reduced
Often skipped meals
Needed to fill a prescription but couldn't
Lost your job
Receieved free food or meals from family or friends
Been without health insurance coverage
Fallen behind in rent or mortgage
Cut back on buying school supplies or clothes
Often unable to afford subway and bus fares
1 oUT of 3 poor new yorkers are ofTen UnaBle To afford sUBway and BUs fares now . . . even Before The laTesT hikes Take effecT.
Q: in the last year, have you or any member of your household been often unable to afford subway or bus fares
www.cssny.org
33%
27%
8%
16%
0% 5% 10% 15% 20% 25% 30% 35%
Poor
All Low income
Mod-high
Total

sUBway fares are rising more QUickly Than incomes for lower-income new york ciTy hoUseholds.
median household income for bottom quartile of incomes and subway fares in nyc (2002-2015)
www.cssny.org
$1.50
$2.00
$2.25
$2.50
$2.75
$0.00
$0.50
$1.00
$1.50
$2.00
$2.50
$3.00
$0
$2,000
$4,000
$6,000
$8,000
$10,000
$12,000
$14,000
2002 2003 2004 2005 2006 2007 2008 2009 2010 2011 2012 2013 2014 2015
Median household income
Subway fare
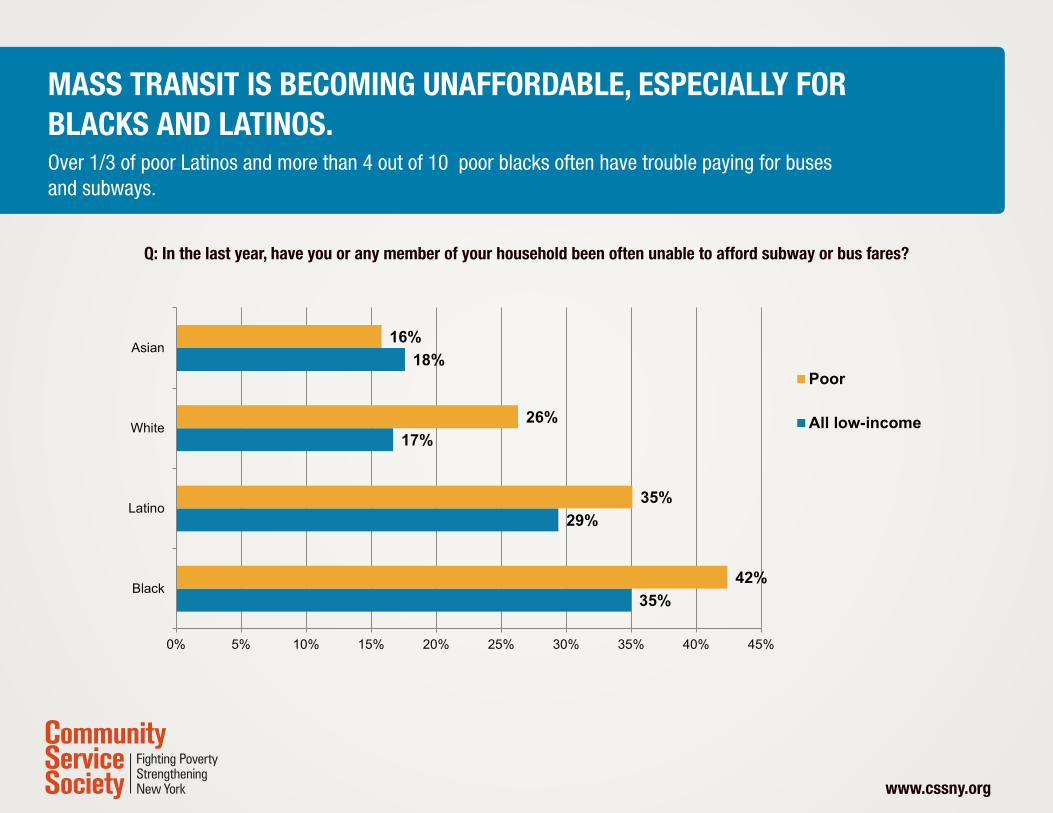
mass TransiT is Becoming UnaffordaBle, especially for Blacks and laTinos. Over 1/3 of poor Latinos and more than 4 out of 10 poor blacks often have trouble paying for buses and subways.
Q: in the last year, have you or any member of your household been often unable to afford subway or bus fares?
www.cssny.org
35%
29%
17%
18%
42%
35%
26%
16%
0% 5% 10% 15% 20% 25% 30% 35% 40% 45%
Black
Latino
White
Asian
Poor
All low-income
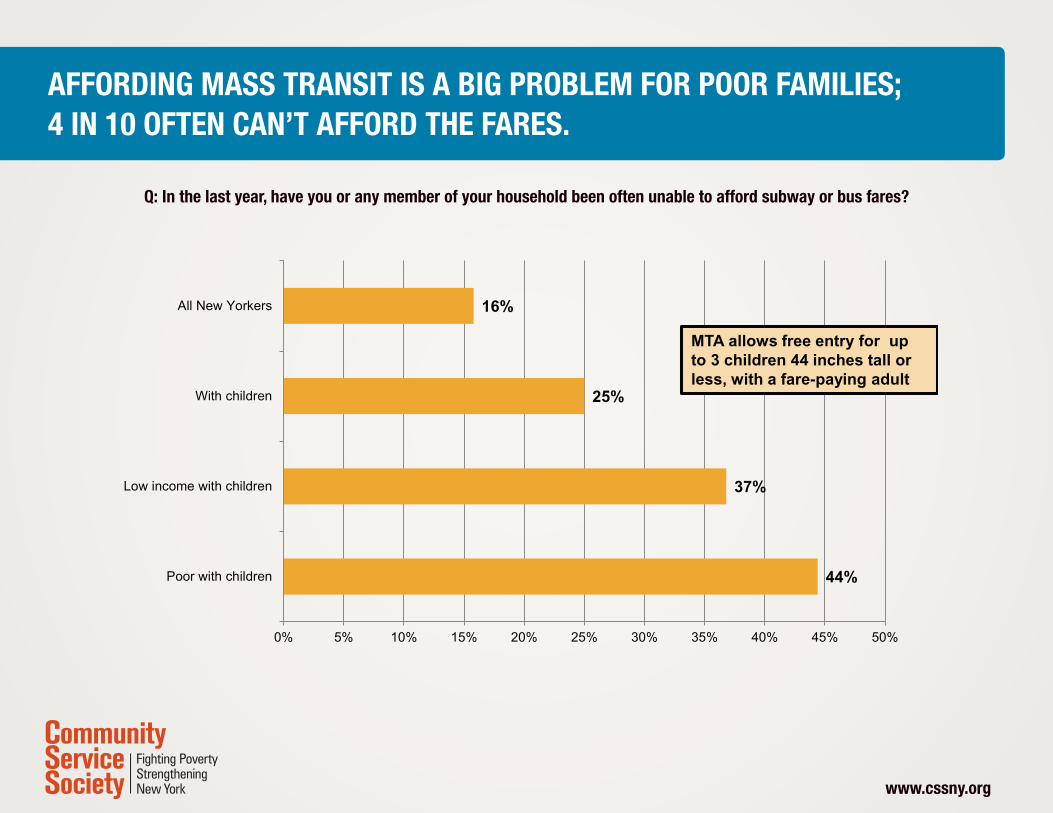
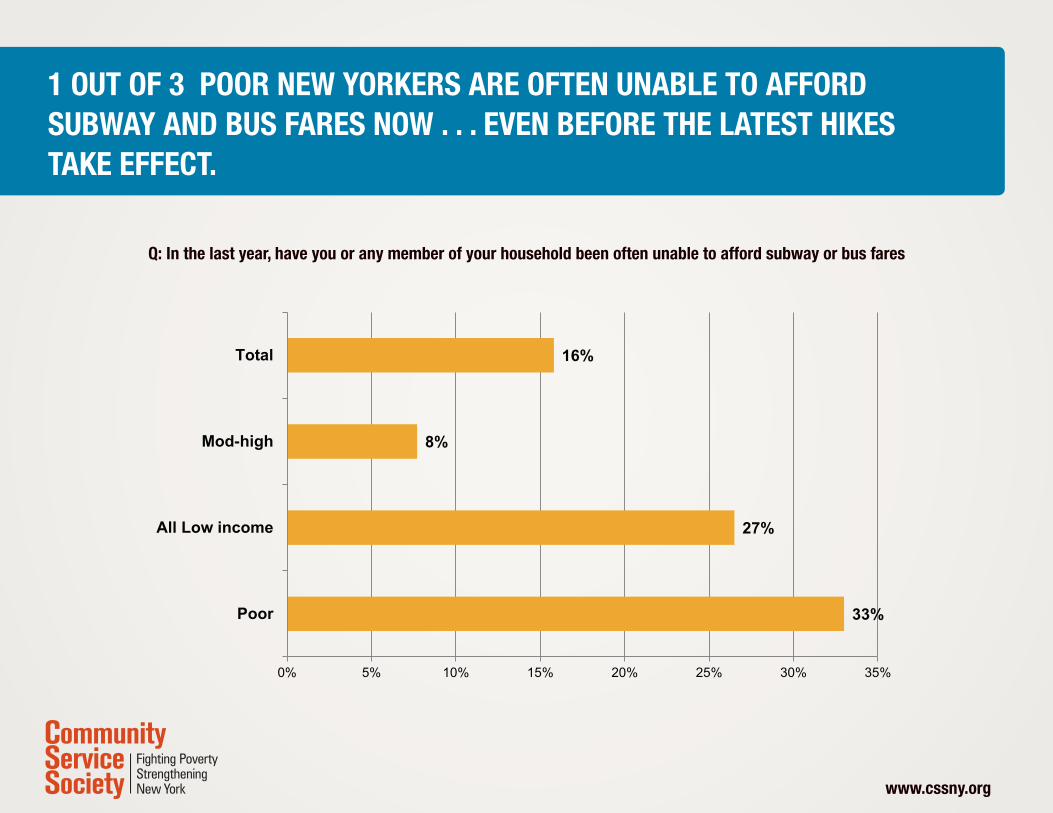
affording mass TransiT is a Big proBlem for poor families; 4 in 10 ofTen can’T afford The fares.
Q: in the last year, have you or any member of your household been often unable to afford subway or bus fares?
www.cssny.org
44%
37%
25%
16%
0% 5% 10% 15% 20% 25% 30% 35% 40% 45% 50%
Poor with children
Low income with children
With children
All New Yorkers
MTA allows free entry for up to 3 children 44 inches tall or less, with a fare-paying adult

3 oUT of 10 of The working poor and more Than a QUarTer of low-income working moms ofTen can’T afford sUBway or BUs fares.
Q: in the last year, have you or any member of your household been often unable to afford subway or bus fares? (employed only)
www.cssny.org
31%
26%
25%
8%
13%
0% 5% 10% 15% 20% 25% 30% 35%
Poor
Low-income mothers
Low-income
Mod-high income
All Employed
Working New Yorkers

low-income Blacks and laTinos are more likely Than low-income new yorkers overall To Use The sUBway or BUs To geT To work.
share of new yorkers who get to work by subway or bus (low-income only) (source: 2013 american community survey)
www.cssny.org
69%
64%
52%
48%
60%
56%
0% 10% 20% 30% 40% 50% 60% 70% 80%
Black
Latino
Asian
White
All low-income
All New Yorkers

and low-income Black and laTino workers are mosT likely To reporT Being UnaBle To afford sUBway and BUs fares.
Q: in the last year, have you or any member of your household been often unable to afford subway or bus fares? (low-income workers only)
www.cssny.org
32%
27%
19%
13%
25%
0% 5% 10% 15% 20% 25% 30% 35%
Black
Latino
Asian
White
All low-income employed
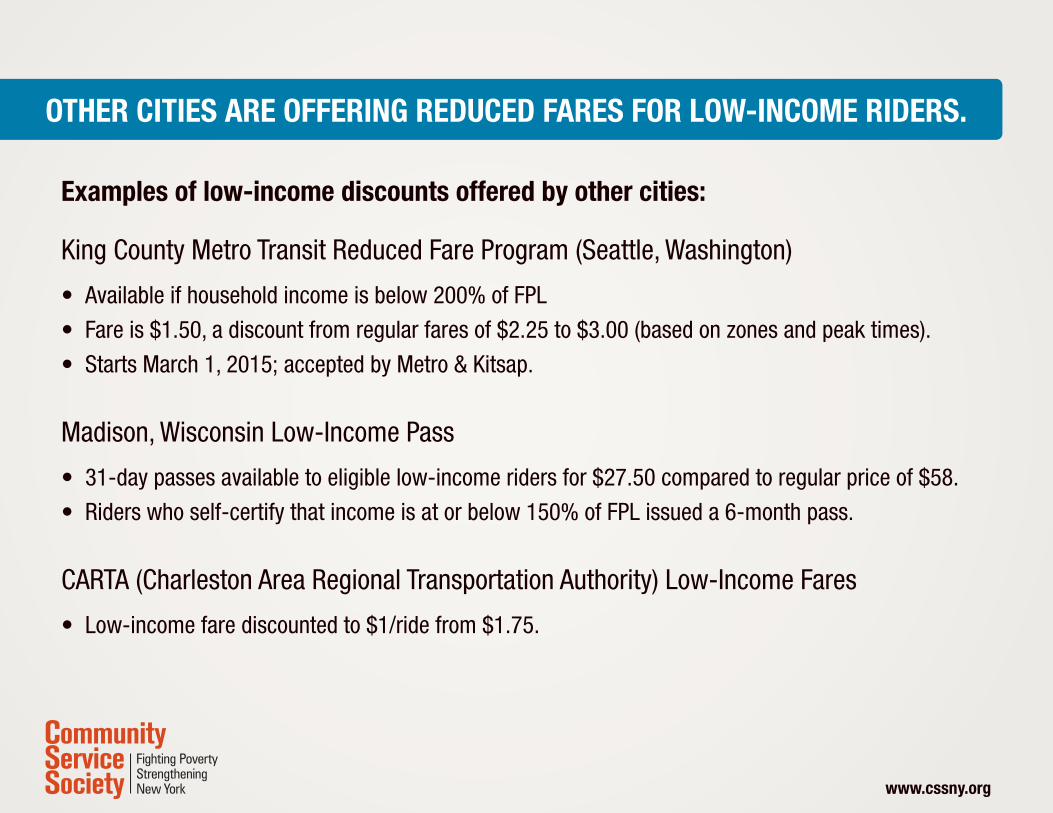
oTher ciTies are offering redUced fares for low-income riders.
examples of low-income discounts offered by other cities:
King County Metro Transit Reduced Fare Program (Seattle, Washington)
• Available if household income is below 200% of FPL
• Fare is $1.50, a discount from regular fares of $2.25 to $3.00 (based on zones and peak times).
• Starts March 1, 2015; accepted by Metro & Kitsap.
Madison, Wisconsin Low-Income Pass
• 31-day passes available to eligible low-income riders for $27.50 compared to regular price of $58.
• Riders who self-certify that income is at or below 150% of FPL issued a 6-month pass.
CARTA (Charleston Area Regional Transportation Authority) Low-Income Fares
• Low-income fare discounted to $1/ride from $1.75.
www.cssny.org

nearly 7 oUT of 10 new yorkers favor offering half-price discoUnTs for low-wage workers; sUpporT is especially sTrong among low-income new yorkers.
Q: do you favor or oppose this step the state could take to help more low-income new yorkers reach the middle class: reduce subway and bus fares to half-price for low-wage workers?
www.cssny.org
72%
43%
55%
83%
58%
69%
8%
22%
16%
13%
36%
26%
-60% -40% -20% 0% 20% 40% 60% 80% 100%
Low income
Mod-high
Total
Favor strong Favor not strong Oppose strong Oppose not strong Unsure

sUpporT for low-income fare discoUnTs crosses parTy lines wiTh 71% of democraTs and 65% of repUBlicans favoring The idea.
Q: do you favor or oppose this step the state could take to help more low-income new yorkers reach the middle class: reduce subway and bus fares to half-price for low-wage workers?
www.cssny.org
48%
50%
61%
55%
65%
65%
71%
69%
25%
19%
14%
16%
33%
31%
24%
26%
-40% -20% 0% 20% 40% 60% 80%
Republicans
Independents
Democrats
Total
Favor strong Favor not strong Oppose strong Oppose not strong
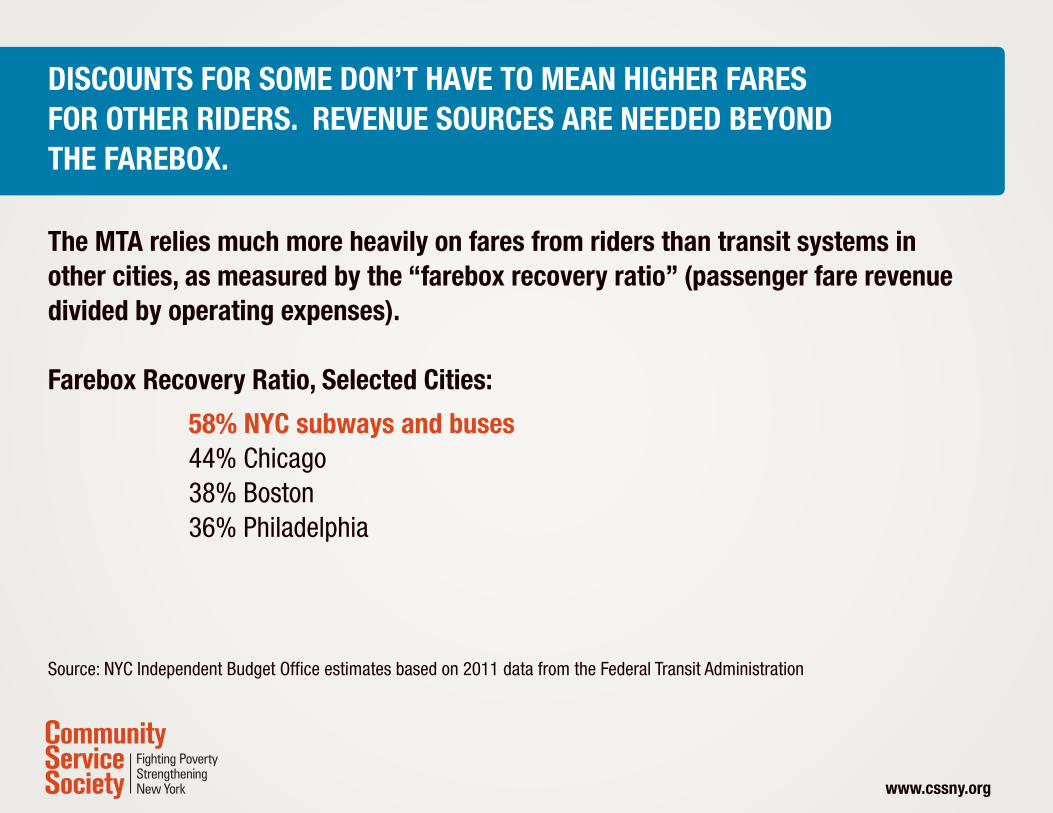
discoUnTs for some don’T have To mean higher fares for oTher riders. revenUe soUrces are needed Beyond The fareBox.
www.cssny.org
The mTa relies much more heavily on fares from riders than transit systems in other cities, as measured by the “farebox recovery ratio” (passenger fare revenue divided by operating expenses).
farebox recovery ratio, selected cities:
58% nyc subways and buses 44% Chicago 38% Boston 36% Philadelphia
Source: NYC Independent Budget Office estimates based on 2011 data from the Federal Transit Administration

how The sUrvey was condUcTed.
www.cssny.org
The Community Service Society designed this survey in collaboration with Lake Research Partners, who administered the survey by phone using professional interviewers. The survey was conducted from July 25th to August 21st, 2014.
The survey reached a total of 1,615 new york city residents, age 18 or older, divided into two samples: • 1006 low-income residents (up to 200% of federal poverty standards, or FPL) comprise the first sample:
�537 poor respondents, from households earning at or below 100% fpl�459near-poor respondents, from households earning 101% - 200% fpl
• 609moderate-andhigher-income residents (above 200% FPL) comprise the second sample:
�410 moderate-income respondents, from households earning 201% - 400% fpl�199higher-incomerespondents, from households earning above 400% fpl.
• This year’s survey also included an oversample of 400 cell phone interviews among adult residents at up to 400% FPL. Telephone numbers for the low income sample were drawn using random digit dial (RDD) among exchanges in census tracts with an average annual income of no more than $40,000. Telephone numbers for the higher income sample were drawn using RDD in exchanges in the re-maining census tracts. The data were weighted slightly by gender, age, region, immigration status, education and race in order to ensure that it accurately reflects the demographic configuration of these populations. In the combined totals respondents in the low income sample were weighted down to reflect their actual proportion among all residents. Also, in the combined totals, the sample is weighted by telephone status. Interviews were conducted in English, Spanish and Chinese. In interpreting survey results, all sample surveys are subject to possible sampling error; that is, the results of a survey may differ from those which would be obtained if the entire population were interviewed. The size of the sampling error depends upon both the total number of respondents in the survey and the percentage distribution of responses to a particular question. The margin of error for the low income com-ponent is +/- 3.1%. The margin of error for the higher income component is +/-4.0%.