Embed Size (px)
Citation preview

CongressionalBudgetOffice
Pressures on DoD’s Budget Over the Next Decade
PresentationattheProfessionalServicesCouncil2016VisionFederalMarketForecastConference
DavidE.MosherAssistantDirectorforNationalSecurity
November16,2016

1C O N G R E S S I O N A L B U D G E T O F F I C E
Outline
• Fiscal Situation
• Implications of Budget Control Act
• Internal Pressures on DoD’s Budget

2C O N G R E S S I O N A L B U D G E T O F F I C E
DeficitsorSurplusesUnderCBO’sBaselineforFY2016
CBO's Baseline Projection
Source: Congressional Budget Office, An Update to the Budget and Economic Outlook: 2016 to 2026 (August 2016), www.cbo.gov/publication/51908.
PercentageofGrossDomesticProduct
-

3C O N G R E S S I O N A L B U D G E T O F F I C E
FederalDebt,Spending,andRevenuesUnderCBO’sExtendedBaselineforFY2016
CBO's Baseline Projection
Source: Congressional Budget Office, The 2016 Long-Term Budget Outlook (July 2016), www.cbo.gov/publication/51580.

4C O N G R E S S I O N A L B U D G E T O F F I C E
ComponentsofFederalSpendingUnderCBO’sExtendedBaselineforFY2016
CBO's Baseline Projection
Source: Congressional Budget Office, The 2016 Long-Term Budget Outlook (July 2016), www.cbo.gov/publication/51580.
PercentageofGDP

5C O N G R E S S I O N A L B U D G E T O F F I C E
Outline
• Fiscal Situation
• Implications of Budget Control Act
• Internal Pressures on DoD’s Budget

6C O N G R E S S I O N A L B U D G E T O F F I C E
CostsofDoD’s2016PlansintheContextoftheBudgetControlAct,asAmended
FYDP = Future Years Defense Program.Source: Congressional Budget Office, Long-Term Implications of the 2016 Future Years Defense Program (January 2016), www.cbo.gov/publication/51050.
Billionsof2016Dollars
1980 1985 1990 1995 2000 2005 2010 2015 2020 2025 20300
100
200
300
400
500
600
700
800
BaseBudget
Base-BudgetPlusOverseasContingencyOperationsFunding
ActualFYDPPeriod
BeyondtheFYDPPeriod
EstimateofBase-BudgetFundingAvailabletoDoD
UndertheBudgetControlActof2011
ProjectionUsingDoD'sCostAssumptions

7C O N G R E S S I O N A L B U D G E T O F F I C E
Outline
• Fiscal Situation
• Implications of Budget Control Act
• Internal Pressures on DoD’s Budget

8C O N G R E S S I O N A L B U D G E T O F F I C E
GrowthinDoD’sInflation-AdjustedBaseBudget,FiscalYears2000and2014Billionsof2014Dollars
2000 20140
100
200
300
400
500
600
Acquisition(25% increase)
Operation and Maintenance(34% increase)
Military Personnel(46% increase)
Other(43% decrease)
MilitaryPersonnel(46%increase)
OperationandMaintenance(34%increase)
Acquisition(25%increase)
Other(43%decrease)
20142000
600
500
400
300
200
100
0
Source: Congressional Budget Office, Growth in DoD’s Budget From 2000 to 2014 (November 2014), www.cbo.gov/publication/49764.

9C O N G R E S S I O N A L B U D G E T O F F I C E
CostsofDoD’s2016PlansbyAppropriationCategory
Billions of 2016 Dollars
FYDP = Future Years Defense Program.Source: Congressional Budget Office, Long-Term Implications of the 2016 Future Years Defense Program (January 2016), www.cbo.gov/publication/51050.

10C O N G R E S S I O N A L B U D G E T O F F I C E
PressureinEachoftheThreeMajorCategoriesoftheDefenseBudget
■ Costsofdevelopingandbuyingweaponshavebeen,onaverage,20percentto30percenthigherthanDoD’s initialestimates
■ Costsforcompensationofmilitarypersonnel—includingtheiractiveandretiredhealthcarebenefits—havebeenrapidlyincreasingsince2000
■ Costsofoperationandmaintenanceperactive-dutyservicememberhavebeensteadilyincreasingsinceatleast1980,withoutincludingthecostofthewarsinIraqandAfghanistan
ThemismatchbetweenDoD’sFYDPplansandtheBudgetControlActcapsisexacerbatedbytheseinternalpressuresin
DoD’sbudget

11C O N G R E S S I O N A L B U D G E T O F F I C E
ExampleofBudgetaryPressureinAcquisition:TheNavy’sShipbuildingProgram
■ CBOestimatesthatthe2016shipbuildingplanwillcostmorethantheNavyestimates
■ TheNavy’s2016planwouldfallshortofmeetingtheservice’sinventorygoalforsometypesofships
■ Historicalaveragefundingwouldbeinsufficienttopayforthe2016planAverageAnnualCostofNew-ShipConstructionUndertheNavy’s2016Plan
Source: Congressional Budget Office, An Analysis of the Navy’s Fiscal Year 2016 Shipbuilding Plan (October 2015), www.cbo.gov/publication/50926.

12C O N G R E S S I O N A L B U D G E T O F F I C E
ExampleofBudgetaryPressureinMilitaryPersonnel:PayandBenefits
■ Annualincreasesinmilitarybasicpayexceededthepercentageincreaseintheemploymentcostindex(ECI)byatleast0.5%foreachoftheyearsbetween2001and2010– BasicpayraisesthenequaledECIfor2011through2013– Inthelastthreeyears(2014–2016)basicpayraisewasbelowtheECI
■ DoD estimatesthatcashcompensationforenlistedmilitarypersonnelexceedsthatof90percentofworkerswithsimilareducationandyearsofexperience– Noncashcompensation(includinghealthcareandother)makesthatgap
larger
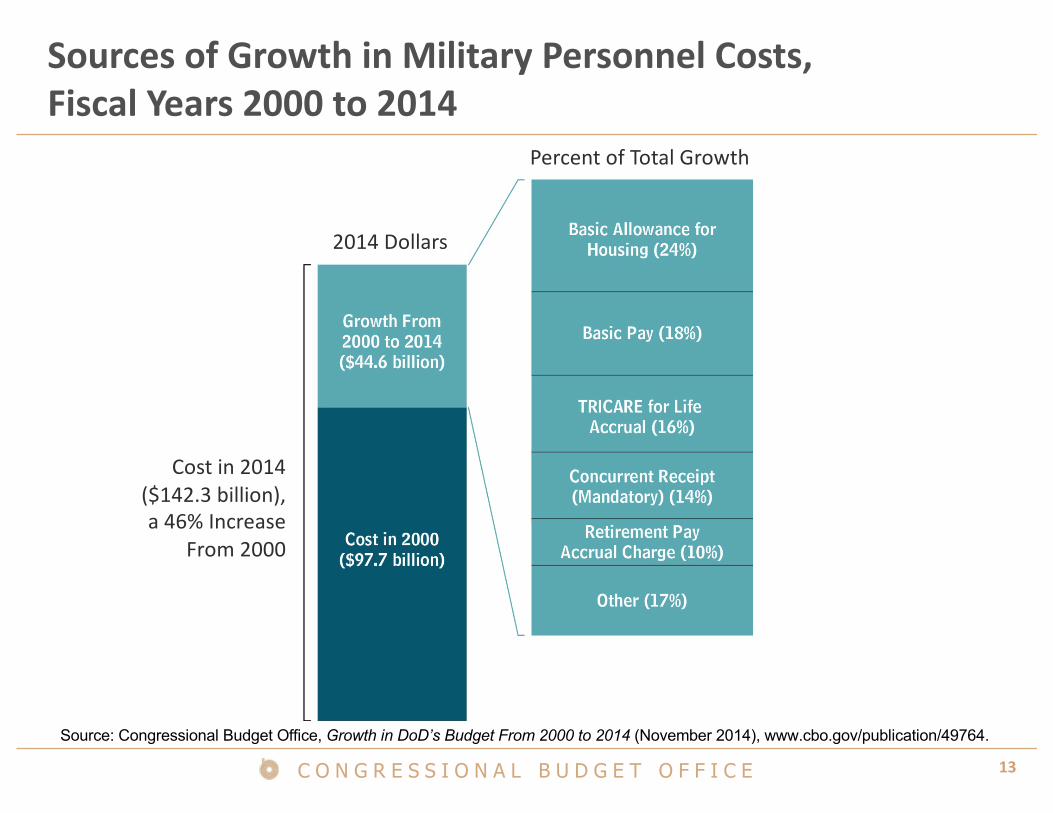
13C O N G R E S S I O N A L B U D G E T O F F I C E
2014Dollars
PercentofTotalGrowth
SourcesofGrowthinMilitaryPersonnelCosts,FiscalYears2000to2014
Costin2014($142.3billion),a46%Increase
From2000
Source: Congressional Budget Office, Growth in DoD’s Budget From 2000 to 2014 (November 2014), www.cbo.gov/publication/49764.

14C O N G R E S S I O N A L B U D G E T O F F I C E
ExampleofBudgetaryPressureinOperationandMaintenance:O&MperActive-DutyServiceMember
■ O&MpaysformostDoDcivilians’salaries,goodsandservices(belowprocurementthresholds),fuel,maintenance, contractorservices,etc.
■ Comparedwiththeprewar(1980–2001)trend,DoD’s2016FYDP:– Rises$300peryearfaster– Is$20,000perpersonhigherin2020
FYDP = Future Years Defense Program.Source: Congressional Budget Office, Long-Term Implications of the 2016 Future Years Defense Program (January 2016), www.cbo.gov/publication/51050.

15C O N G R E S S I O N A L B U D G E T O F F I C E
SourcesofGrowthinOperationandMaintenanceCosts,FiscalYears2000to2014
(101%Growth)
2014Dollars
PercentofTotalGrowth
Costin2014($193.5billion),a34%Increase
From2000 (22%Growth)
Source: Congressional Budget Office, Growth in DoD’s Budget From 2000 to 2014 (November 2014), www.cbo.gov/publication/49764.

16C O N G R E S S I O N A L B U D G E T O F F I C E
OperationandMaintenance(O&M)Fundinginthe2012BaseBudget
RemainingO&M
CivilianCompensation
Fuel
DefenseHealthProgram
DHP = Defense Health Program; WCF = working capital fund.Source: Derek Trunkey, Analyst, Congressional Budget Office, “Trends in Operation and Maintenance Spending by the Department of Defense” (presentation to the 91st Annual Conference of the Western Economic Association International, Portland, Oregon, July 1, 2016),www.cbo.gov/publication/51731.

17C O N G R E S S I O N A L B U D G E T O F F I C E
PurchasesFundedThroughOperationandMaintenance(O&M)inthe2012BaseBudget
Billionsof2012Dollars TotalBase-BudgetO&M:$198billionActivity
Forces(27.3)
SupportandIndividualTraining(71.5)
Administration(33.1)
Infrastructure(34.7)
HealthCare(31.4)
Property(4.3)
CivilianCompensation,
Non-WCF(53.6)
Services(91.9)
Goods(33.3)
CommodityClass
DomesticCivilians
ForeignNationalCivilians
Provider
OtherGovernmentAgencies(4.2)
WorkingCapitalFunds
(37.6)
PrivateSector(87.7)
DoDCivilians(53.6)
Classified(14.8)
WCF= workingcapitalfund.
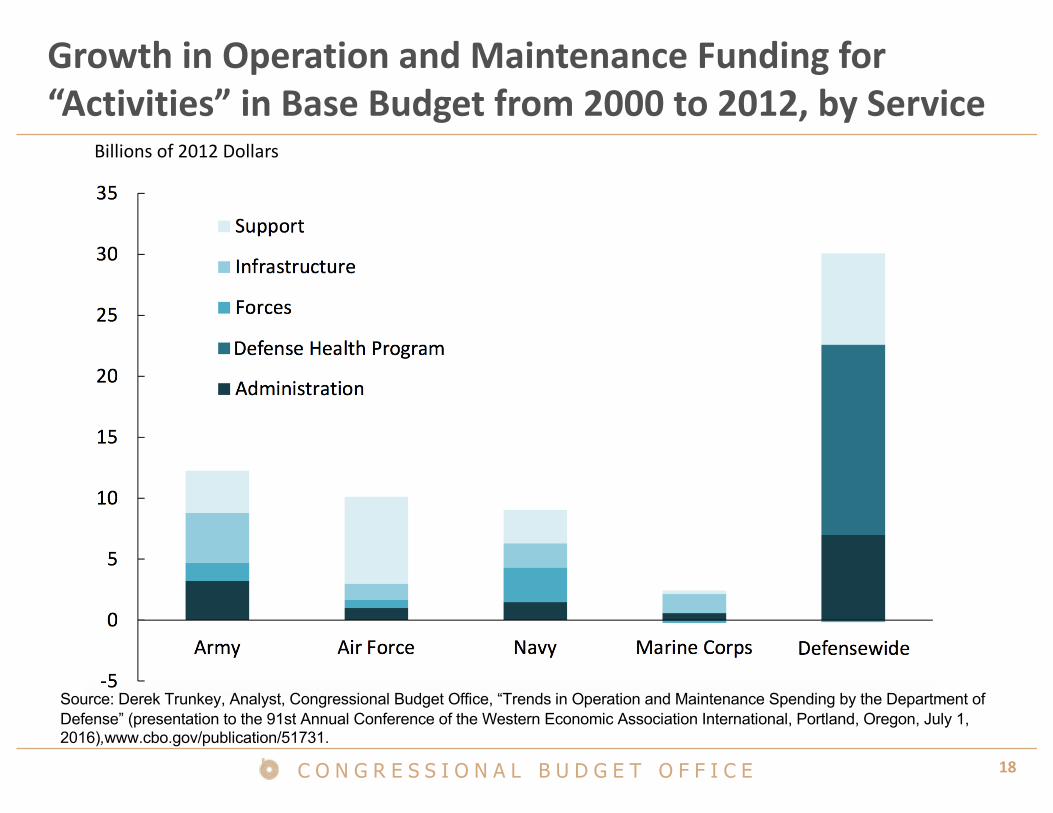
18C O N G R E S S I O N A L B U D G E T O F F I C E
GrowthinOperationandMaintenanceFundingfor“Activities”inBaseBudgetfrom2000to2012,byService
Billionsof2012Dollars
Source: Derek Trunkey, Analyst, Congressional Budget Office, “Trends in Operation and Maintenance Spending by the Department of Defense” (presentation to the 91st Annual Conference of the Western Economic Association International, Portland, Oregon, July 1, 2016),www.cbo.gov/publication/51731.


