Embed Size (px)
Citation preview

Myanmar’s first Ci zen’s Budget for 52 years!Category: News
converted by Web2PDFConvert.com

f Share Tweet 0 Share 0
Category: News04/12/2015
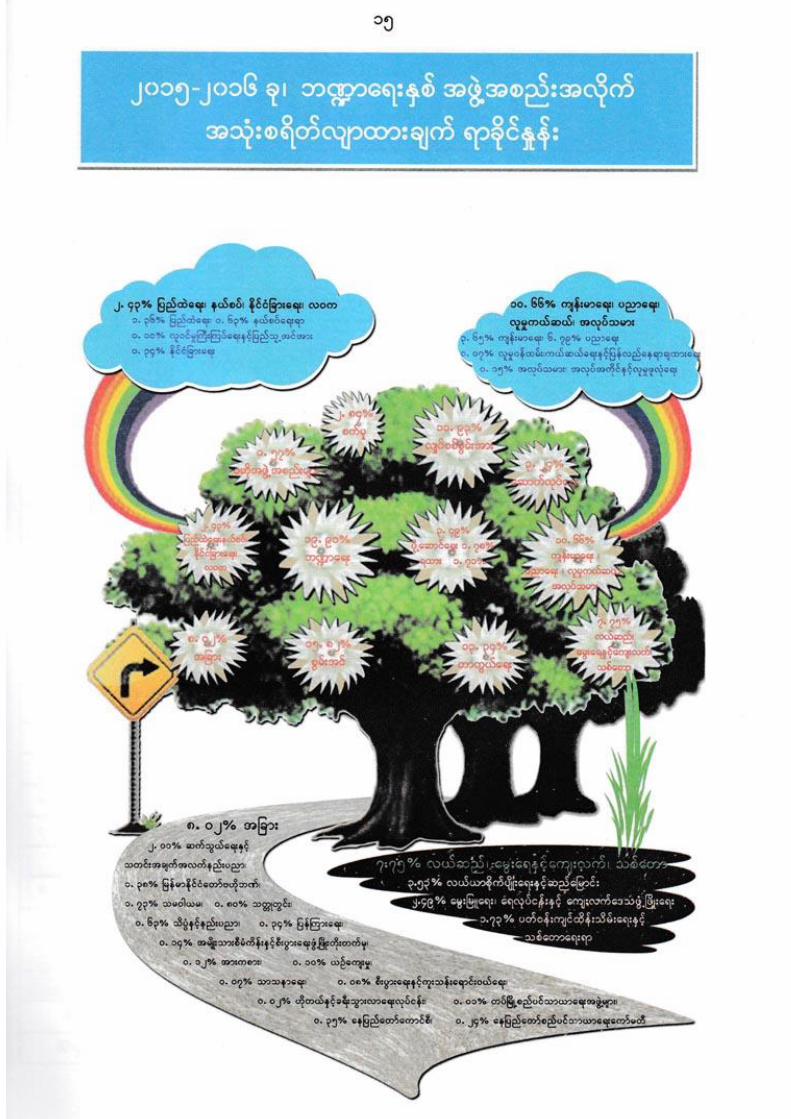
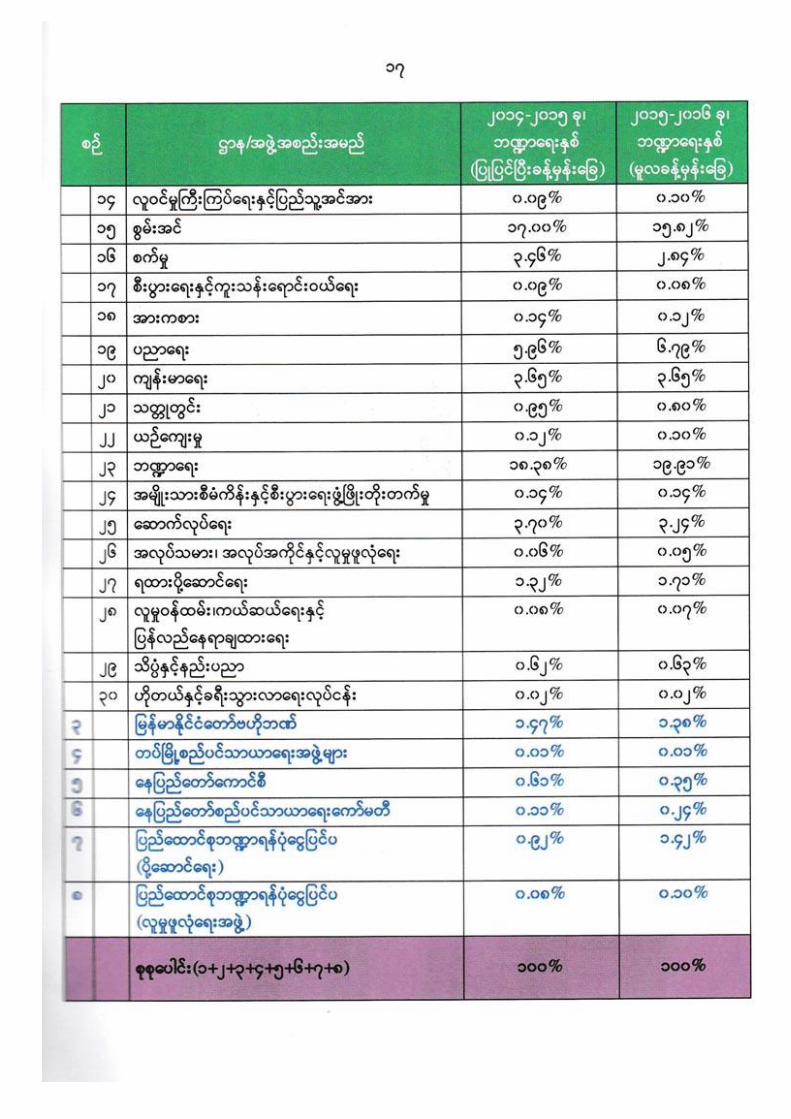
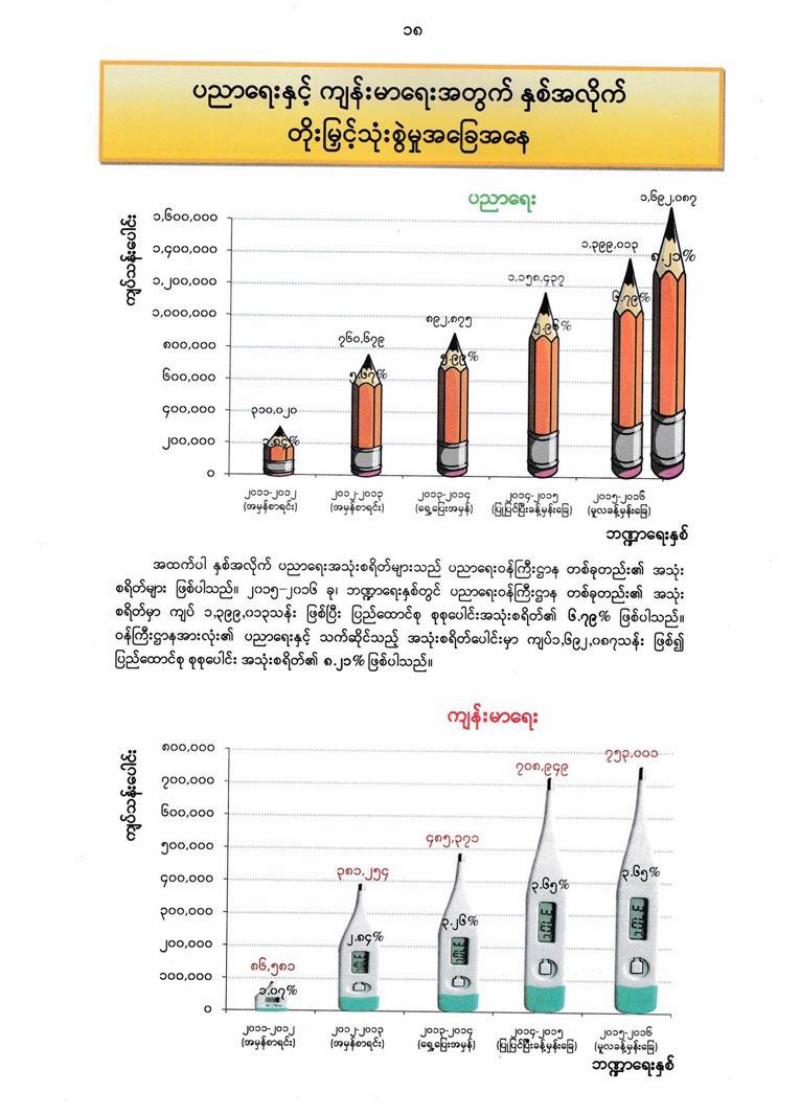
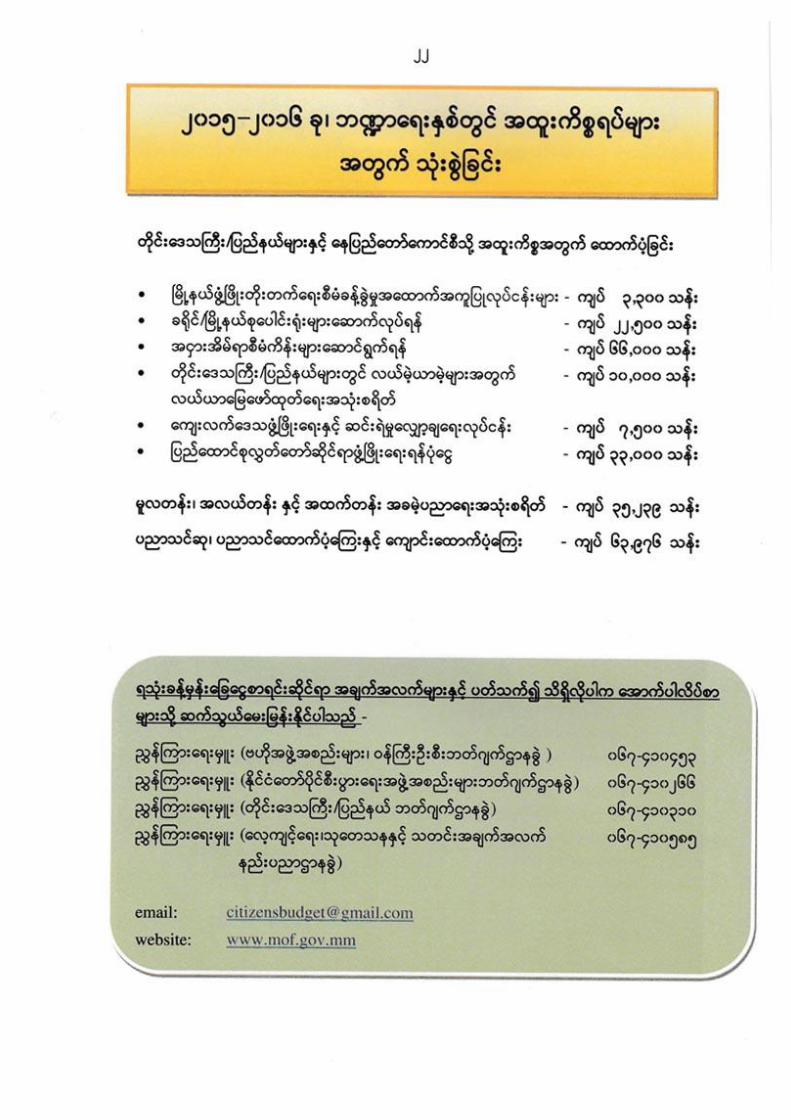
On 30 November, Spectrum received the Myanmar government’s 2015-16Citizen’s Budget as part of the Ministry of Finance’s public distribution of5,000 copies.
To the best of our knowledge, the last Citizen’s Budget in Myanmar wasreleased in 1963-64 – more than five decades ago.
Spectrum is delighted that a Citizen’s Budget has been released. Togetherwith UNICEF, our team developed a companion guide to the Citizen’sBudget called “Budget Guides for Growing Citizens” to support theintroduction of national financial management to school students. The logicis that it is never too early to teach active citizen’s about their economicand social rights and about financial transparency and accountability.
As the young girl character in the cartoon books voices: “now I understandthat the nation’s wealth is our money!” Informed citizens will be the keydriver for national transparency and accountability.
In the chapter on "National Budget Transparency" in the 2012-2105Framework for Economic and Social Reform (FESR), budgets are discussedas a critical link for citizen participation in democratic processes of nationaldevelopment. It highlights that “international experience certainly showsthat civil society engagement can significantly improve budget processes,decisions and outcomes and thus transform the lives of people.”
It continues “international experience also demonstrates the criticalimportance of at least eight key budget documents being released to thepublic and made available for discussion, namely the pre-budget statement,executive’s budget proposal, enacted budget, Citizens’ Budget or guide tothe budget for citizens, in-year reports, mid-year review, end-year report,and audit report.”
As a quick win, in the FESR the government committed to “considerpreparing, publishing and making easily accessible for citizens as many ofthese reports as possible.” For Myanmar the public availability of a Citizen’sBudget represents special progress. The government has actually producedsix of the eight key budget documents, but they have not been released orpublished in an accessible or timely way.
Timely public release of budget reports can greatly improve Myanmar’sOpen Budget Survey. Myanmar scored 0 out of 100 in 2012 and 2 out of 100in the 2015 survey. Despite these low scores, very rapid improvement ispossible. A good example of “timely release” seems to be Myanmar’s firstExtractive Industries Transparency Initiative (EITI) report. The draft reportwas made available to representative civil society groups on 8 December, inadvance of discussion in the Multi-stakeholder Group (MSG) on 18December. It is due to be published and submitted to the EITI Secretariatby 1 January 2016.
Download the 2015-16 Citizen's Budget in Myanmar language here.
Contact UsSign Up For Updates
JobsSite Map
Commercial ActivitiesSpecialist Services
Like 0
ShareShare
converted by Web2PDFConvert.com

Photo Credits
Spectrum SDKNNo 9C Myaynigone Plaza
Yangon, MyanmarPhone: +95-1-516941
Wild Dog Design Powered by KnowledgeArc
converted by Web2PDFConvert.com


Home » Citizens to suffer from incoming inflation due to budget deficits
Citizens to suffer from incoming inflation due to budget deficitsSubmitted by whtut on Tue, 05/26/2015 - 17:30
Record breaking budget deficit ever for Myanmar has shown itself in what is the final fiscal year under the current government administration.
However, yearly plan of increasing and allotting more budget to different ministries by the President is likely to happen and experts have forecasted an evenbigger budget deficit on the way which will flow into the inflation problem and further damaging the lives of the citizens.
The worries were expressed at post budget meeting for the 2015-2016 fc, jointly held by National Economics and Social Advisory Council (NESAC), ActionAid Council and Union of Myanmar Federation of Chambers of Commerce and Industry.
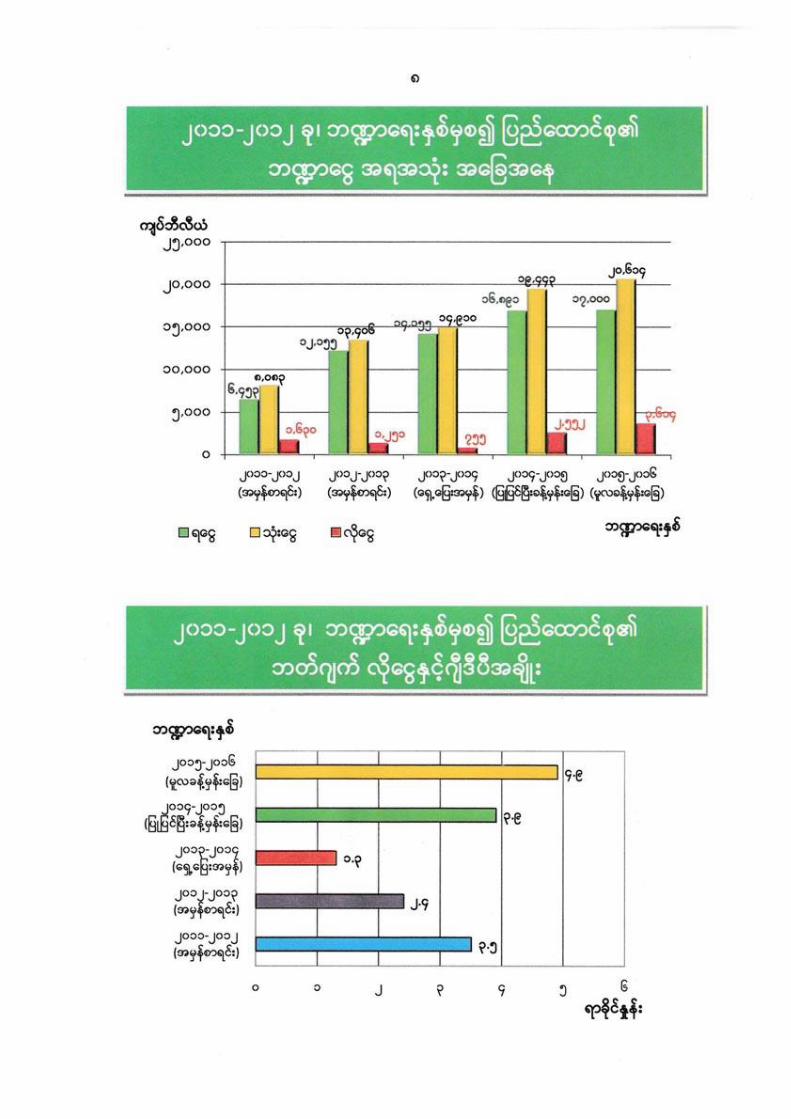
When the current administration took charge, the fc year of 2011-2012 saw a trade deficit of Ks 215.9 billion compared to the 2014-2015 fc of Ks 2751billion. Additional budget was requested, contributing to the already high deficit numbers, rocking it up and over Ks 3600 billion.
The government under the leadership of President Thein Sein saw around 12,000 billion Kyats worth of budget deficit, causing the inflation and price hikes tohappen.
“In addition to drawing the budget with the deficits, permission by the President has been granted to allot more budget yearly around October and November.At this point, since there are no solutions on how to finance those allotments, it shows only deficit. Looking at the 2014-2015 fiscal year and its deficit of 2751billion, it can be taken that the deficit is actually at 3754 billion due to the additional imbursement of Ks 1001 billion. This year, the same thing during Octoberand November will likely happen again, increasing the budget deficit again. Are these matters not going to be discussed in the Parliament?” said EconomistZawPhay Win.
He went on to comment that even though the government is allowing many requests to increase the budget but the yearly budget deficits have not beenreported regularly.
A representative of the National League for Democracy, Sandar Min, has said that departments such as the Ministry of Construction which deals in importingitems using foreign currency, will likely ask for more budget as well.
There have been many concerns that since the year 2015-2016 will be when the General Elections will be held and that the extra budget will be used toinfluence voters.
Political Analyst Kyaw Lin Oo had said his that it is an international practice that parties vying for control will use the citizen’s budget as means to fuel theirvotes and that the budget for essential operations such as humanitarian works, loans, paving of roads and providing electricity will be used for votes.
“When elections are near, governments have the practice of using a lot of the budget to get votes and popularity with the public. It is that way in theinternational community. If I were to pinpoint, we can say Thailand does things like asking for increase in the loan limits for farmers and peasants. Theparliament is extremely important at this time. How will the Budget Review Joint Committee control the situation? It is important that foul plays do not happen.To speak simply, since this is the last year of rule for the current government, they are asking for more budgets,” said Kyaw Lin Oo.
He goes on “In 2016-2017, the new ministers will have to report regarding 2015-2016 budget. When it has been reported and inappropriate activities werefound, actions need to be taken.”
Main Menu
converted by Web2PDFConvert.com

Copyright © 2016, Eleven Myanmar
converted by Web2PDFConvert.com

Myanmar's Budget System Reform
(Considering Japanese Experiences)
Aung Myat Kyaw
Budget Department
Ministry of Finance in Myanmar
12th, November, 2015
Policy Research Institute
Ministry of Finance in Japan1

Content
I. Myanmar’s Budget System Situation
II. Myanmar’s Budget Decentralization
III. Overview of the Japanese Budget SystemIII. Overview of the Japanese Budget System
IV. Japan’s Fiscal Decentralization
V. Findings and Recommendations
2
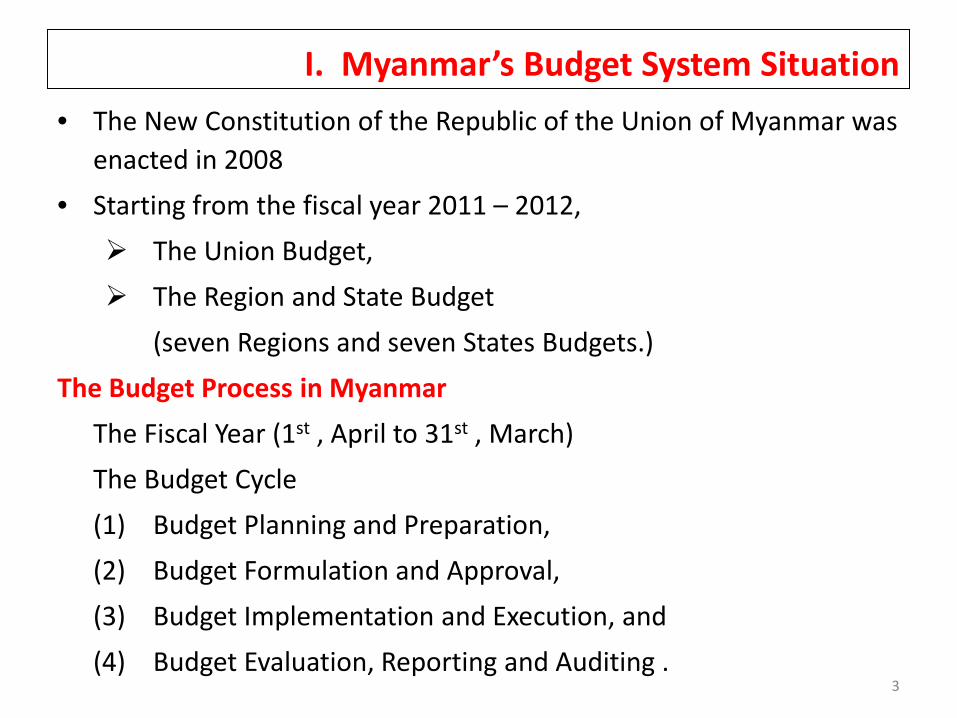
I. Myanmar’s Budget System Situation
• The New Constitution of the Republic of the Union of Myanmar was
enacted in 2008
• Starting from the fiscal year 2011 – 2012,
The Union Budget,
The Region and State Budget
(seven Regions and seven States Budgets.)
The Budget Process in Myanmar
The Fiscal Year (1st , April to 31st , March)
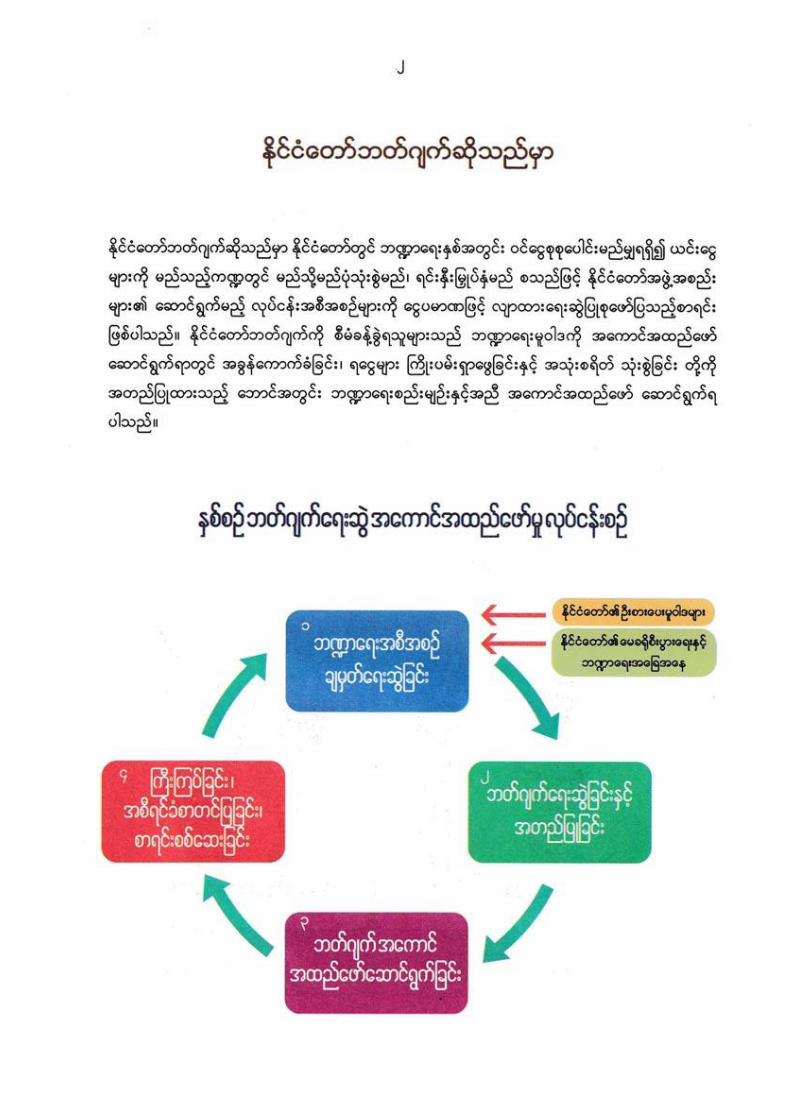
The Budget Cycle
(1) Budget Planning and Preparation,
(2) Budget Formulation and Approval,
(3) Budget Implementation and Execution, and
(4) Budget Evaluation, Reporting and Auditing .3

I. Myanmar’s Budget System Situation
Overview of the Macroeconomic and Budget Trends
Real GDP growth from 2003 to 2015 in Myanmar
10.0%
12.0%
14.0%
16.0%
4
2003 2004 2005 2006 2007 2008 2009 2010 2011 2012 2013 2014* 2015*
Growth Rate 13.8% 13.6% 13.6% 13.1% 12.0% 3.6% 5.1% 5.3% 5.6% 7.3% 8.4% 8.5% 8.5%
0.0%
2.0%
4.0%
6.0%
8.0%
*Estimate
Source: IMF, World Economic Outlook Database, October, 2015.
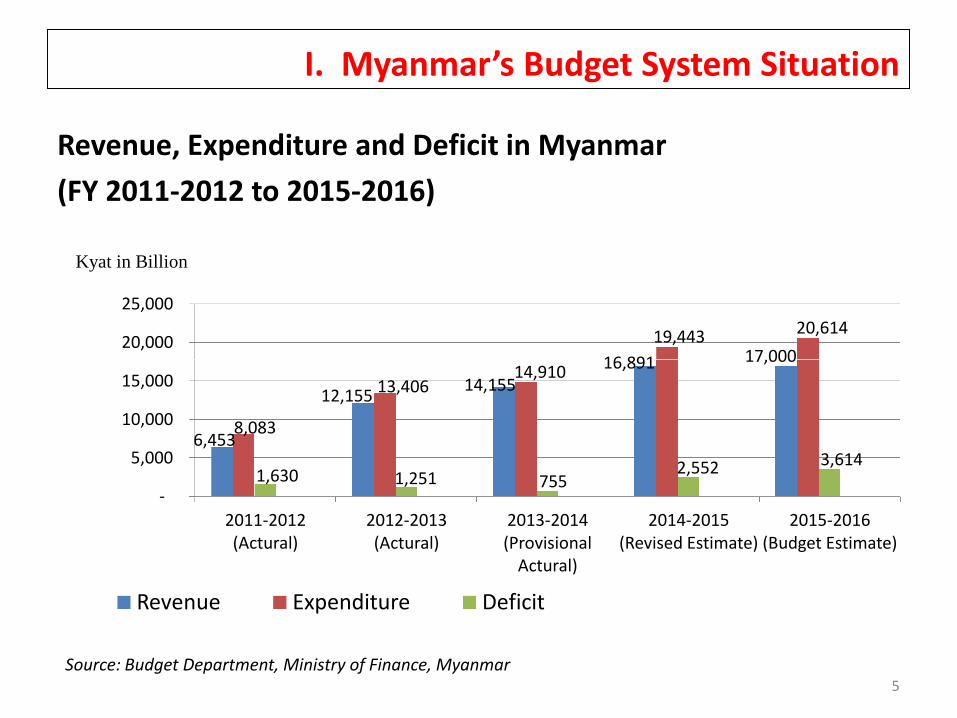
I. Myanmar’s Budget System Situation
Revenue, Expenditure and Deficit in Myanmar
(FY 2011-2012 to 2015-2016)
16,891 17,00019,443 20,614
20,000
25,000
Kyat in Billion
5
Source: Budget Department, Ministry of Finance, Myanmar
6,453
12,15514,155
16,891 17,000
8,083
13,40614,910
1,630 1,251 7552,552 3,614
-
5,000
10,000
15,000
2011-2012(Actural)
2012-2013(Actural)
2013-2014(Provisional
Actural)
2014-2015(Revised Estimate)
2015-2016(Budget Estimate)
Revenue Expenditure Deficit
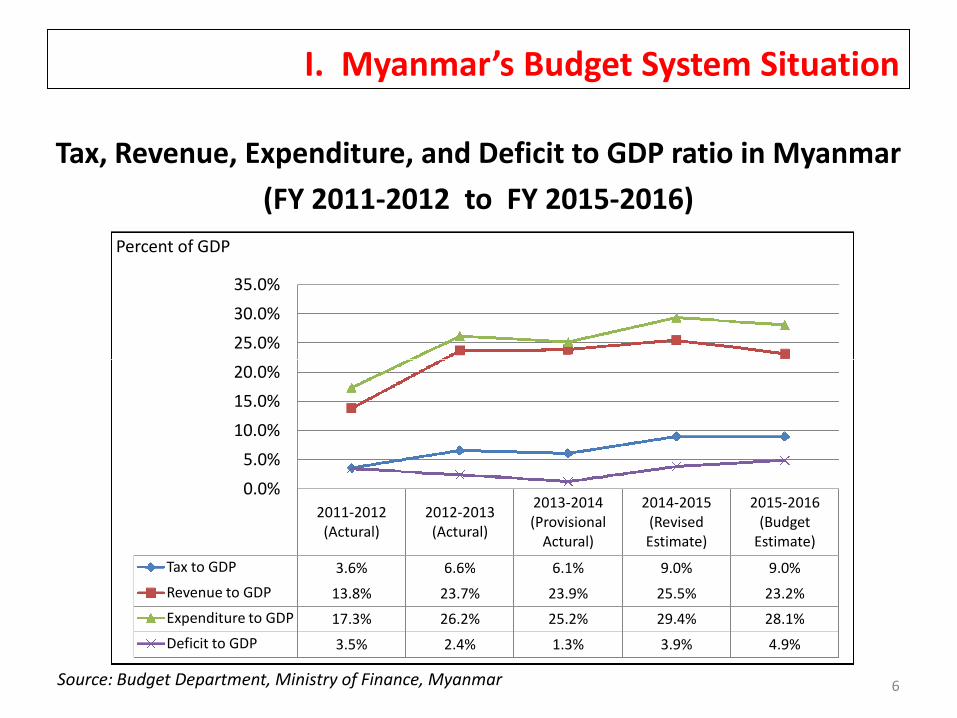
I. Myanmar’s Budget System Situation
Tax, Revenue, Expenditure, and Deficit to GDP ratio in Myanmar
(FY 2011-2012 to FY 2015-2016)
25.0%
30.0%
35.0%
Percent of GDP
6Source: Budget Department, Ministry of Finance, Myanmar
2011-2012(Actural)
2012-2013(Actural)
2013-2014(Provisional
Actural)
2014-2015(RevisedEstimate)
2015-2016(Budget
Estimate)
Tax to GDP 3.6% 6.6% 6.1% 9.0% 9.0%
Revenue to GDP 13.8% 23.7% 23.9% 25.5% 23.2%
Expenditure to GDP 17.3% 26.2% 25.2% 29.4% 28.1%
Deficit to GDP 3.5% 2.4% 1.3% 3.9% 4.9%
0.0%
5.0%
10.0%
15.0%
20.0%
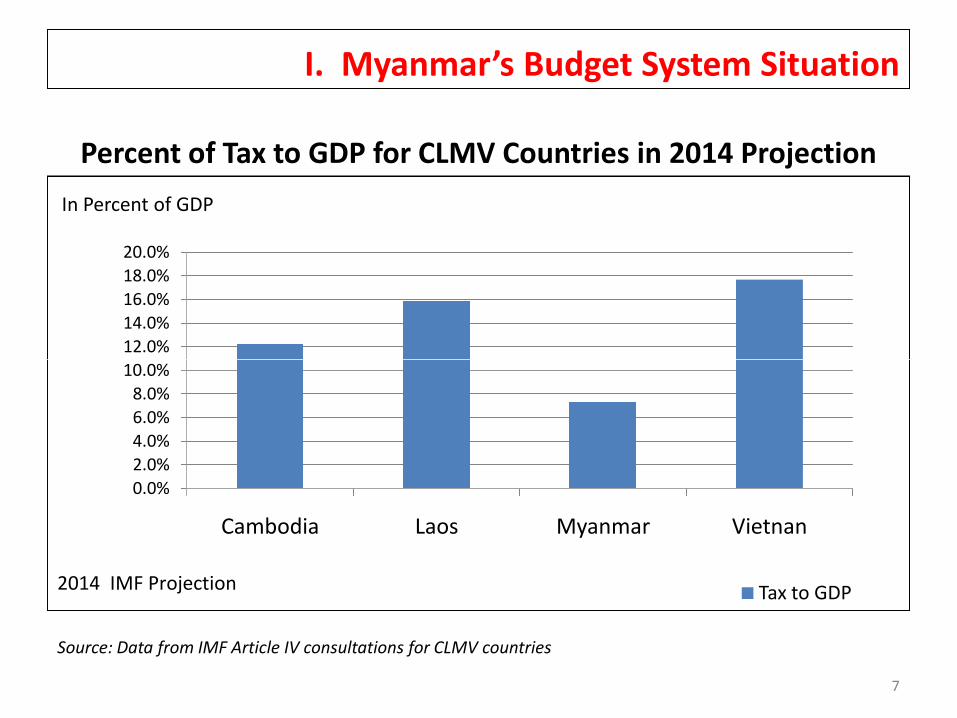
I. Myanmar’s Budget System Situation
Percent of Tax to GDP for CLMV Countries in 2014 Projection
10.0%
12.0%
14.0%
16.0%
18.0%
20.0%
In Percent of GDP
7
Source: Data from IMF Article IV consultations for CLMV countries
0.0%
2.0%
4.0%
6.0%
8.0%
10.0%
Cambodia Laos Myanmar Vietnan
Tax to GDP2014 IMF Projection
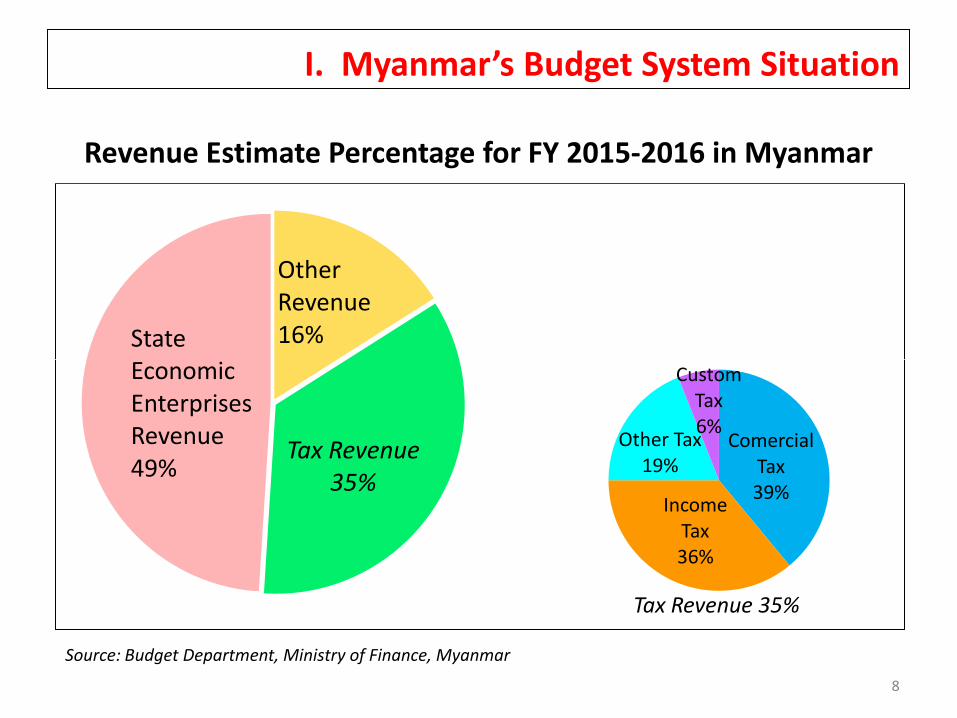
OtherRevenue16%State
Economic
I. Myanmar’s Budget System Situation
Revenue Estimate Percentage for FY 2015-2016 in Myanmar
Tax Revenue35%
EconomicEnterprisesRevenue49%
8
ComercialTax39%
IncomeTax36%
Other Tax19%
CustomTax6%
Tax Revenue 35%
Source: Budget Department, Ministry of Finance, Myanmar

I. Myanmar’s Budget System Situation
Types of Tax in Myanmar
(1) Taxes on domestic products and people's consumption (excise
duty, commercial tax, license fees on imported goods, state
lottery, taxes on transport, and sales proceeds of stamp);
(2) Taxes on income and property (income tax);(2) Taxes on income and property (income tax);
(3) Customs (custom duty) and
(4) Taxes from usage of national property (tax on land, water tax
and embankment tax, tax on extraction of forest produces, tax
on extraction of mineral and gem, tax on communication
services, tax on power generation of electricity)
9

I. Myanmar’s Budget System Situation
Percent of Total Expenditure Trends by Ministries FY 2011 to FY 2015
10
Source: Budget Department, Ministry of Finance, Myanmar
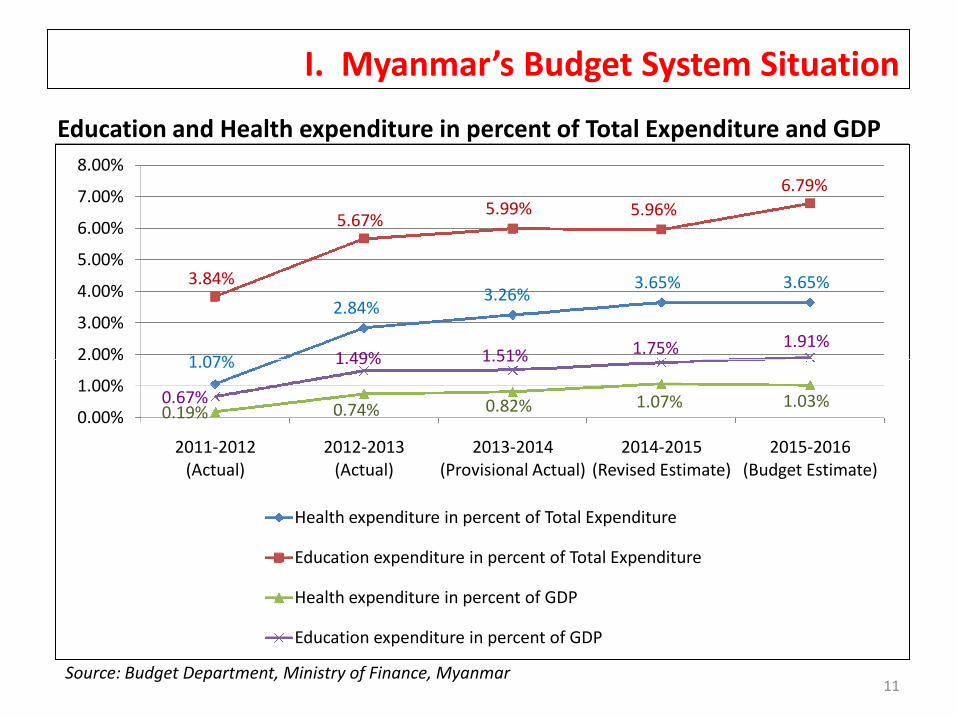
I. Myanmar’s Budget System Situation
Education and Health expenditure in percent of Total Expenditure and GDP
1.07%
2.84%3.26%
3.65% 3.65%3.84%
5.67%5.99% 5.96%
6.79%
1.49% 1.51% 1.75% 1.91%2.00%
3.00%
4.00%
5.00%
6.00%
7.00%
8.00%
11
1.07%
0.19% 0.74% 0.82% 1.07% 1.03%0.67%
1.49% 1.51%
0.00%
1.00%
2.00%
2011-2012(Actual)
2012-2013(Actual)
2013-2014(Provisional Actual)
2014-2015(Revised Estimate)
2015-2016(Budget Estimate)
Health expenditure in percent of Total Expenditure
Education expenditure in percent of Total Expenditure
Health expenditure in percent of GDP
Education expenditure in percent of GDP
Source: Budget Department, Ministry of Finance, Myanmar
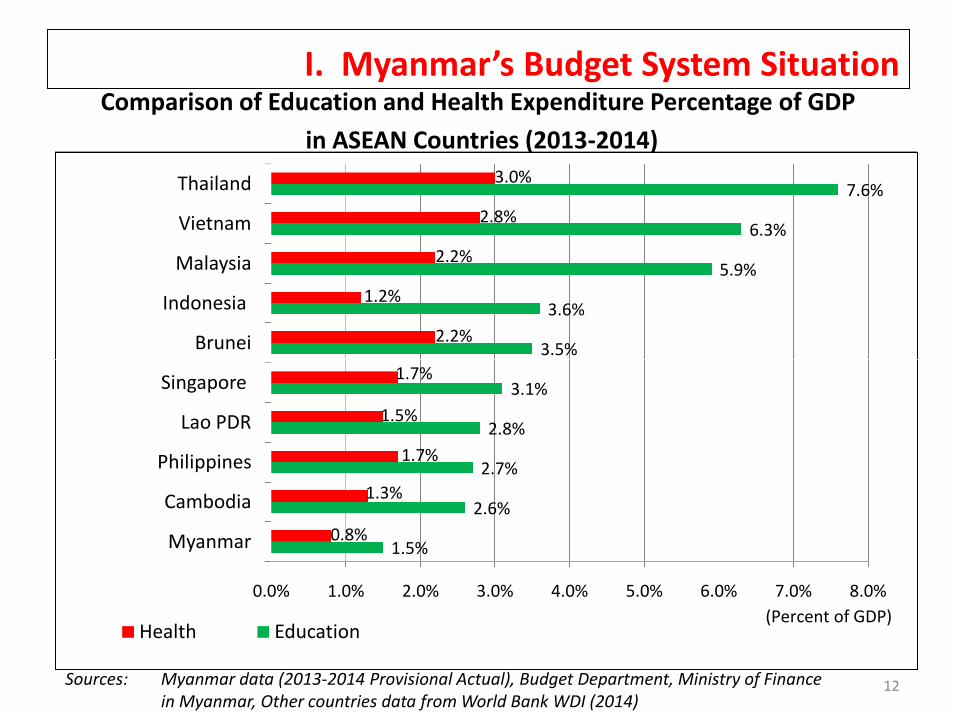
I. Myanmar’s Budget System SituationComparison of Education and Health Expenditure Percentage of GDP
in ASEAN Countries (2013-2014)
3.5%
3.6%
5.9%
6.3%
7.6%
2.2%
1.2%
2.2%
2.8%
3.0%
Brunei
Indonesia
Malaysia
Vietnam
Thailand
12Sources: Myanmar data (2013-2014 Provisional Actual), Budget Department, Ministry of Financein Myanmar, Other countries data from World Bank WDI (2014)
1.5%
2.6%
2.7%
2.8%
3.1%
3.5%
0.8%
1.3%
1.7%
1.5%
1.7%
0.0% 1.0% 2.0% 3.0% 4.0% 5.0% 6.0% 7.0% 8.0%
Myanmar
Cambodia
Philippines
Lao PDR
Singapore
Health Education(Percent of GDP)

I. Myanmar’s Budget System Situation
Foreign Grants and Loans for Yearly (FY 2011-2012 to FY 2015-2016)
329,387
3,263
146,480
9,917
223
2013-2014
2012-2013(Actual)
2011-2012(Actual)
Foreign Grants
Foreign Loans
13
Source: Treasury Department, Ministry of Finance, Myanmar
1,378,410
637,792
457,832
344,925
305,143
146,480
- 400,000 800,000 1,200,000 1,600,000
2015-2016(Budget Estimate)
2014-2015(Revised Estimate)
2013-2014(Provisional Actual)
(Million Kyat)

I. Myanmar’s Budget System Situation
Outstanding Debt in Myanmar for (FY 2011-2012 to FY 2015-2016)
6,335
7,301
9,561
9,31115,000
20,000
25,000
(Billion Kyat)( *) Debt to GDP ratio
( *34.9%)
( *30.0%)
( *35.3%)
( *36.4%)
14Source: Treasury Department, Ministry of Finance, Myanmar
9,938 10,82412,014
10,617
6,335
-
5,000
10,000
2011-2012 2012-2013 2013-2014 2014-2015(As 31.12.2014)
Foreign Debts Domestic Debts

I. Myanmar’s Budget System Situation
Medium-term Fiscal Framework (MTFF) in Myanmar
In 2014, Myanmar introduced the Medium-term Fiscal Framework.
Followed by the program of Public Finance Management reform in Myanmar.
Improved incremental to policy based.
Objectives
15
To achieve the higher budget credibility
Foster fiscal discipline for macro-fiscal discipline – deficit control
Improve strategic resource allocation strategy by providing expenditure ceilings to agencies
(including states and region grants) through a top down budget framework (medium term)
based on available resources
Practice top-down budgeting and bottom-up planning to be in line with the international
standard - base on government policy

I. Myanmar’s Budget System Situation
Promote Social Service Delivery
• Provide free education for primary, middle and high school level
• Increase stipend and scholarship for basic and higher education
• Provide free medical services for government employee
Medium-term Fiscal Framework (MTFF) in Myanmar
Government Policy Priorities for FY 2015-16
• Provide more grants for deficit financing and special grant to
state/region governments
Improve Efficiency
• Scrutinize wages & salaries, travelling
allowance, maintenance, entertainment expense
• Mostly not allowed to build housing for government employee
• Reduce non-productive expenditure – eg: Furniture, Machinery
16

I. Myanmar’s Budget System Situation
• Economic growth is expected to remain about (or above) 9 percent with an expansionan expansion 2015-16 FY to 2017-18 FY
• Tax revenue will need focus because our tax effort is low, and needs to grow morethan the nominal GDP growth rate
• Outlook for resource revenue is positive – new gas fields are expected to come on-line from 2017/18 onwards
Medium-term Fiscal Framework (MTFF) in Myanmar
Medium-term Outlook FY 2015-2016 to FY 2017-2018
line from 2017/18 onwards
• Expect to implement EITI – which will increase transparency and ensure revenuesfrom natural resources remain on-budget
• Expenditure side – continue to align budget to priorities and ensure efficiency ofspending
• Refine the intergovernmental grants formula to provide state and regions adequateresources to meet functional responsibilities
• Ensure debt sustainability through capping deficit to about 5 percent of GDP over themedium term
17

I. Myanmar’s Budget System Situation
• Revenue will increase by Kyat 0.462 billion in FY 2015-16 (increased by 3%)
• Tax to GDP ratio increases from 7.4 % in FY 2014-15 to 8.1 % in FY 2015-16
• Revenue to GDP decreases because one-off receipts not to happen in 2015
• Expenditure plan has increased alignment to priorities – total spending of
Medium-term Fiscal Framework (MTFF) in Myanmar
Budget Strategy for FY 2015-16
• Expenditure plan has increased alignment to priorities – total spending of
20,827 billion kyats
• Debt service to GDP increases slightly from1.8% in FY 2014-15 to
1.9% in FY 2015-16
• Deficit to GDP at 5.2 %, as per objectives of fiscal sustainability
18
I. Myanmar’s Budget System Situation
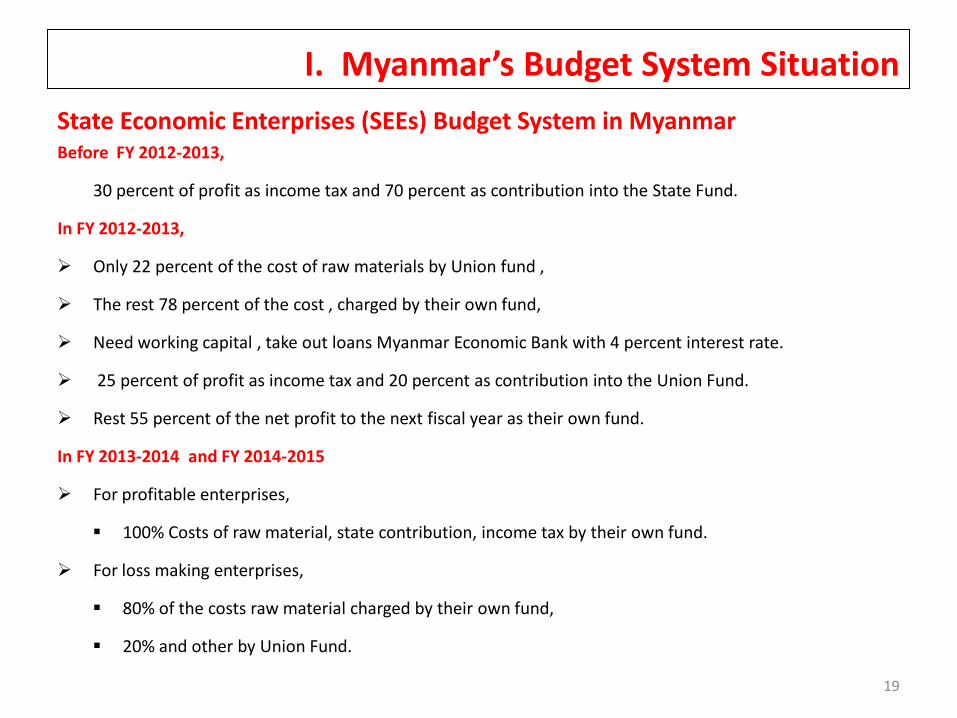
Before FY 2012-2013,
30 percent of profit as income tax and 70 percent as contribution into the State Fund.
In FY 2012-2013,
Only 22 percent of the cost of raw materials by Union fund ,
The rest 78 percent of the cost , charged by their own fund,
Need working capital , take out loans Myanmar Economic Bank with 4 percent interest rate.
State Economic Enterprises (SEEs) Budget System in Myanmar
25 percent of profit as income tax and 20 percent as contribution into the Union Fund.
Rest 55 percent of the net profit to the next fiscal year as their own fund.
In FY 2013-2014 and FY 2014-2015
For profitable enterprises,
100% Costs of raw material, state contribution, income tax by their own fund.
For loss making enterprises,
80% of the costs raw material charged by their own fund,
20% and other by Union Fund.
19
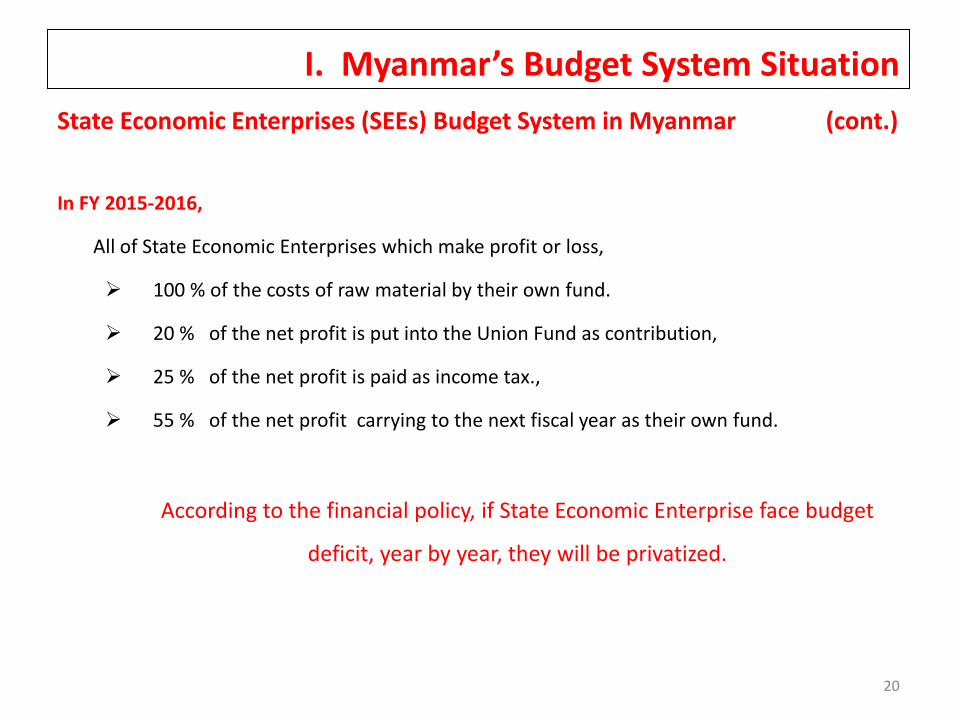
I. Myanmar’s Budget System Situation
In FY 2015-2016,
All of State Economic Enterprises which make profit or loss,
100 % of the costs of raw material by their own fund.
20 % of the net profit is put into the Union Fund as contribution,
State Economic Enterprises (SEEs) Budget System in Myanmar (cont.)
25 % of the net profit is paid as income tax.,
55 % of the net profit carrying to the next fiscal year as their own fund.
According to the financial policy, if State Economic Enterprise face budget
deficit, year by year, they will be privatized.
20
I. Myanmar’s Budget System Situation
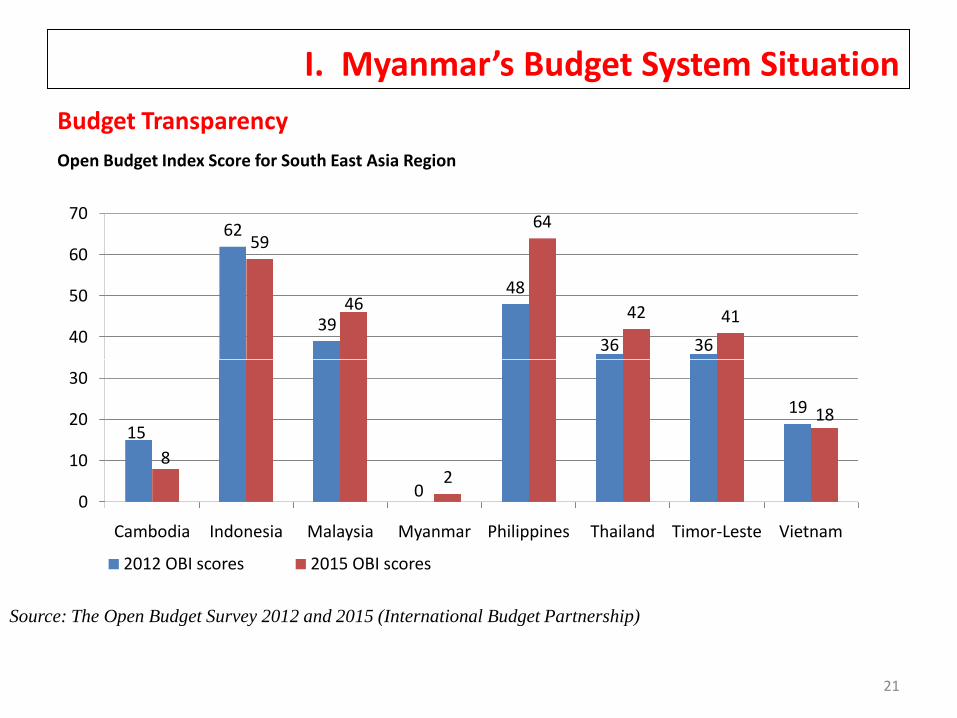
Open Budget Index Score for South East Asia Region
Budget Transparency
62
39
48
36 36
59
46
64
42 4140
50
60
70
21
15
0
19
82
18
0
10
20
30
Cambodia Indonesia Malaysia Myanmar Philippines Thailand Timor-Leste Vietnam
2012 OBI scores 2015 OBI scores
Source: The Open Budget Survey 2012 and 2015 (International Budget Partnership)
I. Myanmar’s Budget System Situation
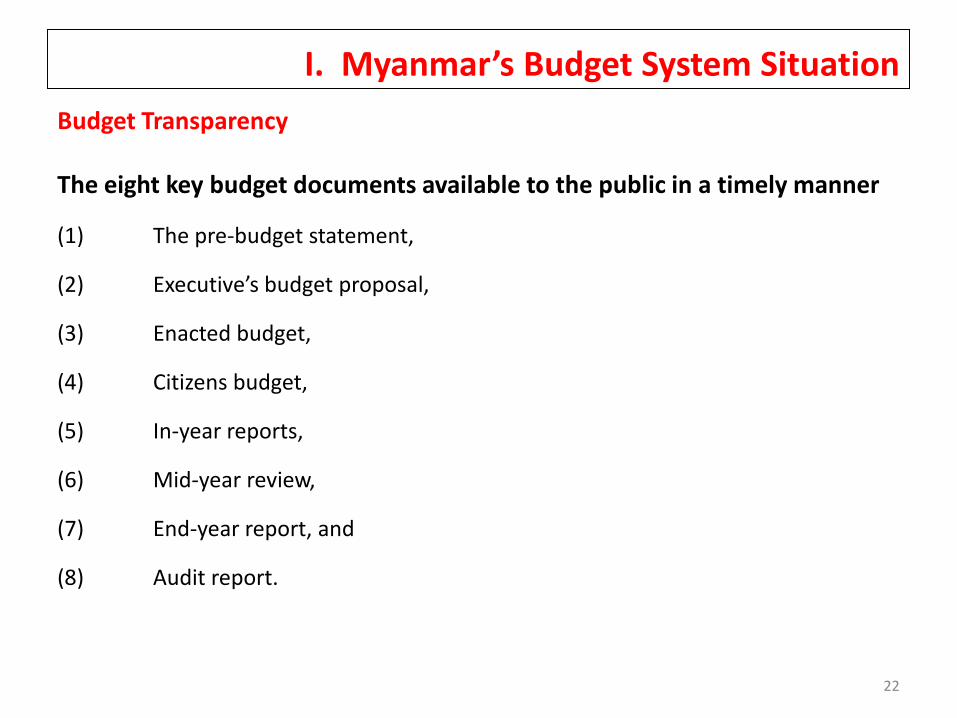
The eight key budget documents available to the public in a timely manner
(1) The pre-budget statement,
(2) Executive’s budget proposal,
(3) Enacted budget,
Budget Transparency
(4) Citizens budget,
(5) In-year reports,
(6) Mid-year review,
(7) End-year report, and
(8) Audit report.
22
I. Myanmar’s Budget System Situation
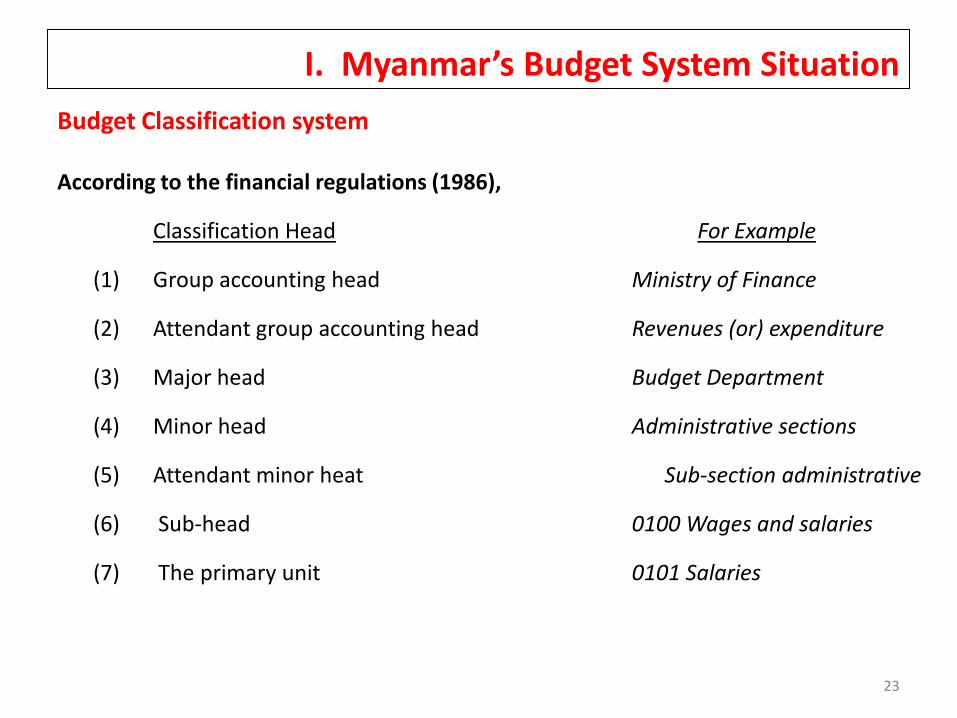
According to the financial regulations (1986),
Classification Head For Example
(1) Group accounting head Ministry of Finance
(2) Attendant group accounting head Revenues (or) expenditure
Budget Classification system
(3) Major head Budget Department
(4) Minor head Administrative sections
(5) Attendant minor heat Sub-section administrative
(6) Sub-head 0100 Wages and salaries
(7) The primary unit 0101 Salaries
23
II. Myanmar’s Budget Decentralization
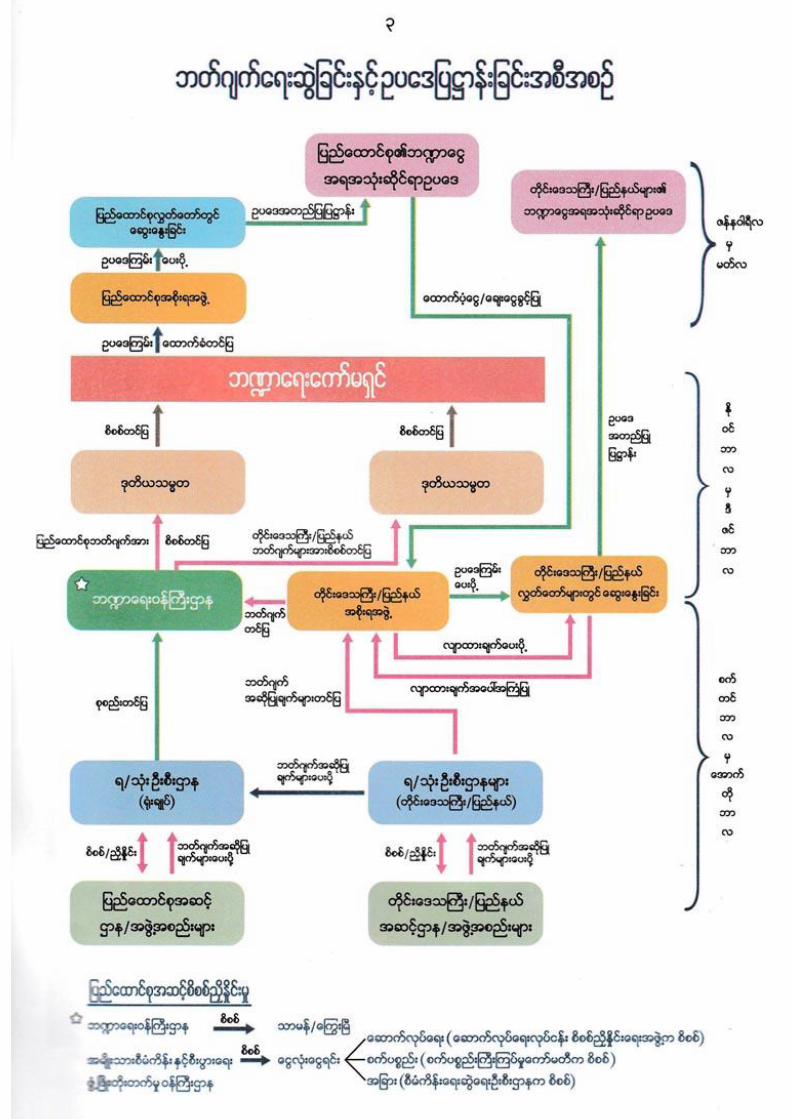
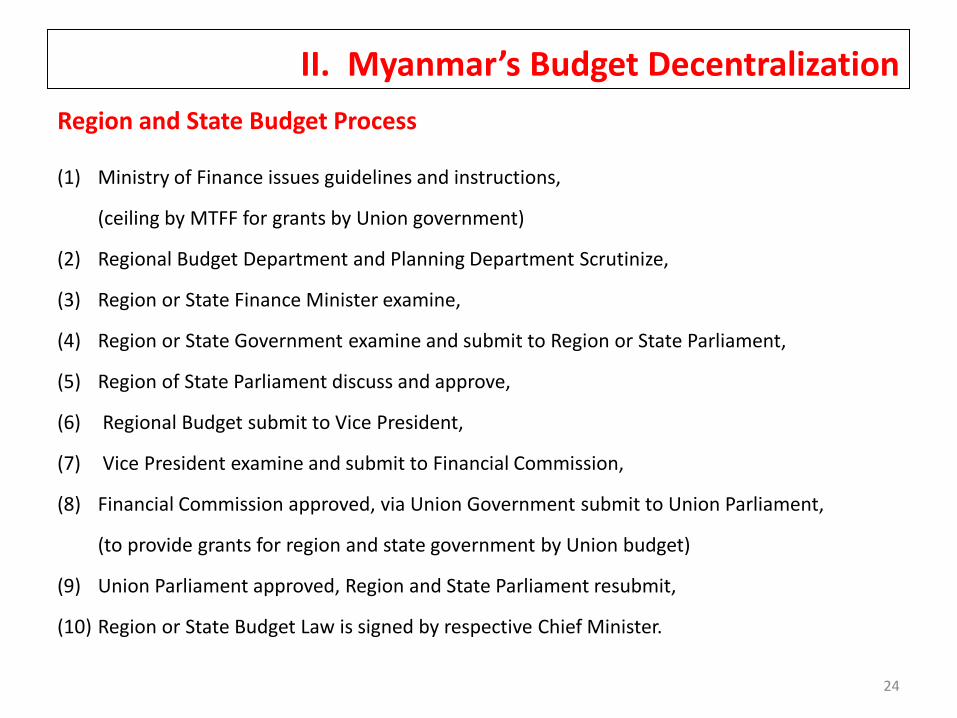
(1) Ministry of Finance issues guidelines and instructions,
(ceiling by MTFF for grants by Union government)
(2) Regional Budget Department and Planning Department Scrutinize,
(3) Region or State Finance Minister examine,
(4) Region or State Government examine and submit to Region or State Parliament,
Region and State Budget Process
(5) Region of State Parliament discuss and approve,
(6) Regional Budget submit to Vice President,
(7) Vice President examine and submit to Financial Commission,
(8) Financial Commission approved, via Union Government submit to Union Parliament,
(to provide grants for region and state government by Union budget)
(9) Union Parliament approved, Region and State Parliament resubmit,
(10) Region or State Budget Law is signed by respective Chief Minister.
24
II. Myanmar’s Budget Decentralization
(%)
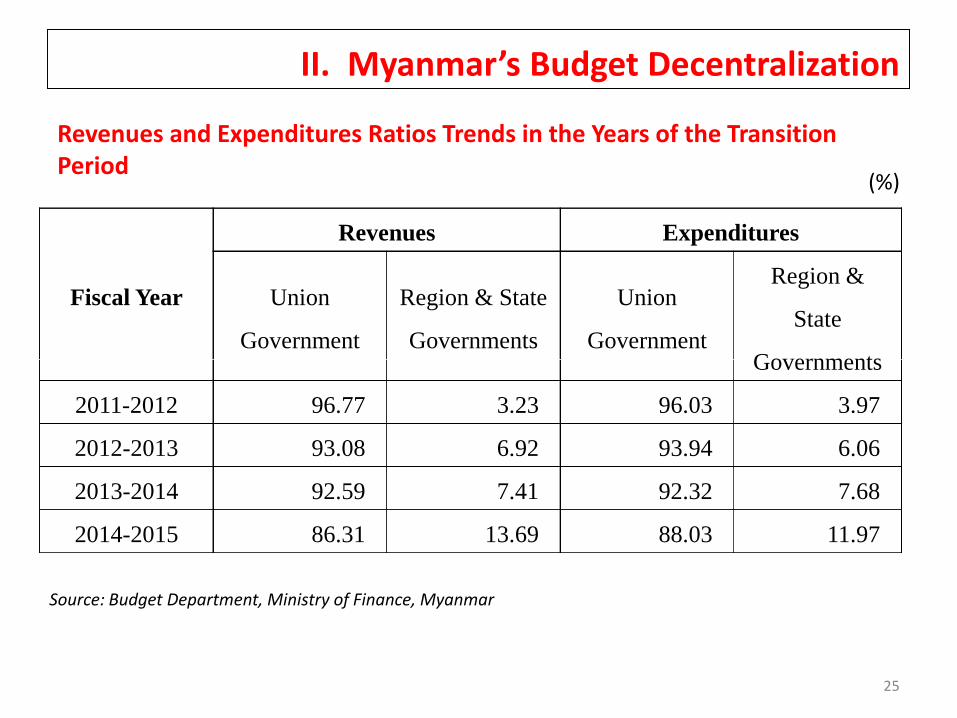
Revenues and Expenditures Ratios Trends in the Years of the TransitionPeriod
Fiscal Year
Revenues Expenditures
Union
Government
Region & State
Governments
Union
Government
Region &
State
Governments
25
Governments
2011-2012 96.77 3.23 96.03 3.97
2012-2013 93.08 6.92 93.94 6.06
2013-2014 92.59 7.41 92.32 7.68
2014-2015 86.31 13.69 88.03 11.97
Source: Budget Department, Ministry of Finance, Myanmar

II. Myanmar’s Budget DecentralizationGrants allocation to Region and State Governments from the Union Government
133,959
136,365
141,703
146,763
170,411
208,022
Rakine
Magwe
Tanintharyi
Kachin
Sagaing
Shan2015-2016
2014-2015
2013-2014
2012-2013
2011-2012
26
46,918
67,061
68,462
108,362
110,384
120,674
120,939
122,253
- 50,000 100,000 150,000 200,000 250,000
Kayah
Mon
Kayin
Mandalay
Ayeyarwady
Yangon
Bago
Chin
(Million Kyat)Source: Budget Department,Ministry of Finance,Myanmar

III. Overview of the Japanese Budget SystemBudget Situation in JapanGeneral Account Revenues of Japan (Billion Yen, %)
FY
General Account Revenues
Bonds
Dependency
ratio
Tax
revenues
/GDP
Tax
revenues
+ Other
revenues
/GDP
Government
Bonds
Outstanding
Government
Bonds
Outstanding
/GDP
Long-term debt
outstanding of
central and
local
government
Tax
Revenues
Other
Revenues
Government
Bond
Issues
Total
1990 58,004.0 2,639.6 5,593.2 66,236.8 8.4 12.8 13.4 166,337.9 36.8 265,841.9
2000 48,659.0 3,718.1 32,610.0 84,987.1 38.4 9.5 10.3 367,554.7 72.0 645,864.8
2005 44,007.0 3,785.9 34,390.0 82,182.9 41.8 8.7 9.5 526,927.9 104.3 758,302.3
27Source: Japan's Fiscal Condition, January 2015, Ministry of Finance, Japan.
2005 44,007.0 3,785.9 34,390.0 82,182.9 41.8 8.7 9.5 526,927.9 104.3 758,302.3
2006 45,878.0 3,835.0 29,973.0 79,686.0 37.6 9.0 9.8 531,701.5 104.4 761,058.7
2007 53,467.0 4,009.8 25,432.0 82,908.8 30.7 10.4 11.2 541,458.4 105.5 766,668.4
2008 53,554.0 4,159.3 25,348.0 83,061.3 30.5 10.9 11.8 545,935.6 111.5 770,444.5
2009 46,103.0 9,151.0 33,294.0 88,548.0 37.6 9.7 11.7 593,971.7 125.3 819,732.2
2010 37,396.0 10,600.2 44,303.0 92,299.2 48.0 7.8 10.0 636,311.7 132.5 861,604.3
2011 40,927.0 7,186.6 44,298.0 92,411.6 47.9 8.6 10.2 669,867.4 141.4 894,712.0
2012 42,346.0 3,743.9 44,244.0 90,333.9 47.6 8.9 9.7 705,007.2 148.6 931,934.4
2013 43,096.0 4,053.5 42,851.0 92,611.5 46.3 8.9 9.8 743,867.6 154.0 971,787.0
2014 50,001.0 4,631.3 41,250.0 95,882.3 43.0 10.2 11.1 778,192.1 158.4 1,009,164.4
2015 54,525.0 4,954.0 36,863.0 96,342.0 38.3 10.8 11.8 807,091.1 159.8 1,035,277.7
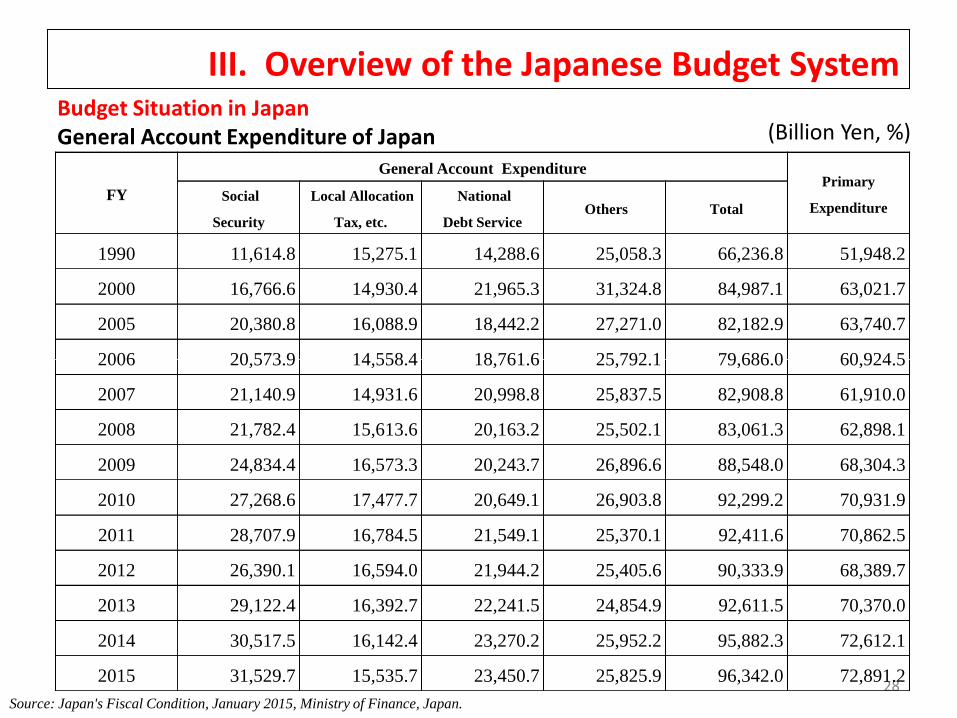
III. Overview of the Japanese Budget SystemBudget Situation in JapanGeneral Account Expenditure of Japan (Billion Yen, %)
FY
General Account ExpenditurePrimary
ExpenditureSocial
Security
Local Allocation
Tax, etc.
National
Debt ServiceOthers Total
1990 11,614.8 15,275.1 14,288.6 25,058.3 66,236.8 51,948.2
2000 16,766.6 14,930.4 21,965.3 31,324.8 84,987.1 63,021.7
2005 20,380.8 16,088.9 18,442.2 27,271.0 82,182.9 63,740.7
2006 20,573.9 14,558.4 18,761.6 25,792.1 79,686.0 60,924.5
28Source: Japan's Fiscal Condition, January 2015, Ministry of Finance, Japan.
2006 20,573.9 14,558.4 18,761.6 25,792.1 79,686.0 60,924.5
2007 21,140.9 14,931.6 20,998.8 25,837.5 82,908.8 61,910.0
2008 21,782.4 15,613.6 20,163.2 25,502.1 83,061.3 62,898.1
2009 24,834.4 16,573.3 20,243.7 26,896.6 88,548.0 68,304.3
2010 27,268.6 17,477.7 20,649.1 26,903.8 92,299.2 70,931.9
2011 28,707.9 16,784.5 21,549.1 25,370.1 92,411.6 70,862.5
2012 26,390.1 16,594.0 21,944.2 25,405.6 90,333.9 68,389.7
2013 29,122.4 16,392.7 22,241.5 24,854.9 92,611.5 70,370.0
2014 30,517.5 16,142.4 23,270.2 25,952.2 95,882.3 72,612.1
2015 31,529.7 15,535.7 23,450.7 25,825.9 96,342.0 72,891.2
III. Overview of the Japanese Budget System
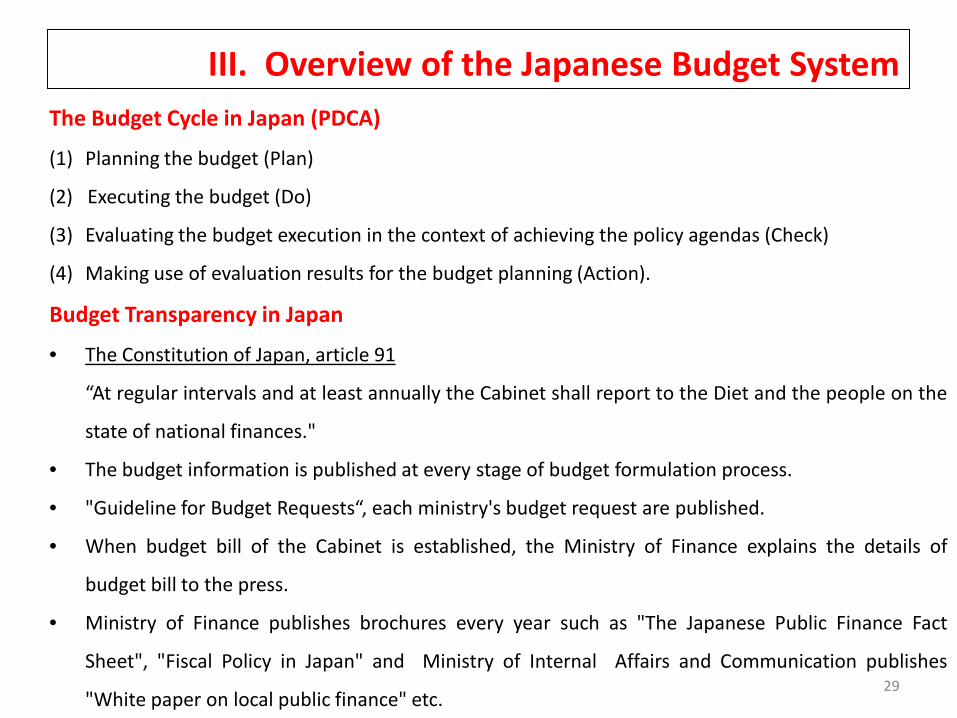
The Budget Cycle in Japan (PDCA)
(1) Planning the budget (Plan)
(2) Executing the budget (Do)
(3) Evaluating the budget execution in the context of achieving the policy agendas (Check)
(4) Making use of evaluation results for the budget planning (Action).
Budget Transparency in Japan
• The Constitution of Japan, article 91
29
• The Constitution of Japan, article 91
“At regular intervals and at least annually the Cabinet shall report to the Diet and the people on the
state of national finances."
• The budget information is published at every stage of budget formulation process.
• "Guideline for Budget Requests“, each ministry's budget request are published.
• When budget bill of the Cabinet is established, the Ministry of Finance explains the details of
budget bill to the press.
• Ministry of Finance publishes brochures every year such as "The Japanese Public Finance Fact
Sheet", "Fiscal Policy in Japan" and Ministry of Internal Affairs and Communication publishes
"White paper on local public finance" etc.
III. Overview of the Japanese Budget System
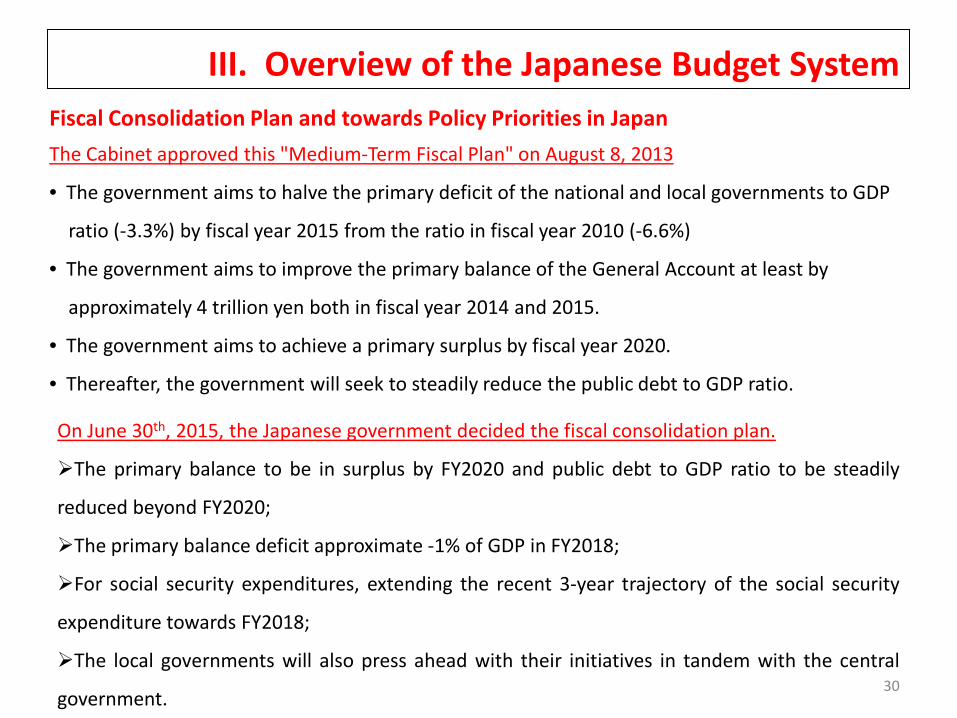
Fiscal Consolidation Plan and towards Policy Priorities in Japan
The Cabinet approved this "Medium-Term Fiscal Plan" on August 8, 2013
• The government aims to halve the primary deficit of the national and local governments to GDP
ratio (-3.3%) by fiscal year 2015 from the ratio in fiscal year 2010 (-6.6%)
• The government aims to improve the primary balance of the General Account at least by
approximately 4 trillion yen both in fiscal year 2014 and 2015.
• The government aims to achieve a primary surplus by fiscal year 2020.
30
• Thereafter, the government will seek to steadily reduce the public debt to GDP ratio.
On June 30th, 2015, the Japanese government decided the fiscal consolidation plan.
The primary balance to be in surplus by FY2020 and public debt to GDP ratio to be steadily
reduced beyond FY2020;
The primary balance deficit approximate -1% of GDP in FY2018;
For social security expenditures, extending the recent 3-year trajectory of the social security
expenditure towards FY2018;
The local governments will also press ahead with their initiatives in tandem with the central
government.
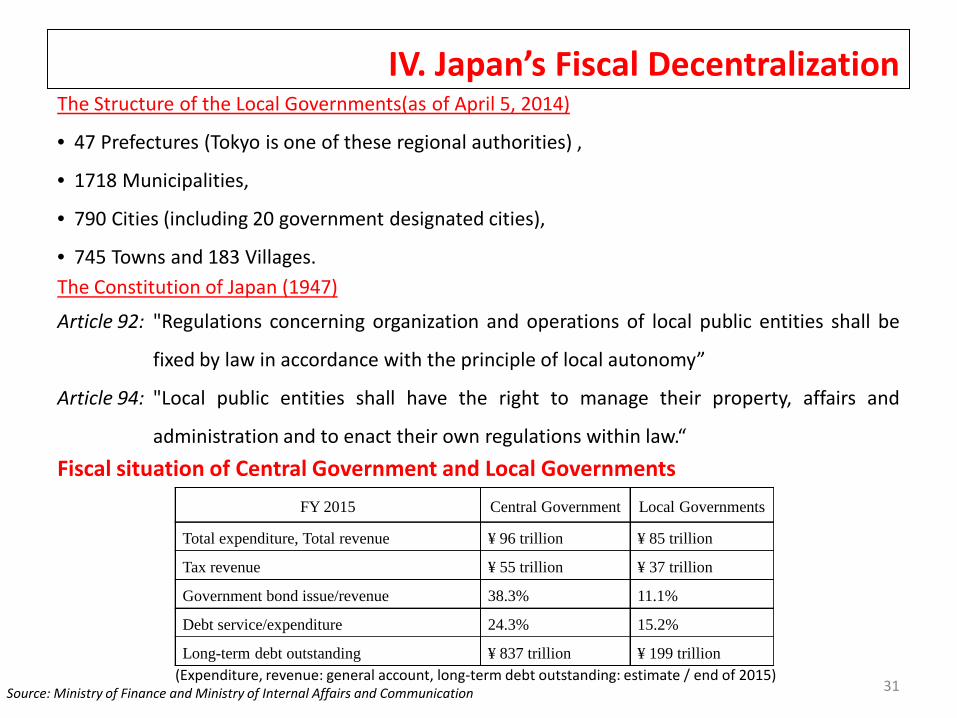
IV. Japan’s Fiscal DecentralizationThe Structure of the Local Governments(as of April 5, 2014)
• 47 Prefectures (Tokyo is one of these regional authorities) ,
• 1718 Municipalities,
• 790 Cities (including 20 government designated cities),
• 745 Towns and 183 Villages.
The Constitution of Japan (1947)
Article 92: "Regulations concerning organization and operations of local public entities shall be
fixed by law in accordance with the principle of local autonomy”
31
fixed by law in accordance with the principle of local autonomy”
Article 94: "Local public entities shall have the right to manage their property, affairs and
administration and to enact their own regulations within law.“
FY 2015 Central Government Local Governments
Total expenditure, Total revenue ¥ 96 trillion ¥ 85 trillion
Tax revenue ¥ 55 trillion ¥ 37 trillion
Government bond issue/revenue 38.3% 11.1%
Debt service/expenditure 24.3% 15.2%
Long-term debt outstanding ¥ 837 trillion ¥ 199 trillion
Fiscal situation of Central Government and Local Governments
(Expenditure, revenue: general account, long-term debt outstanding: estimate / end of 2015)Source: Ministry of Finance and Ministry of Internal Affairs and Communication

IV. Japan’s Fiscal Decentralization
Revenue of Local Governments
Local Public Finance Program (LPFP)
Provides a mechanism to achieve harmonization among Central government
finance and local government finance.
Negotiate Ministry of Finance and Ministry of Internal Affairs and Communications
Combine with many National Policies and Programs.
32
Local Revenue
Local Tax Revenue
Grants from the Central Government
• National Subsidies
• Local Allocation Tax Grants (LAT Grants)
• Local Transfer Tax (collected nationally and transferred to local governments)
Local Government Bonds
Other Revenue resources
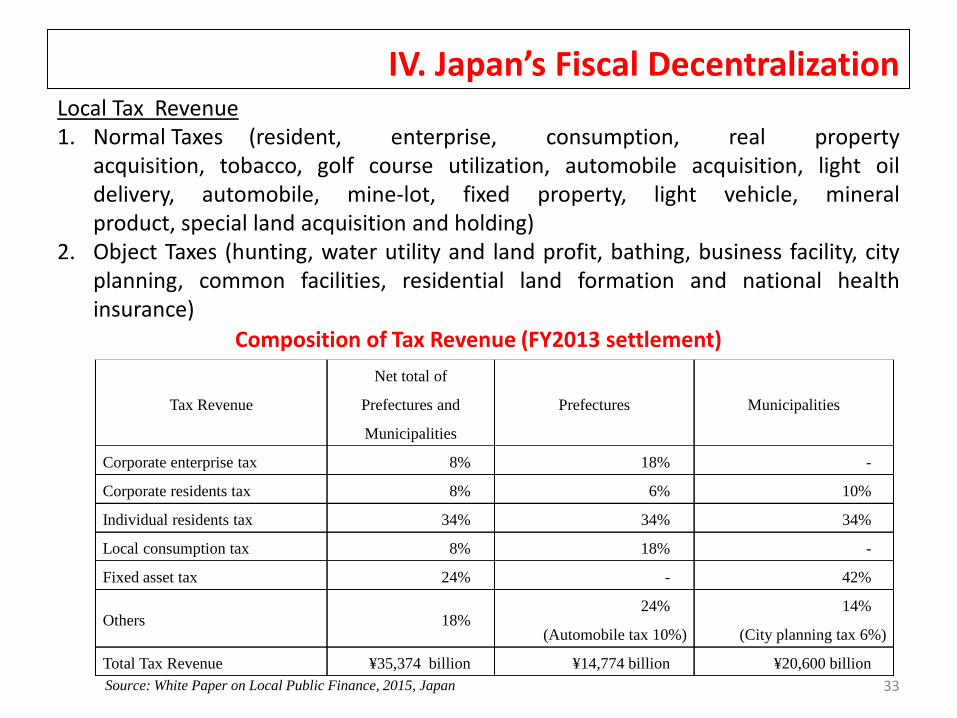
IV. Japan’s Fiscal DecentralizationLocal Tax Revenue1. Normal Taxes (resident, enterprise, consumption, real property
acquisition, tobacco, golf course utilization, automobile acquisition, light oildelivery, automobile, mine-lot, fixed property, light vehicle, mineralproduct, special land acquisition and holding)
2. Object Taxes (hunting, water utility and land profit, bathing, business facility, cityplanning, common facilities, residential land formation and national healthinsurance)
Composition of Tax Revenue (FY2013 settlement)
33
Tax Revenue
Net total of
Prefectures and
Municipalities
Prefectures Municipalities
Corporate enterprise tax 8% 18% -
Corporate residents tax 8% 6% 10%
Individual residents tax 34% 34% 34%
Local consumption tax 8% 18% -
Fixed asset tax 24% - 42%
Others 18%24%
(Automobile tax 10%)
14%
(City planning tax 6%)
Total Tax Revenue ¥35,374 billion ¥14,774 billion ¥20,600 billion
Source: White Paper on Local Public Finance, 2015, Japan
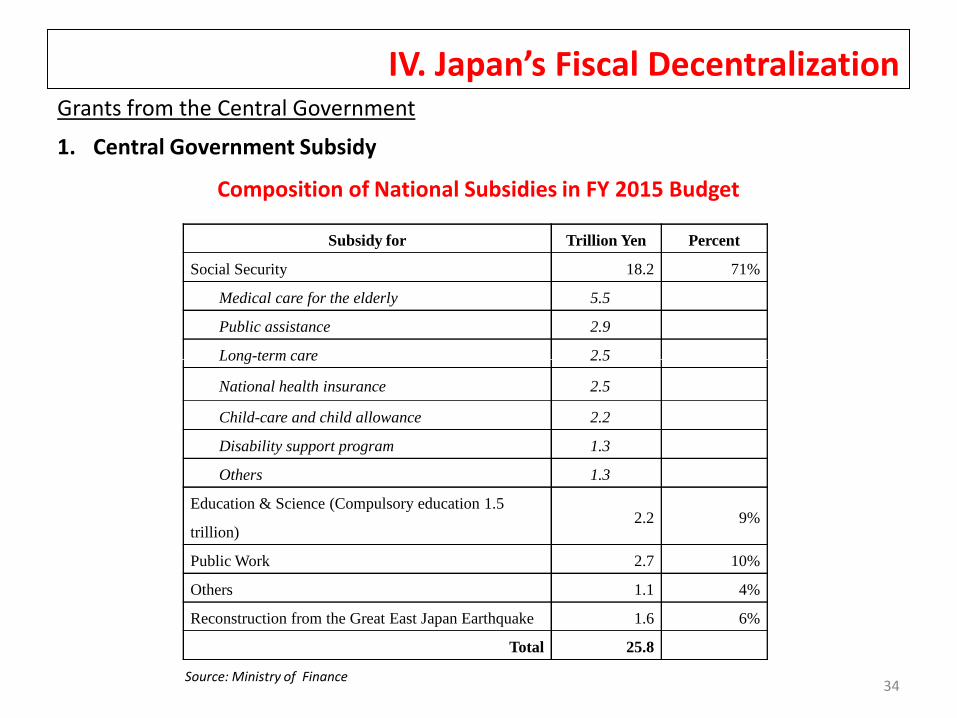
IV. Japan’s Fiscal DecentralizationGrants from the Central Government
1. Central Government Subsidy
Composition of National Subsidies in FY 2015 Budget
Subsidy for Trillion Yen Percent
Social Security 18.2 71%
Medical care for the elderly 5.5
Public assistance 2.9
Long-term care 2.5
34
Long-term care 2.5
National health insurance 2.5
Child-care and child allowance 2.2
Disability support program 1.3
Others 1.3
Education & Science (Compulsory education 1.5
trillion)2.2 9%
Public Work 2.7 10%
Others 1.1 4%
Reconstruction from the Great East Japan Earthquake 1.6 6%
Total 25.8
Source: Ministry of Finance

IV. Japan’s Fiscal Decentralization2. Local Allocation Tax Grants (LAT Grants)
• Regular Allocation Tax Grants (94%, financial resources are insufficient)• Special Allocation Tax Grants (6%, special financial requirement)
The LAT grants is certain ratios of five national taxes.Ratios of Sources for Statutory Local Allocation Tax Grants
Income
Tax
Corporate
Tax
Liquor
Tax
Consumption
Tax
Tobacco
Tax
1954 (initial budget) 19.66 19.66 20.0
1954 (supplementary budget) 19.874 19.874 20.0
1955 22.0
35
24.0
29.0
25.0
25.0
1956
1957
1958
1959~1961
1962~1964
1965
1966~1988
1989~1996
1997~1998
25.0
26.0
27.5
28.5
28.9
29.5
32.0
32.0
32.0
1999
2000~2006
2007~2013
2014
2015
2016
32.0
32.0
32.0
32.0
32.0
33.1
32.5
35.8
34.0
34.0
34.0
33.1
32.0
32.0
32.0
32.0
32.0
50.0
29.5
29.5
29.5
22.3
22.3
22.3
25.0
25.0
25.0
25.0
25.0
-
Source: Ministry ofInternal Affairs andCommunication

IV. Japan’s Fiscal Decentralization2. Local Allocation Tax Grants (LAT Grants) (cont.)
Determination of total amount of Local Allocation Tax Grants by following;
Statutory Local Allocation Tax Grants
In case of FY 2015, the following equation shows that how to estimate theportion of revenue from the above five national taxes and allocated to thespecial account for local allocation tax.
R = 0.32 I + 0.34 Cr + 0.32 L + 0.223 Cn + 0.25 T(where: R is the revenue from earmarked taxes to allocate for localallocation tax, I is revenue from national income tax, L is revenue from liquor
36
allocation tax, I is revenue from national income tax, L is revenue from liquortax, Cr is revenue from national corporate tax, Cn is revenue from nationalconsumption tax and T is revenue from national tobacco tax.)
Special Addition, etc.Local Public Finance measures taken each year, including transfer fromgeneral account and debt repayment.
In case of Local Public finance Program (FY 2015), (Trillion Yen)Financial Gap (21.4)Statutory Local Allocation Tax 13. 6, Others 1.8 & Special addition 1.45 (LAT) 16.85Extra fiscal measure bonds for debt services 3.1 & Extra fiscal measure bonds 1.45 4.55
(Special bonds)

IV. Japan’s Fiscal Decentralization
2. Local Allocation Tax Grants (LAT Grants) (cont.)
Financing Gap (amount of LAT grants) = Standard Financial Requirements
– Standard Financial Revenues
Standard financial requirements = Unit expense × Measurement unit
× Adjustment coefficient
(Where Unit expense is expense per one measurement unit of each administrative
37
scope, Measurement unit : index which reflects quantity of financial requirements of each
administrative scope reasonably and objectively, Adjustment coefficient: a modification
coefficient reflecting region-specific conditions.)
Standard Financial Revenues = (Standard Local Tax Revenues × 0.75) + Local Transfer Tax
Where, a coefficient of 0.75 (75%) is reservation ratio.

IV. Japan’s Fiscal Decentralization2. Local Allocation Tax Grants (LAT Grants) (cont.)
Two other expenses included in Standard Financial Requirements
This expenses about 10 percent of total requirements to be calculated by comprehensively.
The measurement unit based on population and surface area as follow:
ax + by,
where, x is population that reflects differences in cost due to population size,
y is area size that reflects differences in cost due to types of land use.
38
y is area size that reflects differences in cost due to types of land use.
As 2007, a = 12,390 for prefecture, a = 23,220 for municipality
b = 1,114,390 for prefecture, b = 2,357,000 for municipality
Public Debt Payments.
The public debt repayments for specified debts (50%~100%) such as bonds for
disaster recovery (95%), and extra fiscal measure bonds (100%).

IV. Japan’s Fiscal DecentralizationLocal Government Bonds
Local governments can issue local government bonds to raise financing capital
expenditure without permissions from upper levels of government.
Repayment periods are longer than one fiscal year.
The purpose of local government bonds
In Article 5 of the Local Finance Law
Operating public enterprises (as transport, gas, water supply and sewerage
39
Operating public enterprises (as transport, gas, water supply and sewerage
services); investments and loans; renewal relief works; constructing public
facilities such as schools, nurseries, other educational or welfare facilities and
firefighters' facilities; and developing road, river, port and other public
infrastructures.
By Other Laws or Other Provisions
Depopulated Areas Special Measure Bonds; Municipal Merger Special
Measure Bond; Evacuation Facility Development Bonds and Mining Pollution
Relief Bonds.
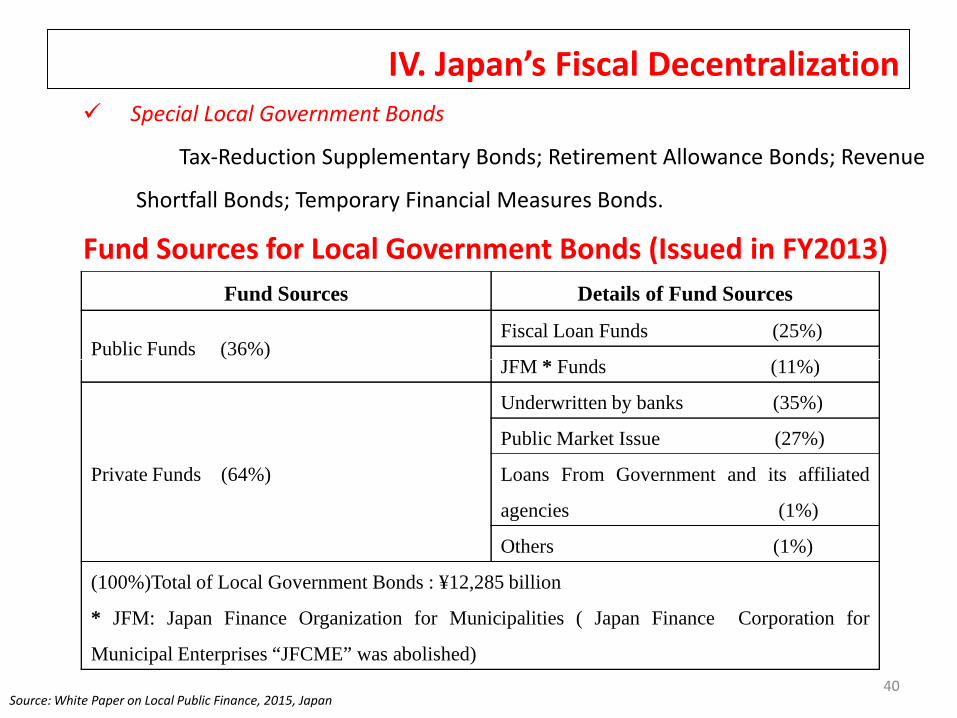
IV. Japan’s Fiscal Decentralization
Fund Sources for Local Government Bonds (Issued in FY2013)
Fund Sources Details of Fund Sources
Public Funds (36%)Fiscal Loan Funds (25%)
JFM * Funds (11%)
Special Local Government Bonds
Tax-Reduction Supplementary Bonds; Retirement Allowance Bonds; Revenue
Shortfall Bonds; Temporary Financial Measures Bonds.
40
Public Funds (36%)JFM * Funds (11%)
Private Funds (64%)
Underwritten by banks (35%)
Public Market Issue (27%)
Loans From Government and its affiliated
agencies (1%)
Others (1%)
(100%)Total of Local Government Bonds : ¥12,285 billion
* JFM: Japan Finance Organization for Municipalities ( Japan Finance Corporation for
Municipal Enterprises “JFCME” was abolished)
Source: White Paper on Local Public Finance, 2015, Japan

IV. Japan’s Fiscal DecentralizationLocal Government Bonds
The main creditors are the private sector, Japan Finance Organization forMunicipalities (JFM) and Central Government.
JFM established on 1st August, 2008. (JFCME was abolished)
JFM raises funds in the capital market. Provided exclusively to local governments at low interest. local governments must receive the consent or approval of the minister for
internal affairs and communications or their respective prefecture governorswhen they borrow from JFM.
41
when they borrow from JFM. The central government funds were provided through the Fiscal Investment
and Loan Program (FILP). This investment and loan activities are to enable the implementation of
large and long-term projects. The Funding Sources,
Before 2001, mandatory deposit funds from postal savings, pensionreserves and other sources to the national government. After Reform 2001, from issuance of FILP agency bonds and issuance ofgovernment (FILP) bonds.
FILP plan for FY 2015, provide necessary fund ¥3,989.0 Billion for LocalGovernment. (30% of total FILP plan)

IV. Japan’s Fiscal Decentralization
Expenditure of Local Governments
The expenditure percentage of central and local governments, (FY 2013 settlement)
38%
41%
45%
81%
62%
59%
55%
100%
100%
19%
Debt services
Agriculture, forestry and fishery industry
Housing,etc.
Pension
Defense
General administration
42
58.3%
100%
87%
78%
74%
72%
74%
70%
67%
82%
41.7%
13%
22%
26%
28%
26%
30%
33%
18%
0% 20% 40% 60% 80% 100%
Total expenditure
Sanitasion
School education
Judical, police and fire service
Social education, etc
Public welfare (excluding pension)
Land development
Land conservation
Commercial and industrial
Disaster recovery, etc.
Local Governments Central GovernmentSource: White Paper on Local Public Finance, 2015, Japan

IV. Japan’s Fiscal Decentralization
Expenditure of Local Governments
24%
10%
Public welfare
General administration
12%
23%
Public assistance expenses
Personnel expenses
Expenditure of Local GovernmentsClassification by Function
(FY2013 settlement)
Expenditure of Local GovernmentsClassification by Type(FY2013 settlement)
(Net total of prefectures and municipalities) Total ¥97,412 billion
43
Source: White Paper on Local Public Finance, 2015, Japan
2%
14%
17%
3%
2%
12%
6%
4%
6%
24%
0% 5% 10% 15% 20% 25% 30%
Other
Public debt payments
Education
Police
Fire service
Civil engineering work
Commerce and industry
Agriculture, forestry and fishery
Sanitasion
18%
10%
9%
15%
13%
12%
0% 10% 20% 30%
Others
Subsidizing expenses
Goods expenses
Ordinary construction work expenses
Debts service
Public assistance expenses

IV. Japan’s Fiscal Decentralization
Expenditure of Local GovernmentsComposition of Expenditure of Prefectures and Municipalities
(FY 2013 settlement)
Functions Prefectures Municipalities
General Administration - 13%
Public Welfare 15% 35%
Commerce and Industry 8% -
44
Source: White Paper on Local Public Finance, 2015, Japan
Commerce and Industry 8% -
Civil Engineering work 11% 12%
Education 21% 10%
Public debt payments 15% 11%
Others 30% 19%
Total ¥50,053 billion ¥54,860 billion
Central government guarantees to provide the local governments' fiscal challenge such as localallocation tax grants which is one of financial resources to cover the social security relatedexpenditures.

V. Findings and Recommendations(1) Fiscal Consolidation and Policy Based Budgeting
In the budget cycles, the budget planning and preparation stage is the mostimportant stage for sound budgeting system.Marc Robinson and Ducan Last (2009) (A Basic Model of Performance-Based Budgeting)The essential requirements for this most basic form of performance-based budgeting are information about the objectives and results of government expenditure, in the form of
key performance indicators and a simple form of program evaluation; and a budget preparation process designed to facilitate the use of this information in
budget funding decision, including simple expenditure review processes and spendingministry budget decisions.
45
ministry budget decisions.
Lessons from Japanese Experience
The Fiscal Consolidation Plan (The Japanese government decided on June 30th, 2015)
Basic Policy of Budget Requests for FY2016 (Cabinet approved on 24th July, 2015)
Basic Policies for Economic and Fiscal Management and Reform 2015
The Japan Revitalization Strategy Revised in 2015
(Significantly, Japan has been prepared to clearer linkage between policies and budget.
Japan with more advanced policies based budgeting provides to concrete
and effective measures to achieve the medium-term fiscal targets.)
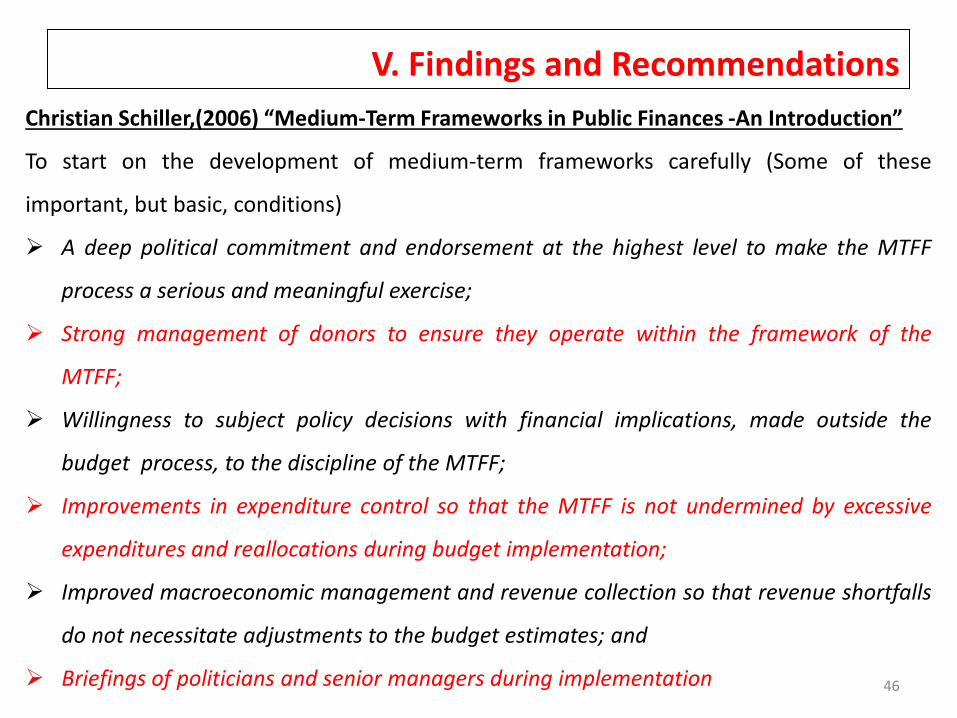
V. Findings and Recommendations
Christian Schiller,(2006) “Medium-Term Frameworks in Public Finances -An Introduction”
To start on the development of medium-term frameworks carefully (Some of these
important, but basic, conditions)
A deep political commitment and endorsement at the highest level to make the MTFF
process a serious and meaningful exercise;
Strong management of donors to ensure they operate within the framework of the
46
MTFF;
Willingness to subject policy decisions with financial implications, made outside the
budget process, to the discipline of the MTFF;
Improvements in expenditure control so that the MTFF is not undermined by excessive
expenditures and reallocations during budget implementation;
Improved macroeconomic management and revenue collection so that revenue shortfalls
do not necessitate adjustments to the budget estimates; and
Briefings of politicians and senior managers during implementation

V. Findings and Recommendations
(2) Budget Classification and Transparency
Davina Jacobs, Jean-Luc Helis, Dominique Bouley, (2009) "Budget Classification"
In countries where the budget nomenclature is weak, upgrading the budgetclassification system should itself be considered a basic step-indeed a precondition-beforeembarking on other reforms of public financial management (PFM) such as introducing acomputerized financial management information system, a Medium-term ExpenditureFramework (MTEF), or a results based budgeting system.
47
Lessons from Japanese Experience
(1) Japanese government is applied the IMF criteria for account classified by the Sub-sectorsof General Government budget classification. It's based on "Government FinanceStatistics Manual 2001" by IMF which provides for policy decision making and publishedfor transparency on Cabinet Office website.
(2) Many documents for Japanese budget system and information by update on governmentweb pages, books and booklets. Japanese citizens can access the information of financialstatements beginning from FY1947, at the homepage of the Ministry of Finance and alsocan access from the homepages of Ministry of Internal Affairs and Communications andCabinet Office, etc.

V. Findings and Recommendations
(3) Fiscal DecentralizationOates (1999) stated that "Intergovernmental grants constitute a distinctive and
important policy instrument in fiscal federalism that can serve a number of different functions.The literature emphasizes three potential roles for such grants: the internalization of spilloverbenefits to other jurisdictions, fiscal equalization across jurisdictions, and an improved overalltax system.“
Lessons from Japanese Experience
48
Many years of reforming decentralization
eg."Fundamental Principle for Promoting Decentralization was adopted by Cabinet in 1994";
"Decentralization Promotion Plan was endorsed in May 1998";
"Omnibus Decentralization Law was enacted in July 1999";
"Created the Local Financial Reform Program "Trinity Reform" in 2003" and
"Promotion of Decentralization Reform Law was enacted in December 2006“.
Japanese government has good experience with Financing Programs. (Grants system, FILP,etc.)

V. Findings and RecommendationsRecommendations
Myanmar should be carefully some of basic conditions (point out slide 46) during
the Introducing Medium-terms forecast for fiscal consolidation and policy based
budgeting.
The policy maker should be considering for more investment on social sector into
the fiscal framework.
49
Myanmar should implement tax reform system, to formulate new tax policy and
to create the sharing system for social security.
To improve the Medium Fiscal Frame work, Myanmar needs for sound
Macroeconomic indicator and reliable data.
Myanmar PFM modernization project is being implemented started from 2014 to
2019. Thus, in this time Myanmar should be change to the revised GFS
Manual, and GFMIS System.

V. Findings and RecommendationsRecommendations (cont.) To upgrade the quality of Government Finance Statistics and Budget
Transparency, Myanmar needs to improve technical capacity building and relativeinformation technical system such as integrated and automated FinancialManagement Information System (FMIS).
The government should review and amend the intergovernmental sharing taxsystem and grants system. (like as Japanese Grants system to Local governments)
Myanmar needs to enact related laws and policy; to promote fundamental
50
Myanmar needs to enact related laws and policy; to promote fundamentalprinciple of fiscal decentralization.
Union government should be more fiscal decentralization to Region or Stategovernments, to implement administrative services and social sector services byclosely related to the life of citizens Regional governments are required toimprove transparency their fiscal situation.
To improve and build up the sound budgetary system of Myanmar and to gain thecredibility of budget, The Government should implement to improve technicalskills and to improve the capacity building for the all of Stakeholders’ (includingRegions and States)…

Thank you very much for your attentionand your valued comments.
51
Thank you very much for your attentionand your valued comments.