Embed Size (px)
Citation preview

Making Strange: Risk, Design & ForesightIntergovernmental Forum on Risk ManagementOttawa, Canada 1–2 October 2014
Greg Van Alstyne Strategic Innovation Lab (sLab)OCAD University
flickr.com/photos/wespeck

28
Once enterprises have recognized the obstacles to innovation, SIBS asked whether they try to overcome them by their own means or by taking advantage of government support programs. The percentage of enterprises taking measures to mitigate obstacles to innovation is high.
About 90 percent of manufacturing enterprises reported that they have taken measures to miti-gate the effects of identifi ed obstacles to innovation. Among these enterprises, the success rate of these measures ranges from 35 percent to 60 percent depending on the obstacle (Figure 5.9). While few enterprises identifi ed intellectual property (IP) protection as an obstacle, more than 60 percent of enterprises facing IP-related obstacles reported being successful in mitigating this particular issue. In contrast, enterprises facing market size obstacles were less likely (35 percent) to report being successful in mitigating this obstacle. Figure 5.9 also shows that between 10 percent and 30 percent of manufacturing enterprises that took measures to mitigate obstacles to innovation used government programs.
It is noteworthy that the success rate of measures to mitigate uncertainty and risk, which is the most important obstacle to innovation, is among the lowest, but that the success rates for lack of skills and internal fi nancial obstacles are among the highest.
Figure 5.8: Obstacles to innovation faced by enterprises in 2009 – Percentage of enterprises
2010 40 50300%
All except manufacturingManufacturing
Source: Survey of Innovation and Business Strategy, 2009.
Uncertainty and risk
Internal financing
Lack of skills
Market size
External financing
Regulatory issues
Agreement with external collaborators
Intellectual property
Government competition policy
Greg Van Alstyne Making Strange: Risk, Design & Foresight
What are the biggest obstacles to innovation?

What is innovation?
Is it a new technology?Is it a process? An outcome?
flickr.com/photos/osterwalder/162282102/flickr.com/photos/pagedooley/4370352638
Greg Van Alstyne Making Strange: Risk, Design & Foresight
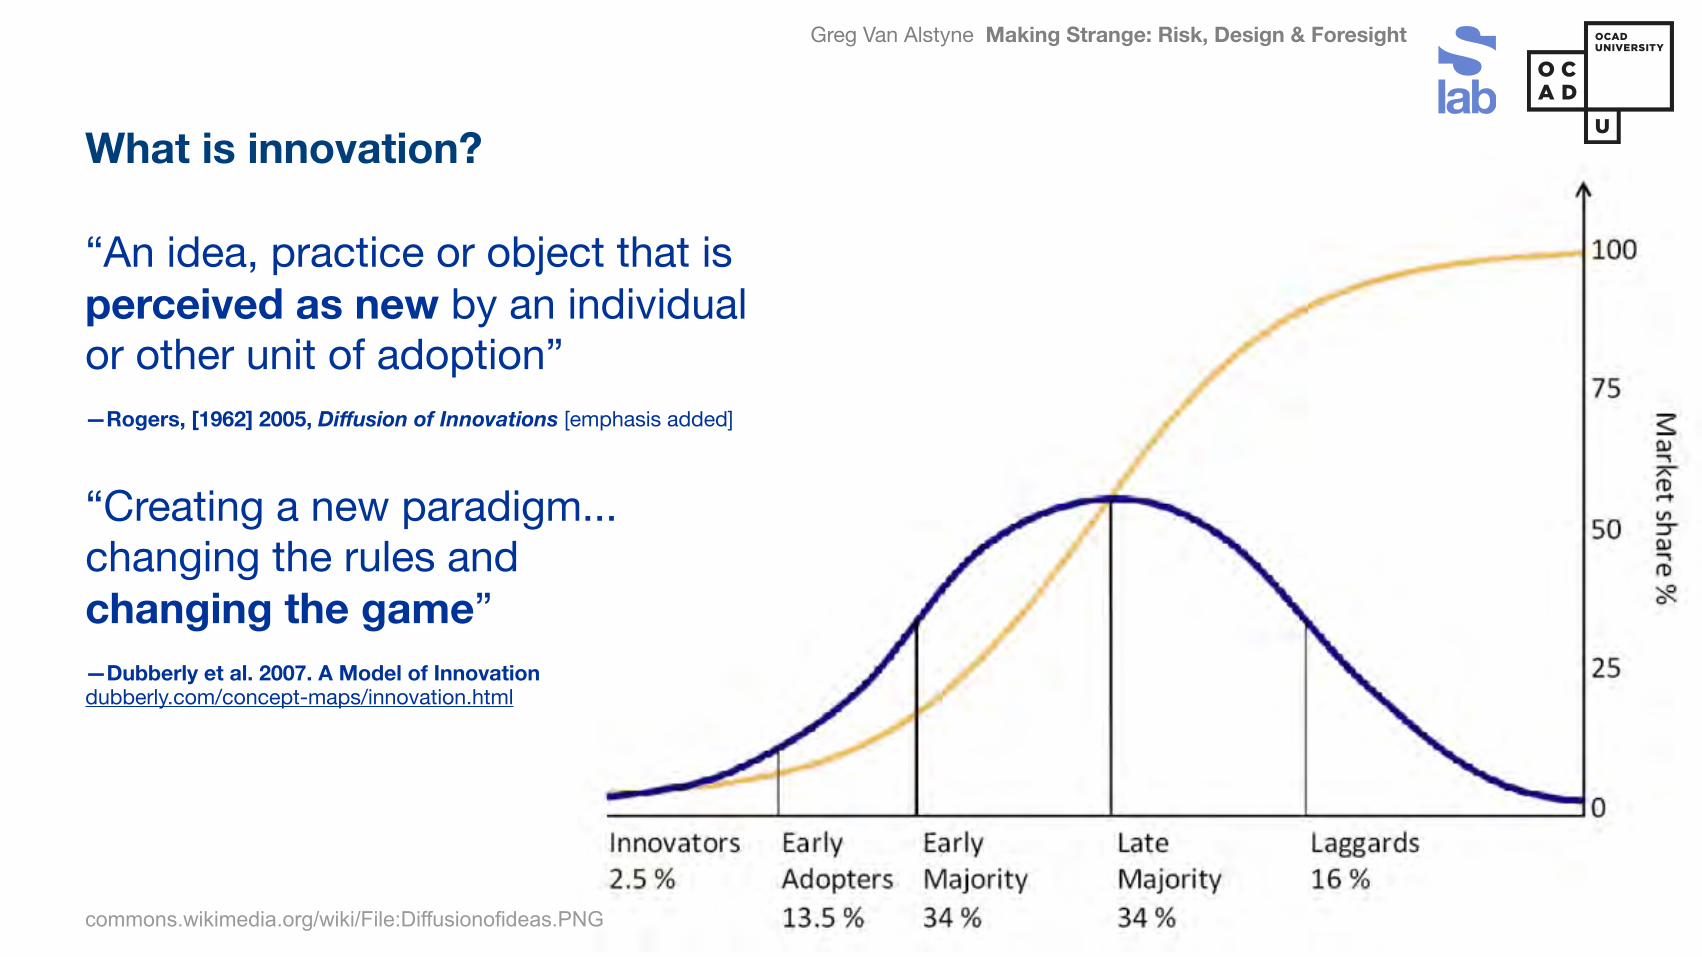
What is innovation?
“An idea, practice or object that is perceived as new by an individual or other unit of adoption”—Rogers, [1962] 2005, Diffusion of Innovations [emphasis added]
“Creating a new paradigm...changing the rules and changing the game”—Dubberly et al. 2007. A Model of Innovationdubberly.com/concept-maps/innovation.html
commons.wikimedia.org/wiki/File:Diffusionofideas.PNG

Greg Van Alstyne Making Strange: Risk, Design & Foresight
Innovation means novelty, creativity, risk. Yet risk is seen as an obstacle.
What gives rise to this situation?
“Uncertainty today is not just an occasional, temporary deviation from a reasonable predictability; it is a basic structural feature of the business environment.” —Pierre Wack, 1985

Greg Van Alstyne Making Strange: Risk, Design & Foresight
Federico Díaz, Sembion CC BY-SA 3.0
So how does your organization deal with risk & uncertainty?
Greg Van Alstyne Making Strange: Risk, Design & Foresight
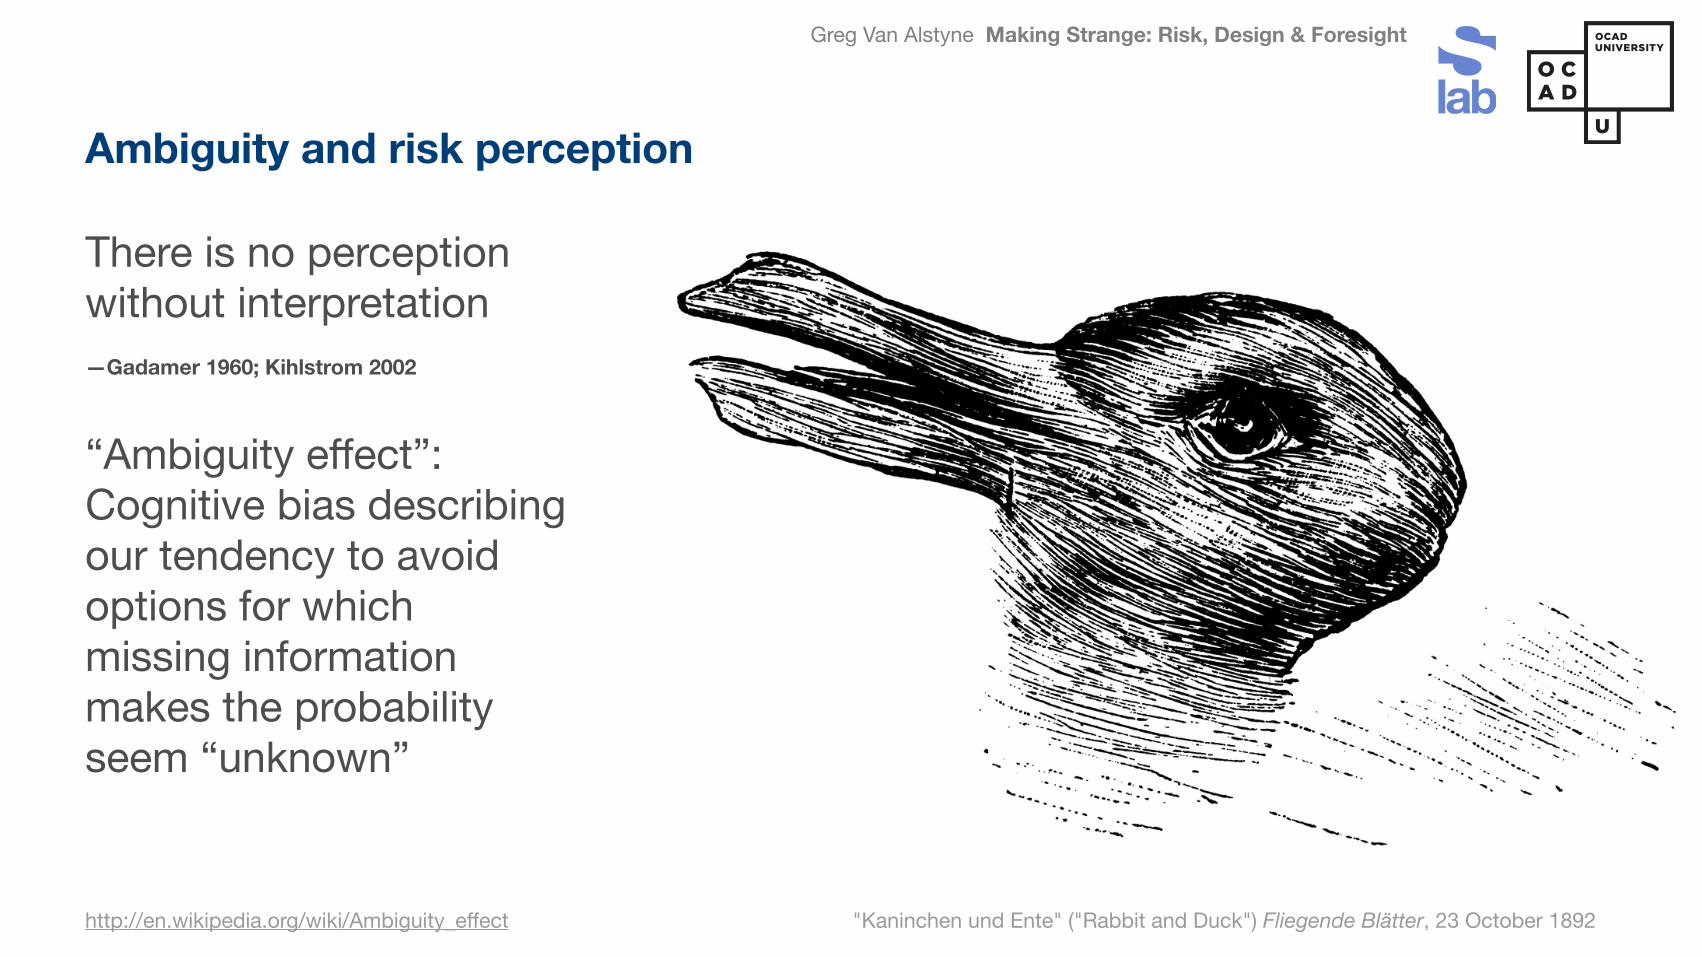
Ambiguity and risk perception
There is no perception without interpretation—Gadamer 1960; Kihlstrom 2002
“Ambiguity effect”:Cognitive bias describing our tendency to avoid options for which missing information makes the probability seem “unknown”
Caption or URLhttp://en.wikipedia.org/wiki/Ambiguity_effect "Kaninchen und Ente" ("Rabbit and Duck") Fliegende Blätter, 23 October 1892
quick exercise
The next slide is ambiguous. What is the meaning of this scene?


Greg Van Alstyne Making Strange: Risk, Design & Foresight
Ambiguity
indianafamilyoffarmers.blogspot.com/

Greg Van Alstyne Making Strange: Risk, Design & Foresight
Malene Thyssen, http://commons.wikimedia.org/wiki/User:Malene
we are
here
Q: Which practices deal creatively with ambiguity & risk? A: art & design
OCAD University / née Ontario College of Art & Design, Toronto

Greg Van Alstyne Making Strange: Risk, Design & Foresight
sLab is “human centred”
We place human needs, desires, behaviour and culture at the heart of the process
Our process may be seen as:
problem finding foresightproblem framing strategyproblem solving design
cc flickr.com/photos/wwworks

Greg Van Alstyne Making Strange: Risk, Design & Foresight
systems thinking+ visual thinking
businessthinking
design thinking
futuresthinking
sLab design & foresight model
Greg Van Alstyne Making Strange: Risk, Design & Foresight
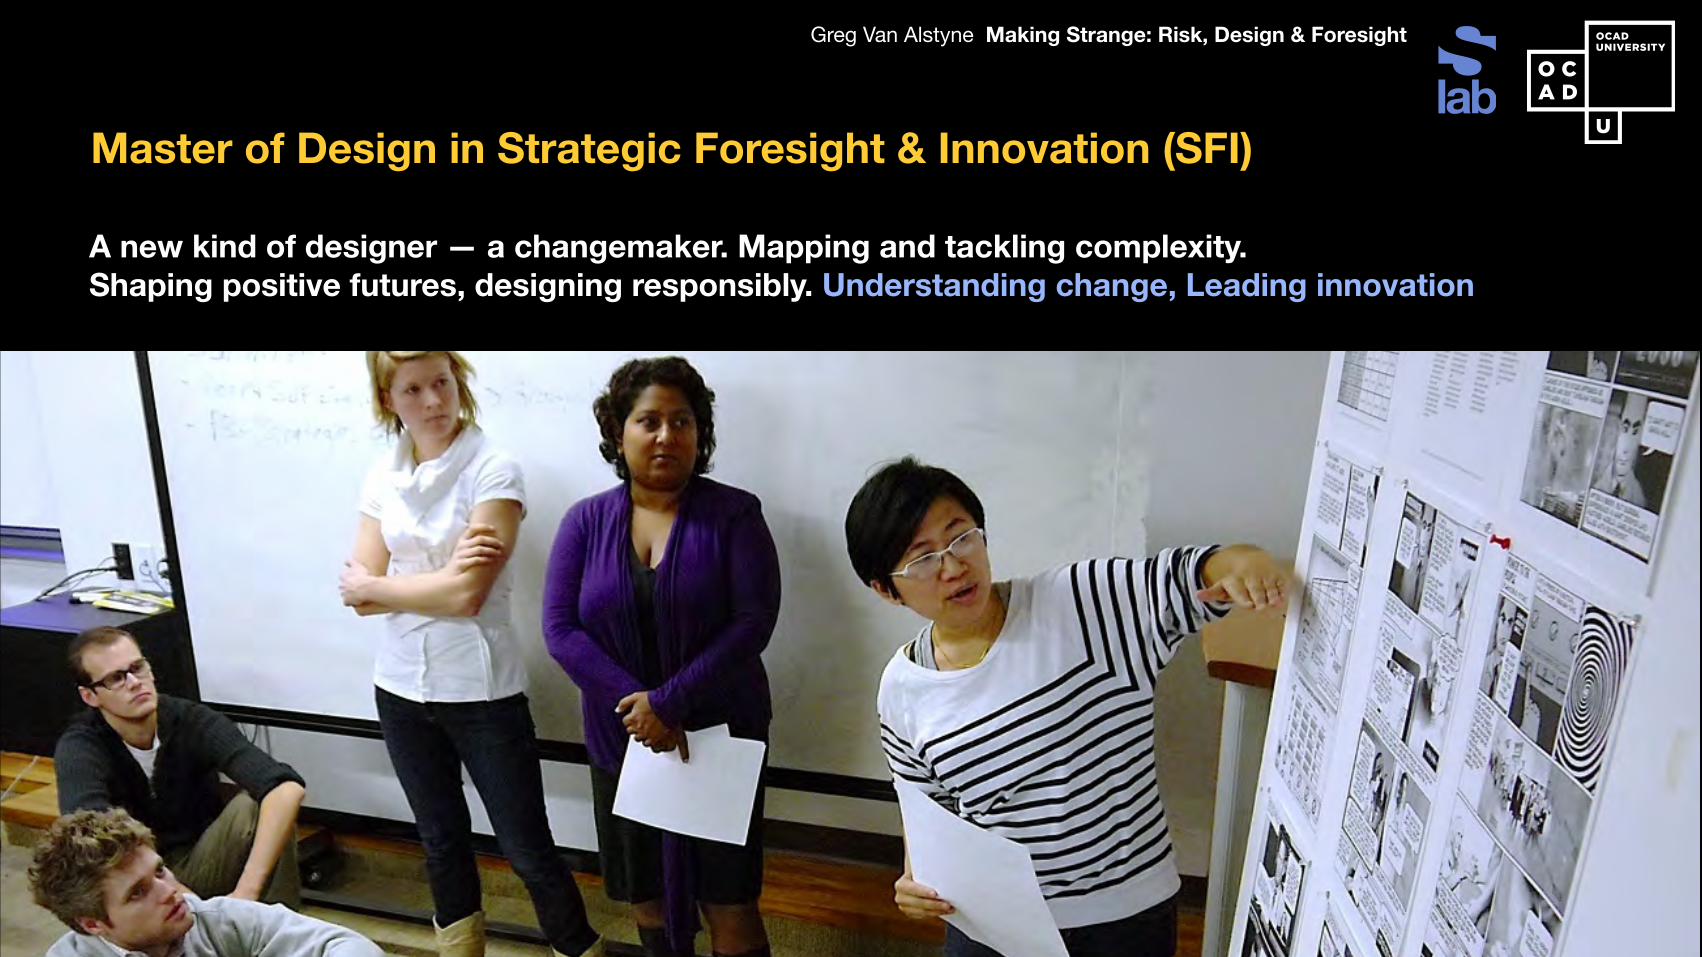
Master of Design in Strategic Foresight & Innovation (SFI)
A new kind of designer — a changemaker. Mapping and tackling complexity. Shaping positive futures, designing responsibly. Understanding change, Leading innovation
Greg Van Alstyne Making Strange: Risk, Design & Foresight
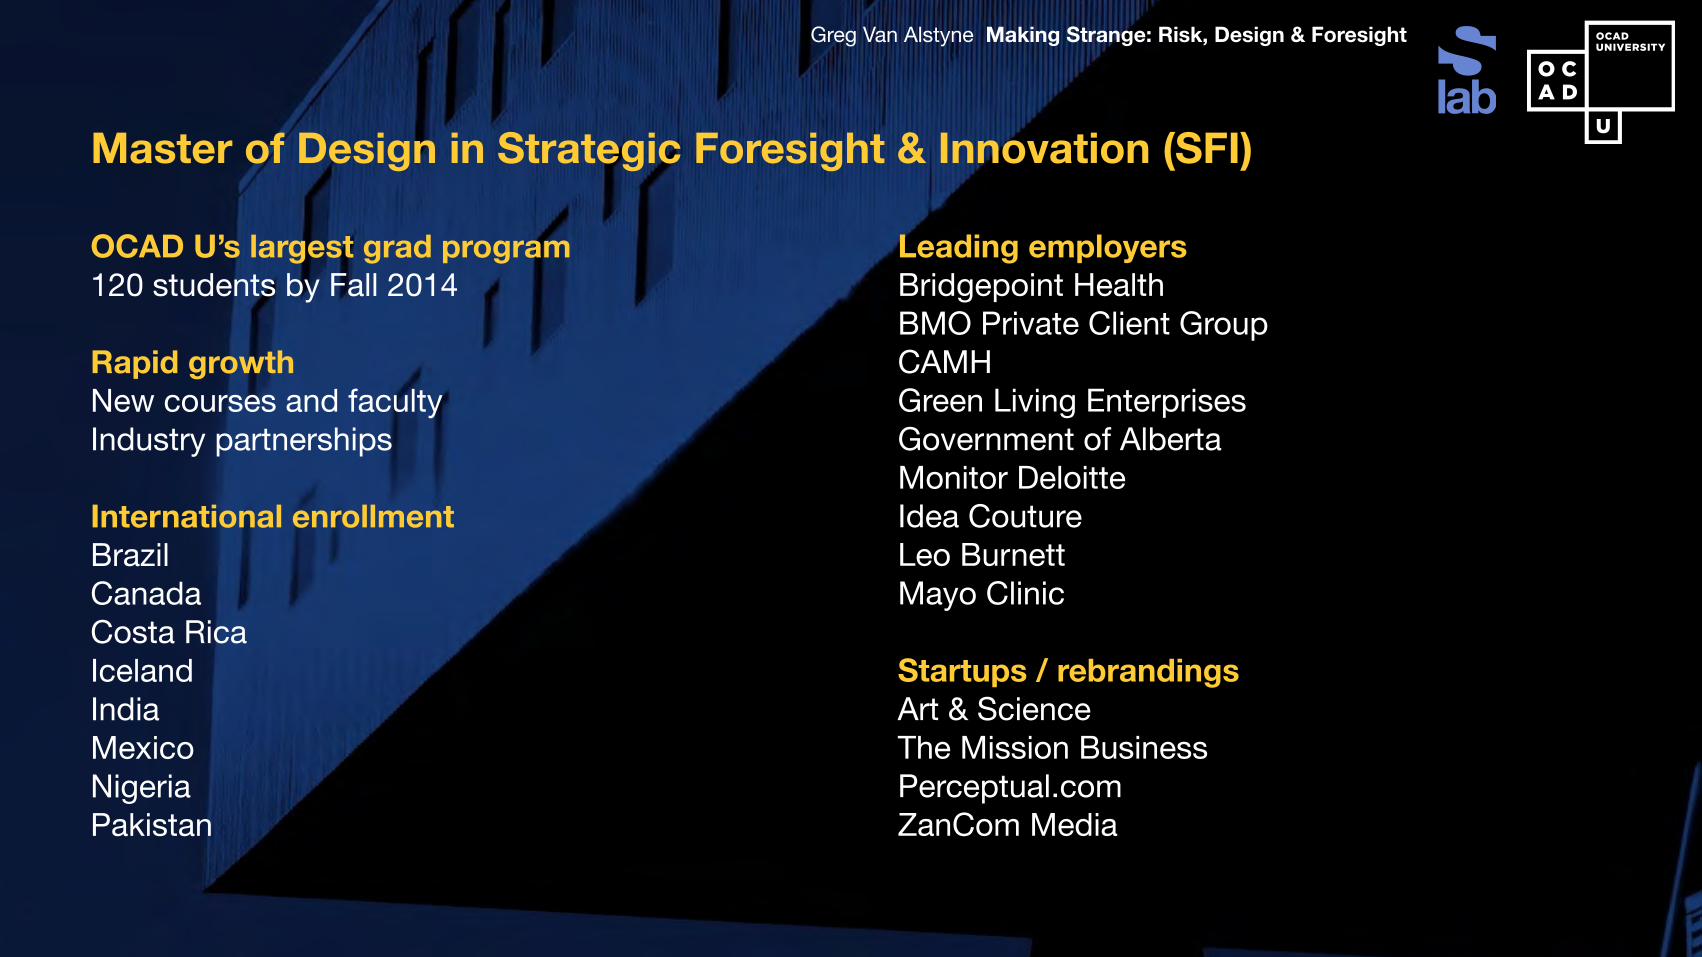
Master of Design in Strategic Foresight & Innovation (SFI)
OCAD U’s largest grad program120 students by Fall 2014
Rapid growthNew courses and facultyIndustry partnerships
International enrollmentBrazilCanada Costa RicaIcelandIndiaMexicoNigeria Pakistan
Leading employersBridgepoint HealthBMO Private Client Group CAMHGreen Living EnterprisesGovernment of Alberta Monitor DeloitteIdea Couture Leo Burnett Mayo Clinic
Startups / rebrandingsArt & ScienceThe Mission BusinessPerceptual.comZanCom Media

Greg Van Alstyne Making Strange: Risk, Design & Foresight
0
5000
10000
15000
Public Non-Unionized Private Non-Unionized Public Unionized Private Unionized
2013201220112010200920082007200620052004200320022001200019991998199719951994199319921991199019891988198719861985198419831982198119801979197819771976
Labour Force 1976 - 2013Public & Private Sector, Union & Non-Unionized
Stable Union Density through 1970s-1990s: Between 35-39%Unions: Manufacturing, male dominated with immense political and economic in!uence
Since 1997 Canada's the unionization rate in the public sector has remained steady at 75%. 660,000 union jobs have been added, with half being contributed to the healthcare sector. The private sector unionization rate continues to decline and dropped from 21% to 17% in 2013,The exceptions being construction at 30% and Manufacturing at 25%. Large public sector unions (public servants, teachers and police) are in stable work environments with strong salaries, bene"ts and pensions. The long-term questions is the "scal sustainability of their wages, pensions and bene"ts which are "nanced by tax dollars.
20151975 1995 201020052000199019851980
Corporation Pays Salaries/
Wages/Benefits
Part of it goes to Union Membership
Dues
ElectUnionOfficer
StrikeFund
Salaries/Operations
CollectiveBargaining
Interests &Dividends
Investments
Elected Officers Manage Spend ofRevenue
Human RightsCode
Charter of Rightsand Freedoms
CanadianPensions
EmploymentInsurance (EI)
OccupationalHealth & Safety
Pay Equity
WorkplaceInsurance (WSIB)
Labour Relations
Sector SpecificLegs/Reg.
EmploymentStandards
Unions
Demographic
Wicked Problem Moving Forward
0
20
40
60
80
100
PublicPrivate
Amount Covered by RPP De"ned Bene"t Plan
In addition to having more RPP coverage, and Bene"t plans, Public sector employees make on average 12% than their private sector counterparts
Economy
Workforce
Unemployed6.9%
Underemployed14.2%
Gen X, Gen Y Baby Boomers
GRAD
FAMILYCAREERSELF
FAMILYCAREERFAMILY
CAREER
-1500000 -900000 -300000 300000 900000 1500000
Males Females
0 to 4 years
5 to 9 years
10 to 14 years
15 to 19 years
20 to 24 years
25 to 29 years
30 to 34 years
35 to 39 years
40 to 44 years
45 to 49 years
50 to 54 years
55 to 59 years
60 to 64 years
65 to 69 years
70 to 74 years
75 to 79 years
80 to 84 years
85 to 89 years
90 to 94 years
95 to 99 years
100 years and over 1975
-1500000 -900000 -300000 300000 900000 15000000 to 4 years
5 to 9 years
10 to 14 years
15 to 19 years
20 to 24 years
25 to 29 years
30 to 34 years
35 to 39 years
40 to 44 years
45 to 49 years
50 to 54 years
55 to 59 years
60 to 64 years
65 to 69 years
70 to 74 years
75 to 79 years
80 to 84 years
85 to 89 years
90 to 94 years
95 to 99 years
100 years and over
Males Females
1995
-1500000 -900000 -300000 300000 900000 1500000
0 to 4 years
5 to 9 years
10 to 14 years
15 to 19 years
20 to 24 years
25 to 29 years
30 to 34 years
35 to 39 years
40 to 44 years
45 to 49 years
50 to 54 years
55 to 59 years
60 to 64 years
65 to 69 years
70 to 74 years
75 to 79 years
80 to 84 years
85 to 89 years
90 to 94 years
95 to 99 years
100 years and over
Males Females
2013
Generation X
Born between: 1965 - 1980World Frame: Slowing economy, political controversiesFamily Structure: Latch key kidsTrust: TechnologyWork ethic: Distrust big orgs, work life balance, independentLoyal to: FamilyValue: Quality of life, involvement, continuous learning
Generation Y
Born between: 1981 - 2002World Frame: Racial & ethnic diversity, instant grati"cation, global warming, recession, dramatic technology changesFamily Structure: Merged familiesTrust: FeelingsWork ethic: Job satisfaction comes from feeling connected to an organizations values and mission, collaborative, participativeLoyal to: Self, familyValue: Recognition, rapid growth, ful"llment
Baby Boomers
Born between: 1946 - 1964World Frame: Economic expansion, abundanceFamily Structure: DivorcedTrust: Their feelingsWork ethic: Success comes from hard workLoyal to: ProfessionValue: Career, achievement
-1500000 -900000 -300000 300000 900000 1500000
0 to 4 years
5 to 9 years
10 to 14 years
15 to 19 years
20 to 24 years
25 to 29 years
30 to 34 years
35 to 39 years
40 to 44 years
45 to 49 years
50 to 54 years
55 to 59 years
60 to 64 years
65 to 69 years
70 to 74 years
75 to 79 years
80 to 84 years
85 to 89 years
90 to 94 years
95 to 99 years
100 years and over
Males Females
2025Manufacturing
Trade
Health care and social assistance
Construction
Educational services
Public administration
Transportation and warehousing
Finance, insurance, real estate and leasing
Agriculture
Other services
Accommodation and food services
Information, culture and recreation
Forestry, "shing, mining, quarrying, oil and gas
Professional, scienti"c and technical services
Business, building and other support services
Utilities
0%
20%
40%
60%
80%
100%
1975 Size of Industry 1995 Size of Industry 2013 Size of Industry
Labour Intensive (Safety and Security)
Technological advances, such as automation, created new demand and freed resources that could then be applied elsewhere, spurring economic growth.
Knowledge Based (Salary and Benefits)
Declining economic and political trade barriers, like NAFTA, opened the marketplace to new goods and services, sparking a realignment of resources to ensure continued economic growth.
Idea Generation (Aligned Values and Balance)
Globalization increased the sharing of knowledge and research, which has shaped market demand, and resources are redistributed to support the changing economic needs.
InformationTechnological
Advances
Global Sharingof Knowledge
EconomicProsperity
Need for New Goods& Service
ResourceRealignment
ReinforcingLoop
MarketDemand
Workplace(Factory)
Mgmt.
Example: Canadian Auto Workers
Collective Agreements
Media
PublicOpinion
Votes
Campaign $
OntarioGovt.
ElectedPoliticians
Arbitrators
LabourRelationsLeg./Reg.
SectorLeg./Reg.
Govt.Inspectors
FederalGovt.
EI &CCP
WSIB Ministryof Labour
Courts
Unions
LegalServices
Worker(Union Member)
StrikeOrganization
WorkplaceRepresentation
PoliticalActivism
Leg./RegLobbying
OtherUnions
Health& Safety
Com
Membershipdues $
Private Sector Unions (Large Manufacturing)
LabourRelationsLeg./Reg.2
SectorLeg./Reg.2
WSIB2
Ministryof Labour 2
MarketDemand
SmallBusiness
Mgmt.
Collective Agreements
Media
PublicOpinion
Votes
Campaign $
OntarioGovt.
ElectedPoliticians
Arbitrators
LabourRelationsLeg./Reg.
SectorLeg./Reg.
Govt.Inspectors
FederalGovt.
EI &CCP
WSIB Ministryof Labour
Courts
Unions
LegalServices
VulnerableWorker
StrikeOrganization
WorkplaceRepresentation
PoliticalActivism
Leg./RegLobbying
OtherUnions
Health& Safety
Com
Membershipdues $
1
2
22 2
3 3
4
5
69
10
1111
12
13
13
14
7
8
EI &CCP3
Arbitrators1
FederalGovt.
3
PoliticalActivism9
Leg./RegLobbying
10
Other
Unions11
Unions11
Legal
Services12
Strike
Organization13
WorkplaceRepresentation13
Health& Safety
Com 14
• Rates of EI coverage have plummeted: 83% of all workers in 1990; 44% in 1997; and 27% in Ontario 2006 (Toronto, 22%)
• EI based on full time employment (36 hours per weeks for >6 months.• Seasonal, causal and precarious workers are not covered.
• Many Federal bene"ts do not cover part-time and precarious work
• Employment Insurance, Canadian Pension Plans and other bene"ts are based on full time (regular) employment thresholds
• Most of the key Labour Relations, WSIB, and Health and Safety legislation is predicated on full time employment, in stable jobs. • Slow pace of legislative (Regulatory) change unable to keep pace with small, fragmented workplaces and emerging work/job arrangements
• Binding arbitration mostly for large workplaces (with unionization)• Smaller legal arbitration exists through legislation (e.g. Human Rights Code)
• Business <20 workers are not required to have a Health &Safety Committee
• Workers must individually report violations to the Ministry of Labour
• Without union representation organized workplace action is high risk to the employee, with none of the legal safe guards
• Most union activism has focused on membership concerns not non-members rights
OntarioGovt.6
• Complexity (and ) diversity of the vulnerable workers resists traditional policy tools
• Strong lobbyist from employer groups to maintain “exceptions” workers protection legislation (e.g. agriculture, small business and retail)
Govt.
Inspectors5• Govt. inspectors (H&S, ES) prioritize larger businesses with worker density
Elected
Politicians4• Illegal workers, precarious workers and new immigrants have low rates (or do not vote)
• Professional advocates (e.g. union staff) lobby to amend legislation/ regulations of interest to their membership.• Advocates tend to assume a position where they talk on behalf of workers, rather enabling their voices
• Unions are funded through membership dues. The strongest unions have a large, stable and (relatively) af!uent membership base. Vulnerable workers are often highly dispersed, with low-density in the worker place (e.g. janitors/ cleaners) making them hard to organize but also with low dues.
• Most union staff and leadership have long tenure ship and do not represent the cultural diversity of modern Canada.
• Access to legal help depends on workers knowing their rights in the "rst place. Workers tend to fall back on their communities
• Government website , typically only offer services in English and French, not immigrant populations typically at risk.
• Legal Aid budgets have been cut progressively. Public
Opinion 8 • (Voting) Public opinion mixed on regularizing precarious employment (homecare/ nannies) • Improved employment standards and minimum wages would increase costs for families
Media 7 • Media covers stories of criminal abuse but rarely systematic problems. With no “dramatic” strikes that have public impacts, vulnerable slip off the news radar
Public Sector Unions/Associations
Taxpayers(electorate)
Taxes$75bn
IndirectServices
Membershipdues $
Funding $Leg/ Reg.
Govt.Unions
PublicSectorUnions
UnionizedStaff
Example: Police Services, Universitiesand School Boards
CollectiveAgreements
CollectiveAgreements
Membershipdues $
Campaign $
HST/ Corp. Taxes
(business)
$
Personal Taxes$24bn
HST-Corp Taxes $29bn
Govt. Transfer$21bn
Non-TaxRevenue
$12bn
Expenditure $114bn
Government
Broader PublicSector
Govt.Mgmt.
Govt.Unionized
Staff
ElectedPoliticians
Arbitrators
LabourRelations Leg./Reg.
AgencyMgmt.
SectorLeg./Reg.
Ministryof Labour
Govt.Debt
$253bn
MunicipalPoliticians
Fed Govt.Transfers
Govt. Agency/Rev (LCBO)
Intereston Debt$10bn
CreditAgency
Courts
Direct Services
Ontario 1.7%-2.5%GDP Growth
Growth in the number of people between the ages of 15 and 64 is expected to decline from 14.5 per cent between 2001 and 2011, to 6.6 per cent between 2011 and 2021. The overall labour force participation rate is also expected to fall in the future, primarily due to an aging population. The participation rate for people over age 65 was 12.6 per cent in 2011 compared to 86.1 per cent for people aged 25 to 54.
14.5%2001-2011
6.6%2011-2021
Declining Workforce Participation
GDP normalized to1997 dollars x $1m
$517,036
Population23,143,275
Union Density32.04% 34.60% 31.25%
29,302,311
35,158,304
$802,674
$1,293,855
Since 1975, Canada’s economy, workplaces and people have change immeasurably. Globalization has driven trade but has also led to the manufacturing sector's decline: the mainstay of the nation’s post-war economy. Increasingly a service based economy, Canada has seen a fundamental shift in the nature of work, types of employment and diversity of workplaces. Gone is the factory !oor, replaced by more part time, casual and even precarious jobs. As work has changed, so has women’s participation in the workforce, cultural diversity driven by immigration and attitudes of different generations in the workplace. These generational attitudes are reshaping how workers connect and value jobs. The post-war Baby Boomer generation
driven by certainty, and now increasingly focused on retirement, is being replaced by a far younger Generation Y who expects to have multiple jobs and even careers. The stable job with de"ned bene"ts is increasingly the preserve of public sector workers. Increasingly, the private sector is fragmenting into a few large employers and small to medium businesses where most new immigrants, contractors, young people, semi-skilled and vulnerable workers earn a living. Traditionally, Unions rooted in a given industry gave workers the collective strength to negotiate: better wages, pensions and bene"ts; improved, safer conditions; and to organize their political muscle to advocate for greater workplace protections. Union membership is on the decline. Although, many laws have
been passed to support and protect workers, like unions they have challenges responding to a new economy with a fragmented, dispersed and isolated workforce.
These tears in the legal and collective architecture designed to protect workers means that there are serious gaps where young, immigrant and semi-skilled workers can be subject to exploitation, unsafe conditions and be “wage poor”. Having rights is a start but being able to exercise those rights is the key, this gigamap is designed to provoke dialogue amongst labour activists to "nd creative and !exible solutions to enable all Canadians to work in decent, safe and protected workplaces.
Public SectorUnions
Private SectorUnions (Large
Manufacturing)
Private SectorUnions (Trades)
Private SectorService EconomyJobs (Large Corp.)
Private SectorService Economy
Jobs (SMEs)Interns
CreativeIndustry
Self-Employed
De!nedPensions
Domestic/CausalWorkers
Underground/LegalWorkers
Salaries/Bene!ts
EmploymentSecurity
EmploymentPay Equity
Health &Safety
WorkConditions
BasicProtection
Vulnerability
Workplace PrioritiesEmployment Security & Degree of Vulnerability
Maslow’s Hierarchyof Needs
Empl
oym
ent S
ecur
ity
Self-Actualization
Esteem
Social
Safety
Physiological
Creative and Generation Y WorkersLevers of protection:• Build strong pathways out of menial jobs to meaningful work through the partnership of employers, post-secondary education and training institutions, and youth representation.
• Incent employers to hire Generation Y employees through tax-breaks, funding and training programs.
• Incent workplaces to experiment with alternative to full time employment, such as job-sharing that enable Baby Boomers to split their jobs with young workers.
• Widened the bandwidth of legal and regulatory protection to include part-time, freelance, sub-contractors and creative industries.
• Expand Generation Y funding to create their own start-up companies.
• Strengthen public awareness of the dangers of the workplace for Generation Y on occupational health & safety, harassment and discrimination, pay equity and employment standards.
Vulnerable Workers Levers of protection:
• Update and expand existing legal “Workers Protection Architecture” to match the growing segmentation of “vulnerable workers”
• Create greater !exibility in working arrangements and protection to re!ect the part-time, causal and seasonal work trends
• Regularize and skill low-paying work to improve pay and conditions, and to enable transitions beyond menial roles.
• Explore how to organize dispersed and small workforces through technology (e.g. social media platforms)
• Provide workers’ protection information in easy to read formats in new immigrant groups’ languages
• Enable community engagement strategies to tackle precarious employment and unsafe working conditions.
• Raise "nes, penalties and punishments for employees exploiting “vulnerable workers” and conditions that lead to death or serious injuries.
Reinforcing Influences Responsible for Economic GrowthTechnological advances and information technology allow for greater sharing and applying of knowledge and research globally. Exposure to global ideas creates demand for new goods and services, requiring resources to be realigned to ensure economic growth.
Workers Protection ArchitectureCanada has built up an impressive foundation of laws and regulations designed to protect workers. Stemming from the from the Charter of Rights and Freedoms the Federal Government and Provincial Governments have an array of laws designed to protect workers. These laws range from the Occupational Health and Safety Acts that proscribe safe working conditions; Pay Equity laws to reduce gender and immigrant gaps in wages and conditions and Labour Relations laws outlining a fair, equitable and neutral process of labour arbitration.
Union Funding and Spending CycleUnions are funded through membership dues that are paid for by taking a portion of their members salaries. Salaries and pay are, more often than not, part of the collective bargaining packages that unions negotiate on the members behalf.
Protecting Canadians & VulnerableWorkers in a Global Economy
2015 Onwards: Fragmented Work, New Sectors and a Service EconomyWicked problem: With a globalized (service) economy, changing generations, how to do create a strong yet !exible workers’ protection where unions (and other social organizations) play a key role in ensuring the betterment of part-time, contract, low-pay and the most vulnerable workers.
What kind of legal, policy, organizational and social protections need to be strengthened (possibly enabled by technology) to provide pathways out of low-pay into careers, and to improve working conditions, pay and conditions for isolated, dispersed and vulnerable/ young workers.
11% of minimum wageemployees are unionized
62%of minimum wageemployees are in Accommodations & Food Services or Trade
59% are part-time employees
Workforce Making Minimum Wage
4.7%in 2000
5.8%in 2009
All Other Industries
Accommodation & Food
Trade
Trade and Accommodations & Food represent 61% of the minimum wage working population
Total Employees on Minimum Wage
Eligible for EI44%in 1997
27%in 2013
Gen Y: Unemployed & UnderemployedGeneration Y is the largest demographic cohort to come after the baby boomers and they make up more than 1/3 of Canada’s population. They are also the most educated and most diverse generation in history, and the "rst to have more women than men obtain postsecondary education credentials.
However, as they started to enter the workforce between 1996 and 2017 they found it hard to "nd jobs and many are currently unemployed or underemployed (an employee that has education, experience, or skills beyond the requirements of the job).
Part of the reason is because Baby Boomers are delaying retirement for a number of reasons: their work-hard mentality, but mainly due to "nancial concerns because the recession impacted their retirement funds.
Sometimes referred to as the “Civic Generation”, 62% of Gen Y approve of Unions, while only 5% are able to participate in union membership.
Vulnerable Workers
(Dispersed/ Homecare/
Small Business)
Traditionalists:Commanding &
Controlling
Baby Boomers:Collaborative
Gen XChildren of
Traditionalists:Rebellious
Gen YChildren ofBoomers:
Participative
Values are not passed sequentially, they leapfrog
People often assume that values are passed on from one cohort to the next but values are actually passed on in a leapfrog sequence because it takes time for a generation to reach parenting age. For example, Traditionalists were typically controlling and so you see the consequences of that in their children, Generation X, who tend to be more rebellious. Alternatively, Baby Boomers gave their children, Generation Y, everything they could, told them they could be anything they wanted and taught them to be collaborative. And so you can "nd numerous articles on how Generation Y values self, can often seem entitled but are very participative.
Mapping and tackling complexity
We map ambiguity & complexity
Maggie Dempster, Pansy Lee, and Simon Trevarthen, 2014PT

Greg Van Alstyne Making Strange: Risk, Design & Foresight
Design thinking is about sensemaking, isn’t it?
Designers excel at coaching, practicing, and theorizing how to make sense of complex or ambiguous situations & information.
Yet sometimes what is needed is not sensemaking. Sometimes what is needed is strangemaking.
That’s where foresight comes in.

Greg Van Alstyne Making Strange: Risk, Design & Foresight
“the ability to create and sustain a variety of high quality forward views and to apply the emerging insights in organizationally useful ways... to detect adverse conditions, guide policy, shape strategy; to explore new markets, products & services.”—Richard Slaughter, 1999
“A systematic, participatory, future intelligence gathering,...vision-building process aimed at present-day decisions & mobilising joint actions”—EC FOREN project
What is foresight?
What is Foresight? sLab & Policy Horizons Canada
Greg Van Alstyne Making Strange: Risk, Design & ForesightWhat are some foresight methods?
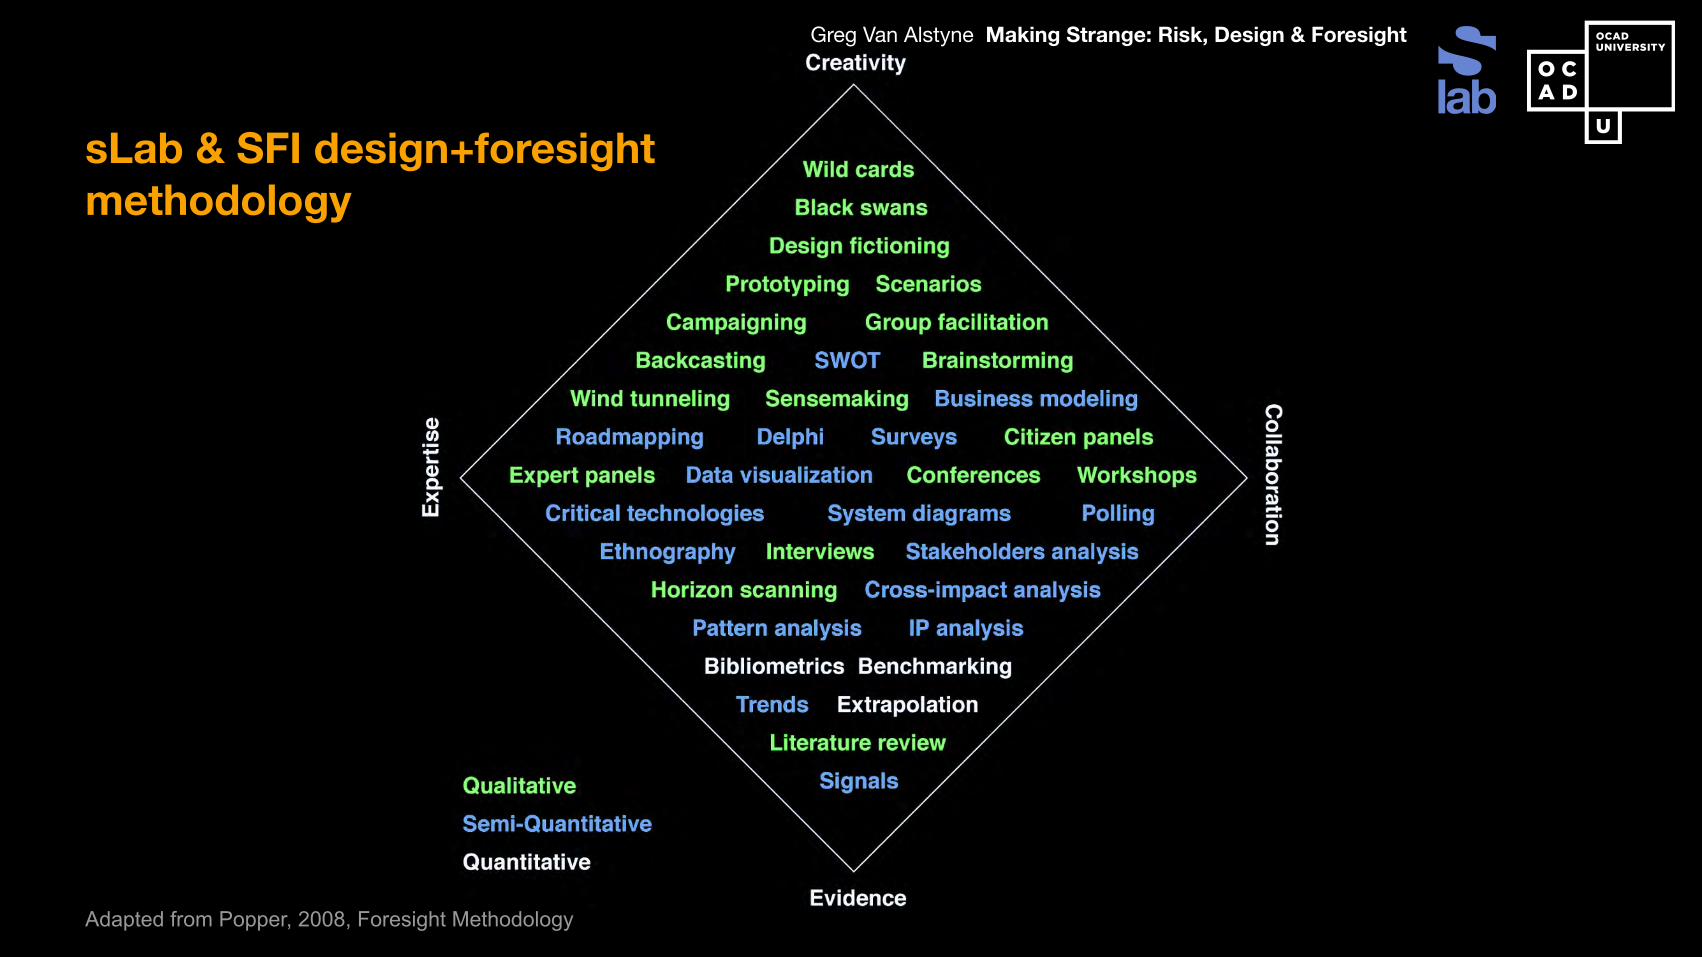
sLab & SFI design+foresight methodology
Adapted from Popper, 2008, Foresight Methodology

Greg Van Alstyne Making Strange: Risk, Design & Foresight
Making strange
SuperStudio, c. 1969
Greg Van Alstyne Making Strange: Risk, Design & Foresight
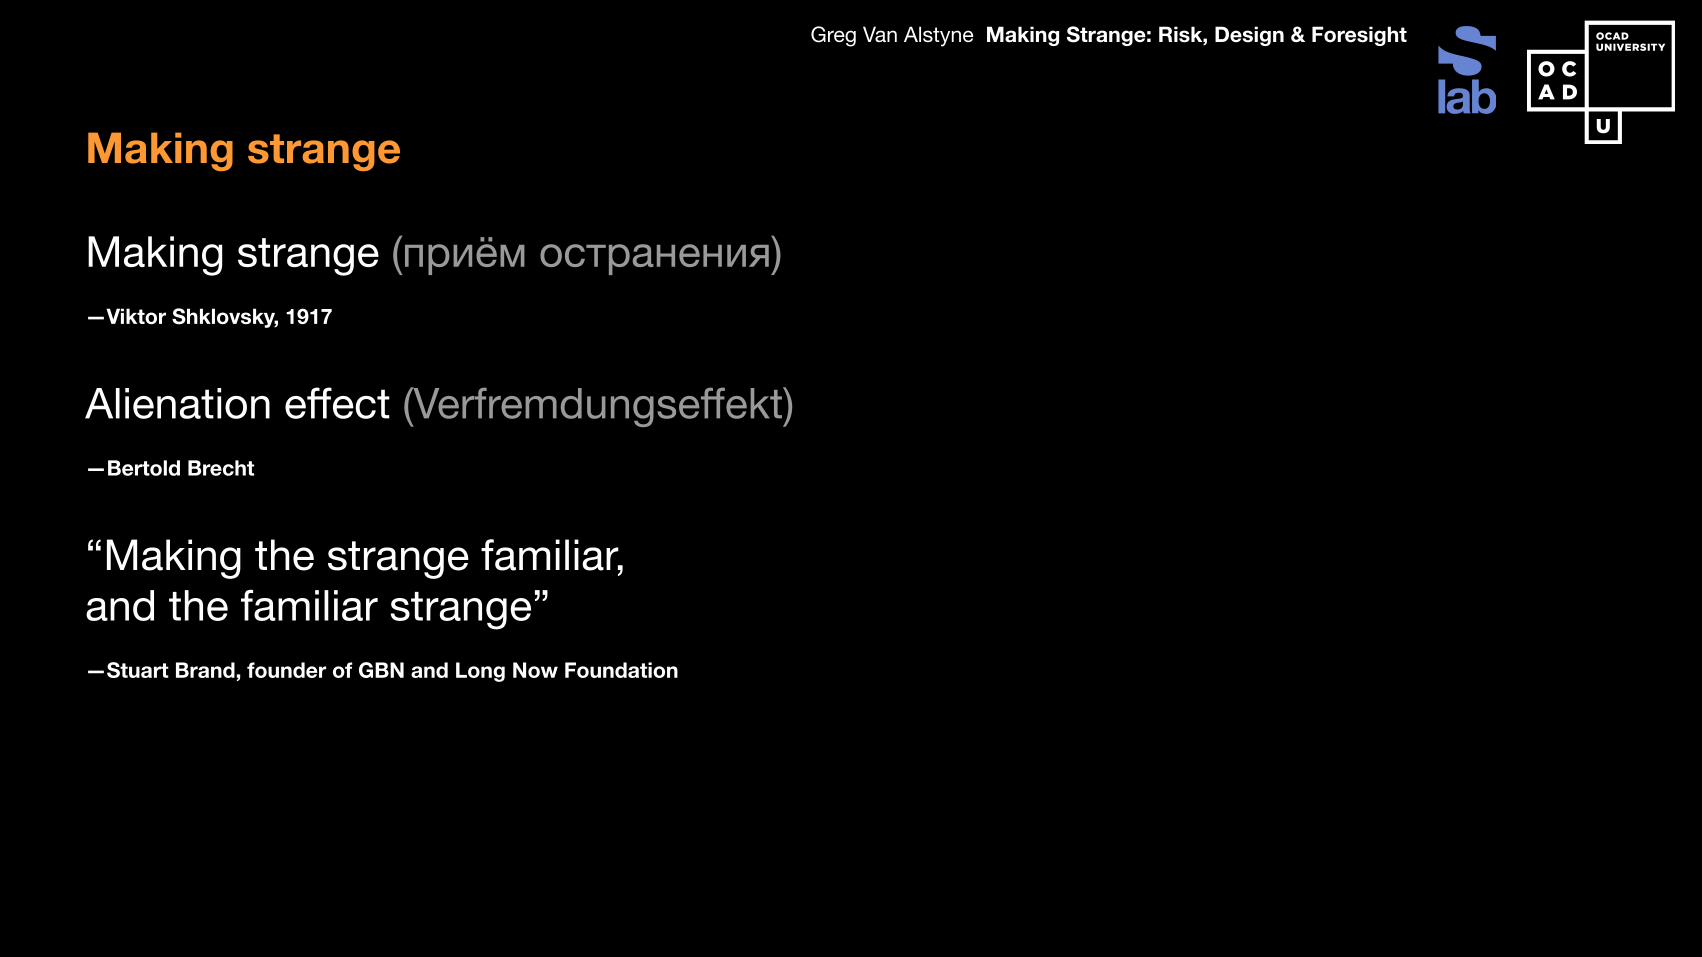
Making strange (приём остранения)—Viktor Shklovsky, 1917
Alienation effect (Verfremdungseffekt)—Bertold Brecht
“Making the strange familiar, and the familiar strange” —Stuart Brand, founder of GBN and Long Now Foundation
Making strange

Greg Van Alstyne Making Strange: Risk, Design & Foresight
Failing better
“All of old. Nothing else ever. Ever tried. Ever failed. No matter. Try again. Fail again. Fail better.”—Samuel Beckett, Worstward Ho
Sara Krulwich/The New York Times. Samuel Beckett’s “Worstward Ho,” staged by and featuring Frederick Neumann, 1986

Design+Foresight at OCAD UTangible Futures, Design Fictions in Helen Kerr’s Leading Innovation, 2012
Robert Mitchell & Laura Fyles

Design+Foresight at OCAD UTangible Futures, Design Fictions in Helen Kerr’s Leading Innovation, 2012
Ben McCammon, Rich Norman, Kelvin Kwong

Design+Foresight at OCAD UTangible Futures, Design Fictions in Helen Kerr’s Leading Innovation, 2012
Ben McCammon, Rich Norman, Kelvin Kwong

Figure 13: A Gephi visualization depicting the network of interactions on Twitter
between ByoLogyc staff (grey), ByoLogyc websites (blue), EXE (red),
and ZED.TO participants (green). (2012) 32
58
32 A high-resolution version of this visualization is available for download at:http://www.trevorhaldenby.com/data/byologyctwitter.pdf
altered states through biotechnologyin science fiction cinema
trevor haldenby [email protected]
Advised by Greg Van Alstyne Director of Research, Strategic Innovation Lab
Design+Foresight at OCAD UGraduate thesis and indie studies
Trevor Haldenby (2013) Bringing the Future to Life: Pervasive Transmedia Scenarios and the World of Worlding

Critical Design “Use of speculative design proposals to challenge narrow assumptions, preconceptions and givens about the role products play in everyday life...”Dunne & Raby. http://www.dunneandraby.co.uk/content/bydandr/13/0
Design Fiction “The deliberate use of diegetic prototypes to suspend disbelief about change”Bruce Sterling. @bruces quoted in @futuryst Stuart Candy 29 Jan, 2012
Science Fiction Prototyping“What if we could use stories, movies and comics as a kind of tool to explore the real world implications and uses of future technologies today?”Brian David Johnson (2011). Science fiction prototyping: designing the future with science fiction. Morgan & Claypool.
Design+Foresight at OCAD UDeveloping a language
Greg Van Alstyne Making Strange: Risk, Design & Foresight
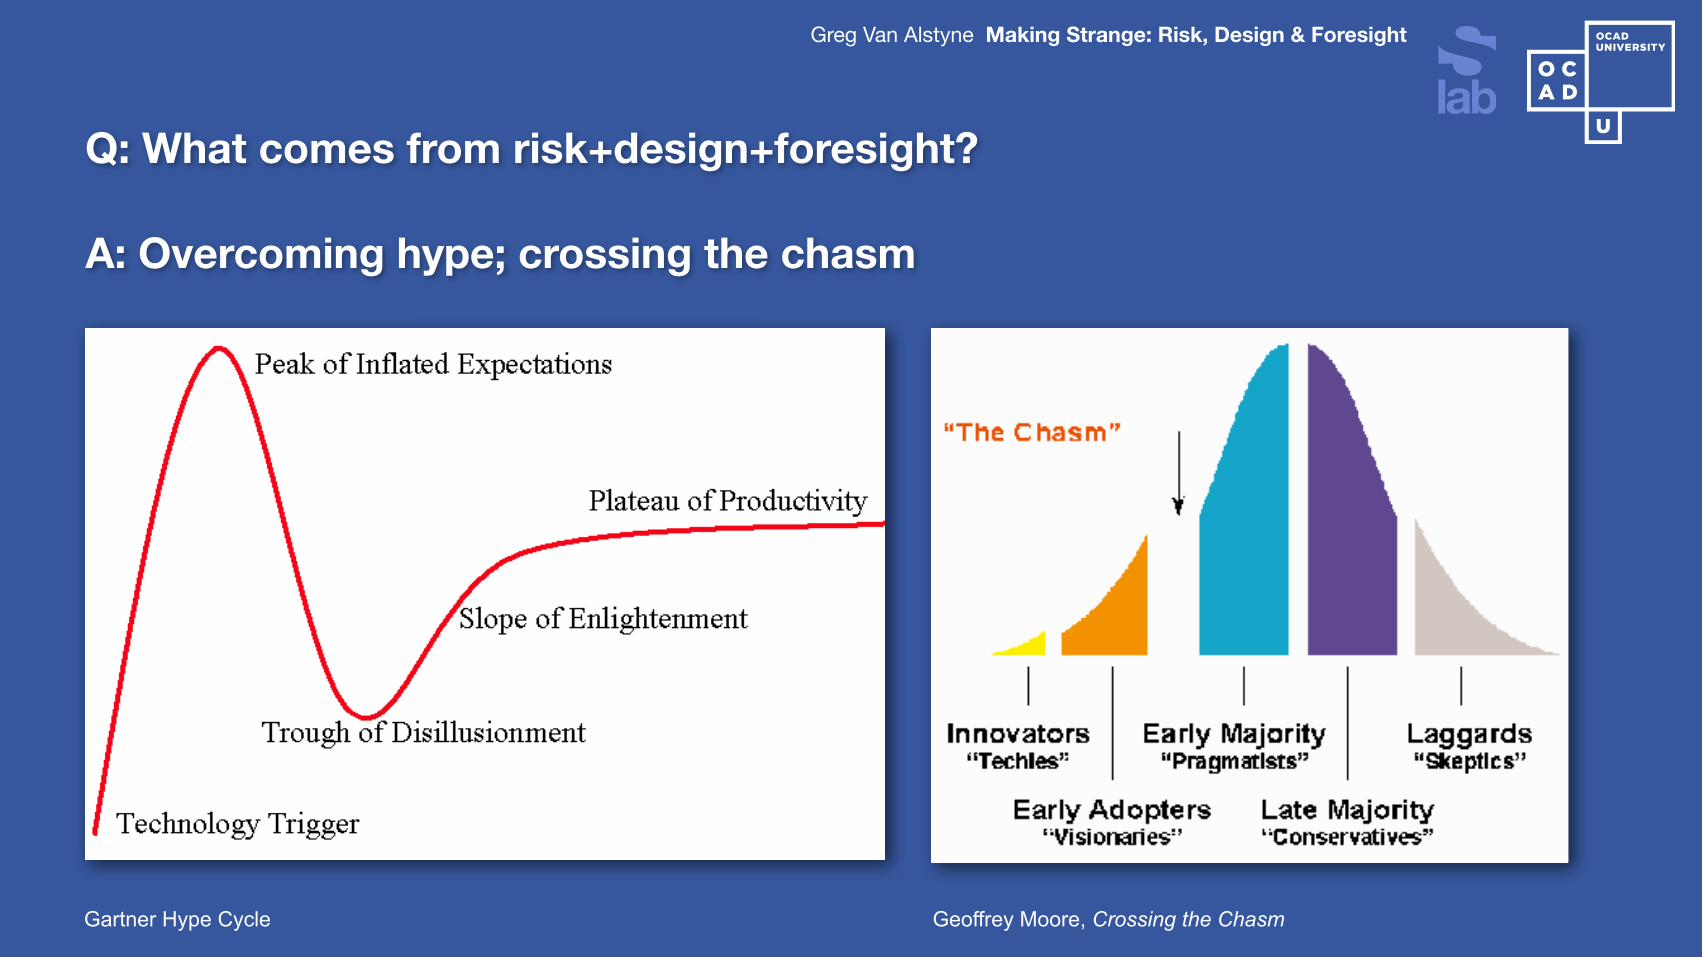
Q: What comes from risk+design+foresight?
Gartner Hype Cycle Geoffrey Moore, Crossing the Chasm
A: Overcoming hype; crossing the chasm

Greg Van Alstyne Making Strange: Risk, Design & Foresight
Q: What comes from risk+design+foresight?
A: Social innovation
“Optimism is a moral choice, it’s a business choice... which is a healthy progression for change” @chelseaclinton @clintonfdn #cgi2014

Greg Van Alstyne Making Strange: Risk, Design & Foresight
Q: What comes from risk+design+foresight?
Jonathan Massey, “Risk Design,” The Aggregate website, http://we-aggregate.org/piece/risk-design. Photo CC flickr.com/photos/gareth1953/4158166813/
A: “Risk design” as strategy
“By soliciting risks and handling them ostentatiously yet seemingly effortlessly, [Norman Foster’s “Gherkin” building] accrued capital for the clients and the City of London, for the architects and their consultants—and also for design as a risk management practice. With each solicitation, gain, & management of risk, the design acquired agency by becoming a stronger branding instrument.”

Greg Van Alstyne Making Strange: Risk, Design & Foresight
Many thanks
Greg Van Alstyne Director of Research, Strategic Innovation Lab (sLab)OCAD University