Embed Size (px)
Citation preview

FACTORS ASSOCIATED WITH POVERT Y:A COMPARATIVE STUDY OF
DETERMINANTS OF POVERTY IN BRAZIL AND KOREA
Ana Paula Gomes Matias – M 13089Professor Advisor: Choi Youseok

STATE OF THE PROBLEM• Brazil and South Korea have experienced rapid and
remarkable improvement in economic growth; however, social problems and social inequality also increased. Both countries present a high rate of relative poverty (World Bank, 1990, 2013; OECD, 2013)
• Hardly ever can we find a comparative study of poverty in countries with different historical background, as, for example, a country in East Asia and one South America (Coes, 2007).

PURPOSE OF THE STUDY AND RESEARCH QUESTIONOBJECTIVES:(1)Attempts to look at aspects of poverty to identify the profile of
poor households in Brazil and South Korea;(2)Examines the differences and similarities between Brazil and
South Korea regarding factors that determine poverty.
RESEARCH QUESTIONS:(1) What are the determinants of poverty in individual household
level in Brazil and Korea? (2) What are the differences and similarities of determinants of
poverty status in Brazil and Korea?

RESEARCH METHOD- An empirical quantitative analysis were made through two
data sets: the Brazilian household survey (PNAD 2012) and the Korean Social Welfare Panel (KoWePS 2012).
- Samples: Heads of households - Brazil sample, the total head of households sample are 110, 509 individuals and Korea sums 7,532 individuals.
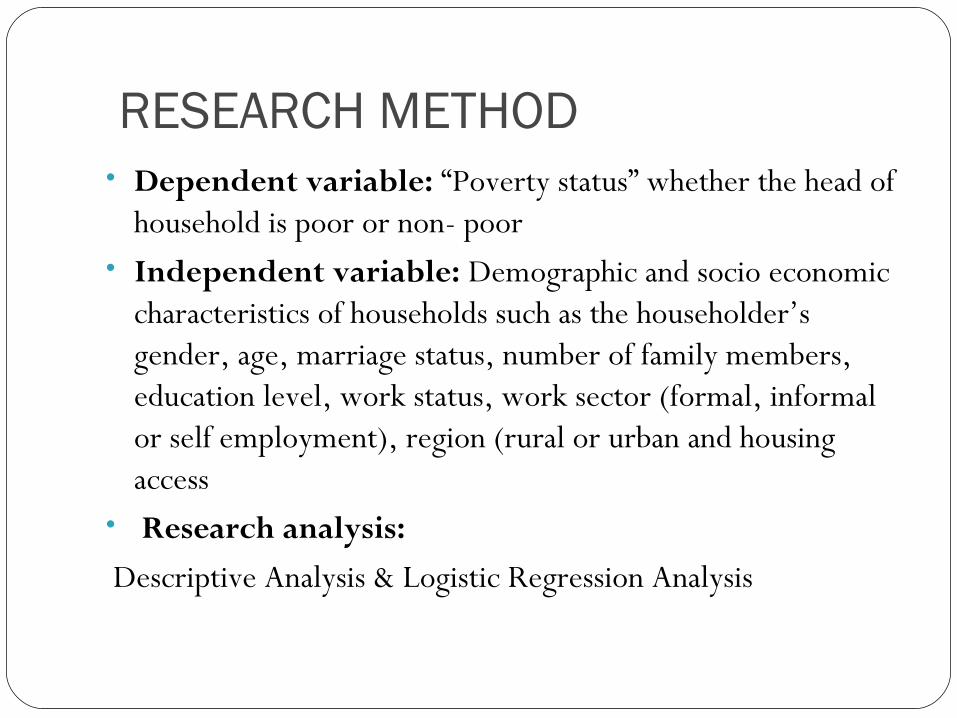
RESEARCH METHOD• Dependent variable: “Poverty status” whether the head of
household is poor or non- poor• Independent variable: Demographic and socio economic
characteristics of households such as the householder’s gender, age, marriage status, number of family members, education level, work status, work sector (formal, informal or self employment), region (rural or urban and housing access
• Research analysis: Descriptive Analysis & Logistic Regression Analysis

RE
SU
LT
SCharacteristics/ HHKorea Regression coefficient Standard Error (S.E.)
Male (female) -.187* .095
Age (70 +)
15 – 29 -.378 .236
30 – 39 -.559*** .106
40 – 49 -.648*** .090
50 – 59 -.505*** .090
60 - 69 -.155 .088
Spouse (non-spouse) -.374*** .098
Education (high School)
Under high school .702*** .078
Over College .414*** .088
Working (not working) -3.577*** .155
Work sector (formal)
Informal 2.110*** .162
Self Employment 2.318*** .160
Family size -.411*** .034
Housing access (rented)
Owned dummy -.527*** .082
Ceded/others dummy .268*** .122
Urban (rural ) -.584*** .076
-2 Log likelihood 6625.748
*p<.05, **P<.01, ***p<.001The categories in parenthesis are reference.
Lo
gis
tic
Reg
ress
ion
An
alys
is:
Ko
rea

RE
SU
LT
SCharacteristics/ HH Brazil Regression coefficient Standard Error
(S.E.)
Male ( female ) -.272*** .017
Age (70 +)
15 – 29 .111*** .032
30 – 39 .027 .029
40 – 49 .043 .029
50 – 59 .029 .029
60 - 69 .033 .032
Spouse (non-spouse ) .324*** .029
Education (high School)
Under high school .663*** .020
Over College -1.295*** .044
Working (not working) -.483*** .018
Work sector (formal)
Informal -.268*** .023
Self Employment -.099*** .019
Family size .544*** .006
Housing access (rented)
Owned -.261*** .022
Ceded/others .340*** .033
Urban (rural ) -.994*** .021
-2 Log likelihood 103237.344
*p<.05, **P<.01, ***p<.001The categories in parenthesis are reference.
Lo
gis
tic
Reg
ress
ion
An
alys
is:
Bra
zil


Brazil and South Korea signif icant results by Logistic regression analysis
BRAZIL
KOREA
• Gender – Male heads of households are less likely to be poor than female;
• Age – The category 15 – 29 years was the only significant and they are more likely to be poor comparing to people over 70 years old;
• Marital Status – People who are married are more likely to be poor than single householder´s
• Education - People who are high educated (over college) are less likely to be poor. On the other hand, people who have low level of education classified as under high school are more likely to be poor.
• Work - People who are working are less likely to be poor. Regarding the work sector, people who have informal and self-employed work comparing to formal are less likely to be poor (contradict result)
• Family size– Larger household’s size was found to have a higher probability of being poor
• Housing Access - People who have house that is ceded or in other condition are more likely to be poor than people who have their house rented. But, people who own a house are less poor than people who rent the house.
• Area - urban area comparing to rural area are less poor
• Gender - Male compared to female is less likely to be poor;
• Age – People who are in age between 30 to 39; 40 to 49 as well as 50 to 59 years old are less likely to be poor than people who are 70 years old or over;
• Marital Status – People who are marriage comparing to single people are less likely to be poor
• Education – The model shows that people who have a higher level of education are more likely to be poor (contradict result)
• Work – Heads of households who working are less likely to be poor than people who are not working. And people who are self-employed or have a informal work have a probability to be poor comparing to people who have formal work
• Family size – Large household’s size are less likely to poor comparing the small one’s.
• Housing Access – High probability of being poor people who live in a house ceded by someone or other unknown circumstances than people who owned a house. Householder´s who owned a house are less likely to be poor.
• Area – people who live in urban are comparing to rural area less poor.

CONCLUSIONDeterminants of Poverty similarit ies & differences
BRAZIL KOREA
Poor people live in big family size
Adolescent and young (20s) age are the poorest
High level of Low education among poor heads of households
High level of poor elderlypeople (over 70 age)
Poor people live in small family size
Female head of households
High level of working poor (informal workers)
High rate of unemploymentRural areas

Ana Paula G. Matias