Embed Size (px)
Citation preview

NORTH OAKLAND COMMUNITY ANALYSIS
CONNECTING COMMUNITY PROVIDING A TRANSPORTATION VISION FOR THE FUTURE

INTRODUCTION
SECTION I

INTRODUCTION | KEY QUESTIONS
• Who are we? • Who is this research for? • What will we be talking about today?
STUDY AREAS

COMMUNITY ASSETS
Learning from the Fruitvale experience
Activating the MacArthur BART Station
Leveraging the Temescal Commercial Core

How do we improve the transportation network • To serve existing and
anticipated residents and businesses?
• To create a pleasant efficient and safe multimodal neighborhood and corridor?
GUIDING QUESTIONS

PLANS SB 375/AB32:
• Reduce GHG emissions by connecting land uses with transportation
Priority Development Area • MacArthur Transit Village
Complete Streets • Redesign and repaving of Telegraph Avenue

MARKET “Bay Area nears record levels of employment” November 8, 2014
“Oakland’s promise as solution to Bay Area’s housing crunch” June 27, 2014
“Hot Oakland neighborhood Temescal lands another apartment project” December 2, 2014

HOT ISSUES • What are impacts of Complete Streets
on parking? • Will current building pattern create
congestion without supporting additional retail (groceries)
• Bikers are unhappy with bike lanes

METHODOLOGY Plan Bay Area
Development
Pipeline
TOD Literature
Surveys
Interviews
Site Visits
Traffic Counts
Business Data
Census Data

Priority development area boundaries, survey locations, and transportation studies
MAP OF STUDY AREA
PRESENTATION 1. Introduction 2. Built Environment 3. Community Travel Patterns 4. Parking 5. Street Network 6. Conclusions 7. Solutions
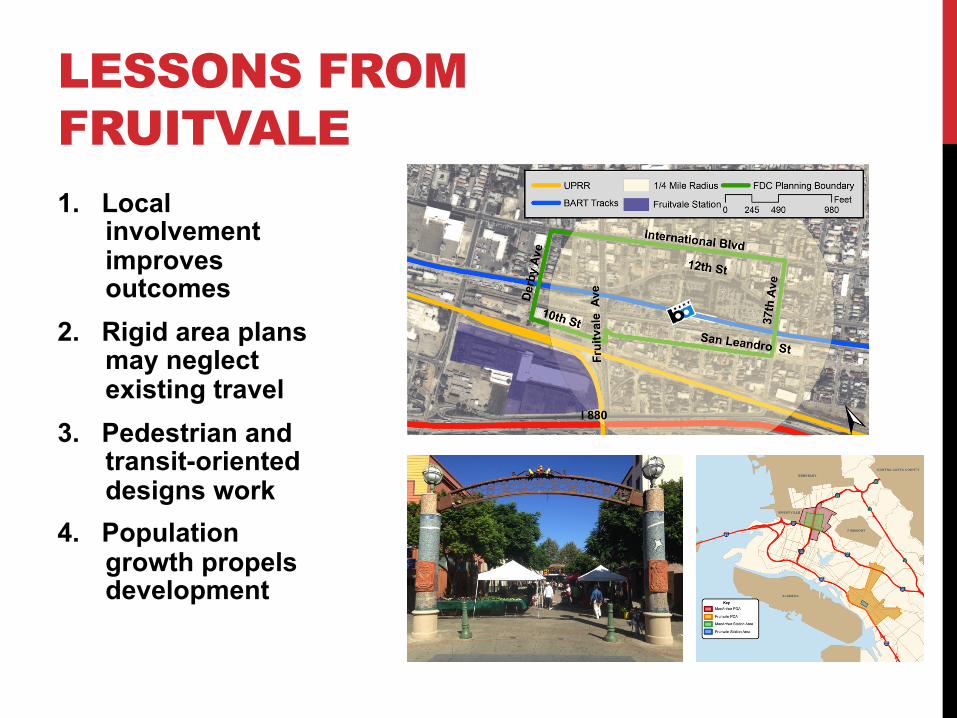
LESSONS FROM FRUITVALE 1. Local
involvement improves outcomes
2. Rigid area plans may neglect existing travel
3. Pedestrian and transit-oriented designs work
4. Population growth propels development

GOALS FOR MACARTHUR STATION AREA Residents
• Support existing residents while developing without displacement
Commerce • Promote local-serving businesses
Mobility • Enable a multi-modal lifestyle
Connectivity • Foster inter- and intra-neighborhood connections
Growth • Accommodate new residents and promote planned growth

BUILT ENVIRONMENT
SECTION II

BUILT ENVIRONMENT | KEY QUESTIONS We wanted to understand the existing built environment: • What is MacArthur BART like? Is it a
community asset? • What are the projections for growth? • Where is the residential development? How
dense? • Where is the commercial development? What
types • What’s missing from the study sites? Are
essential businesses present?

MACARTHUR BART
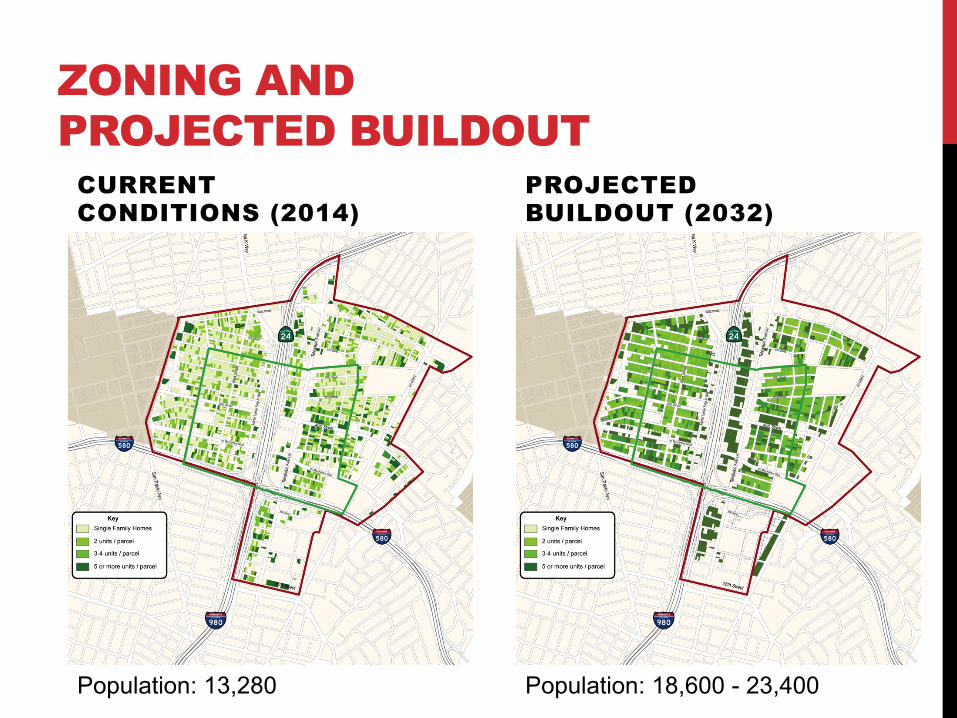
ZONING AND PROJECTED BUILDOUT
CURRENT CONDITIONS (2014)
PROJECTED BUILDOUT (2032)
Population: 13,280 Population: 18,600 - 23,400

POPULATION PROJECTIONS

West Side 90 foreclosures
27% of parcels
East Side 21 foreclosures
12% of parcels
FORECLOSURES 2007-2011

“The west side of the neighborhood is desperately in need of revitalization”
WEST SIDE DISINVESTMENT

600 units and 42,500 square feet of retail development
MACARTHUR STATION
PERCEPTIONS More than 50% of merchants interviewed think that MacArthur Station will help their businesses. (+) More people makes the neighborhood more vibrant, event if they don’t patronize businesses
(-) Concerned about traffic and parking management
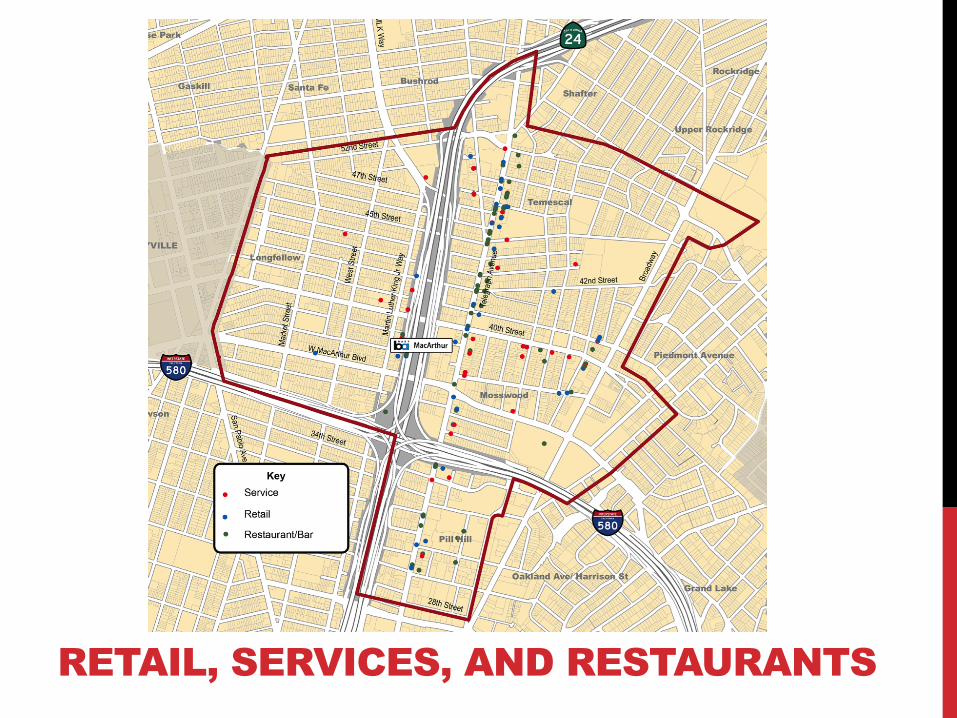
RETAIL, SERVICES, AND RESTAURANTS

We asked area shoppers what they wish were in the neighborhood.
WHAT IS MISSING?
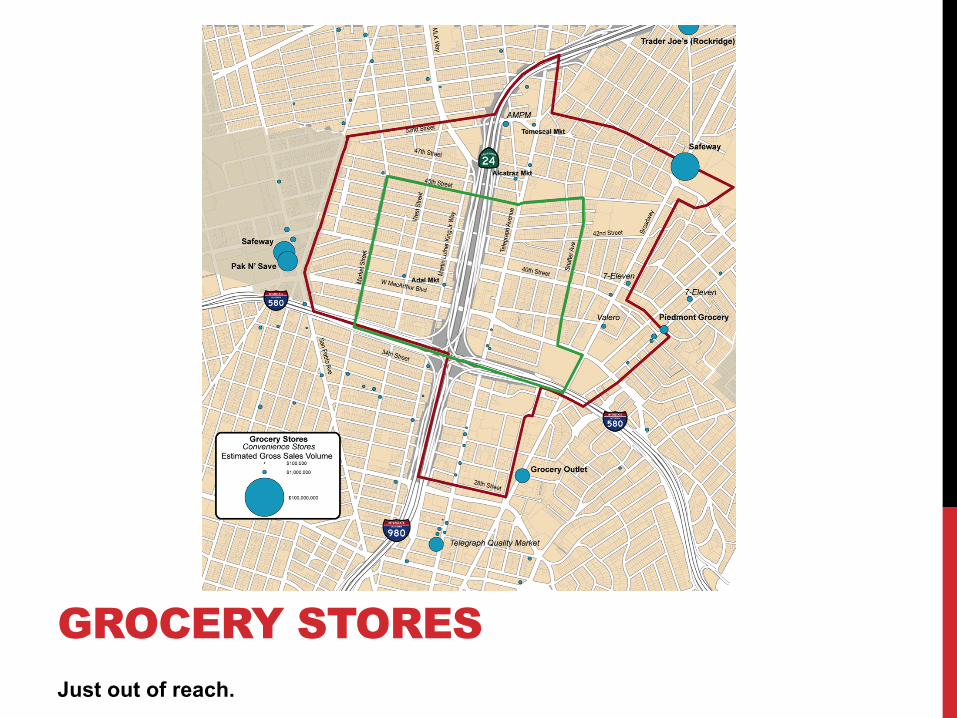
Just out of reach.
GROCERY STORES

KEY TAKEAWAYS • MacArthur BART Station is not a
destination • New development in the pipeline on
the east side with many foreclosures and vacancies on the west
• Demand for grocery stores from residents, shoppers, and merchants

COMMUNITY TRAVEL PATTERNS
SECTION III
COMMUNITY TRAVEL PATTERNS | KEY QUESTIONS • How do residents and visitors get
around? • Are there opportunities to shift modes? • Are most shoppers local? Are they
coming from far away? • Are shopping nodes connected? Or, do
we see division between Temescal and the MacArthur BART station area?
• How will these patterns change with more growth

RESIDENTS | INTERNAL TRIP CAPTURE Residents were more than 5 times as likely to leave the neighborhood for groceries, school, and clothing shopping
Most common trips within the area:
• Restaurant (56%) • Coffee shop (53%) • A friend’s house (42%) • Pharmacy/drugstore
(38%)
Most common trips outside the area:
• Groceries (89%) • Work (69%) • Bank (58%)
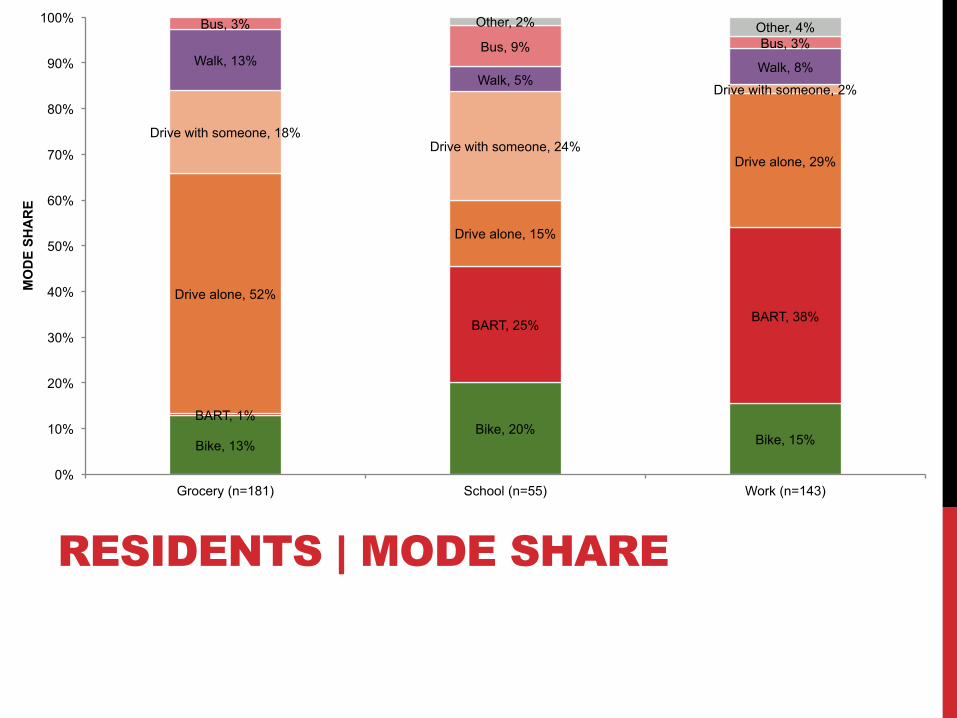
RESIDENTS | MODE SHARE
Bike, 13% Bike, 20%
Bike, 15%
BART, 1%
BART, 25% BART, 38%
Drive alone, 52%
Drive alone, 15%
Drive alone, 29%
Drive with someone, 18% Drive with someone, 24%
Drive with someone, 2%
Walk, 13% Walk, 5%
Walk, 8%
Bus, 3%
Bus, 9% Bus, 3% Other, 2% Other, 4%
0%
10%
20%
30%
40%
50%
60%
70%
80%
90%
100%
Grocery (n=181) School (n=55) Work (n=143)
MO
DE
SHA
RE
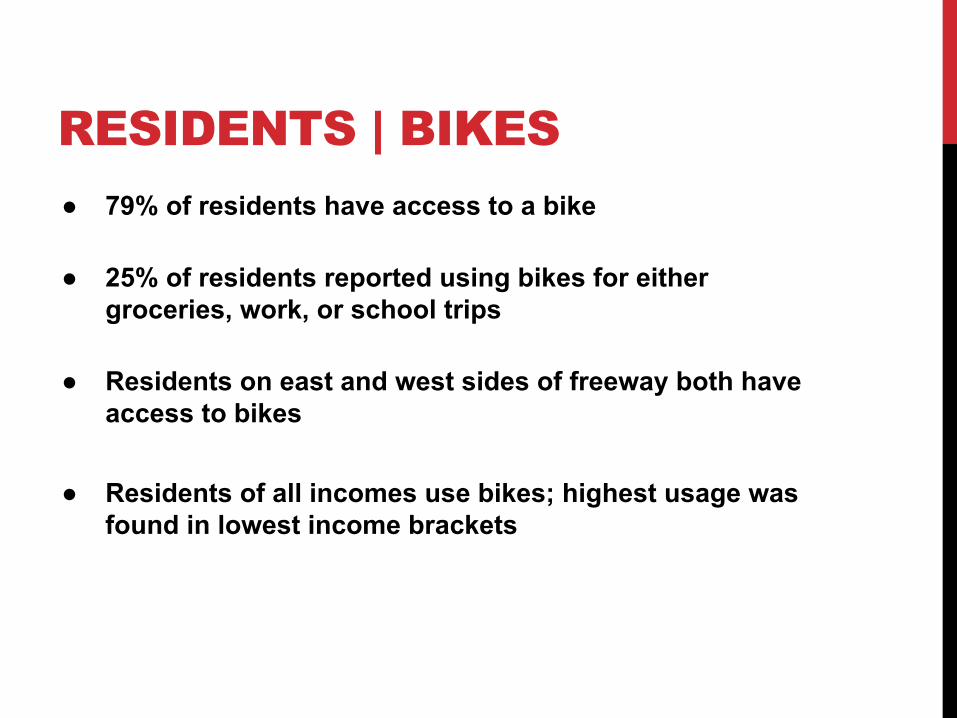
RESIDENTS | BIKES ● 79% of residents have access to a bike
● 25% of residents reported using bikes for either
groceries, work, or school trips
● Residents on east and west sides of freeway both have access to bikes
● Residents of all incomes use bikes; highest usage was
found in lowest income brackets

87% of merchants think that the majority (> 50%) of shoppers drive
SHOPPERS | SURVEY DAY MODE SHARE
BART 16%
Bus 11%
Walk 27%
Bicycle 4%
Drive alone 22%
Drive with friends or family /get dropped off
13%
Multi 6%
Other 1%

SHOPPERS | USUAL MODE SHARE
BART 13%
Bus 10%
Walk 25%
Bicycle 10%
Drive alone 21%
Drive with friends or family /get dropped off
11%
Multi 10%

SHOPPERS | LOCAL VS. REGIONAL
Local 56%
Regional 44%

SHOPPERS | LOCAL VS. REGIONAL
BART, 9% BART, 14%
BART, 19% Bus, 10%
Bus, 12% Bus, 8% Bicycle, 9%
Bicycle, 16% Bicycle, 9%
Walk, 52% Walk, 25%
Walk, 8%
Drive alone, 10%
Drive alone, 16%
Drive alone, 28%
Carpool /get dropped off, 16%
Carpool /get dropped off, 18%
Multi, 10% Multi, 2%
Multi, 9%
Study Area Zip Bordering Regional

SHOPPERS | WHO ARE THE SPENDERS?
$393 $367
$317 $297
$170 $164 $141
$-
$50
$100
$150
$200
$250
$300
$350
$400
$450
Bus Multi Walk Bicycle Drive alone BART Drive with friends or family /get dropped
off
Chart Title

SHOPPERS | MODE SHARES AT NODES
BART, 30
BART, 1
Bus, 12
Bus, 12
Bicycle, 8
Bicycle, 16
Walk, 27
Walk, 32
Drive alone, 11
Drive alone, 37
Carpool /get dropped off, 11
Carpool /get dropped off, 15
Multi, 12 Multi, 10
0%
10%
20%
30%
40%
50%
60%
70%
80%
90%
100%
MacArthur BART Area Temescal

Drive alone 51%
Carpool/dropped off 5%
BART 11%
Bus 0%
Walking 9%
Biking 13%
Multi-Alternative
7%
Multi-Drive 4%
How employees typically get to work
EMPLOYEES | COMMUTE

Source: Fehr & Peers, 2008
BART STATION ACCESS PATTERNS
Walk 29%
Transit 39%
Bicycle 7%
Drop off & Taxi 15%
Drive 10%

KEY TAKEAWAYS • Residents are multimodal • Merchants think shoppers drive to stores, but shoppers
mostly use alternative modes • Shoppers are mostly local
• Bus riders spend the most per month
• Temescal and MacArthur BART shopping areas are disconnected
• Employees drive to work
• Commuters access MacArthur BART via non-auto modes

PARKING
SECTION IV

PARKING | KEY ISSUES • How much parking exists? • Where is there parking? • Is there enough? Is there too much?
• How is parking being used?

Merchant perceptions of quality of shopper parking
MERCHANT PERCEPTIONS
Excellent 20%
Good 6%
Fair/Poor 59%
Don't know/No response 15%

INVENTORY | ON-STREET SPACES INVENTORY SPACES BY BLOCK

PARKING | REGULATION ZONING REGULATIONS

Thursday 10-12pm and Sunday 12-2pm OCCUPANCY AND TURNOVER
SATURDAY 12-2PM THURSDAY 10-12PM

“I usually find parking during work.”
PARKING | EMPLOYEES
Strongly Agree 26%
Agree 54%
Neutral 3%
Disagree 8%
Strongly Disagree 3% N/A
6%

PARKING | WHERE EMPLOYEES PARK
Free
Free
Paid
Paid 0
10
20
30
40
50
60
On Street Off Street

KEY TAKEAWAYS • Parking is plentiful, but poorly managed • Regulations are disjoined and ineffective

STREET NETWORK
SECTION V

STREET NETWORK | KEY ISSUES • How does the proposed Complete Streets design perform
with future transportation demand in 2017 and 2032 across different modes?
• What barriers exist to the walkability of the area?

WHAT IS COMPLETE STREETS? • Two through lanes of car traffic with one left-turn lane • Buffered bike lane • Some transit islands and bus-only space for stops

VISSIM MODEL SCENARIOS No action
• 2017 base • 2032 growth
Transit-oriented development
• Current infrastructure • Complete Streets
Cars 78%
Bikes 6%
Peds 10%
Bus 6%
Mode Shares 2032 - model a
Cars 66%
Bikes 10%
Peds 17%
Bus 7%
Mode Shares 2032 - model b

CURRENT & NO ACTION CONDITIONS 2014 2017 1,029 trips are generated during the PM peak from PDA project buildout Bad intersections, especially on Telegraph Ave
2032 Poorly performing network → Need to shift modes • 30% of vehicles cannot enter the network • 80% increase in average bike delay
Telegraph Ave & 51st St 52nd St { Telegraph Ave &
Shattuck Ave

2032 scenario with existing infrastructure
MODE SHIFT AND INFRASTRUCTURE

CITYWIDE MODE SHIFTS Multinomial Logit Model Built to incorporate bicycle relevant variables. Used to test effect on mode share of the home to work or school tours. Data California Household Travel Survey
Variables • Bike lanes • Topography • Speed limits • Time • Cost • Distance • Household size

BIKE MODE SHARE PERCENTAGES
6.00%
6.20%
6.40%
6.60%
6.80%
7.00%
7.20%
No Action Lanes and Sharrows (Design Option 1) (Pessimistic) Cycle Tracks and Lanes (Design Option 2)

• Complete Streets Design supports bike and ped mode shift.
• Bike delay is reduced by 25% from 250 to 195 seconds
• Average speed of cars reduces from 12.6 mph to 11.3, a 10% decrease
COMPLETE STREETS | POSITIVE IMPACTS
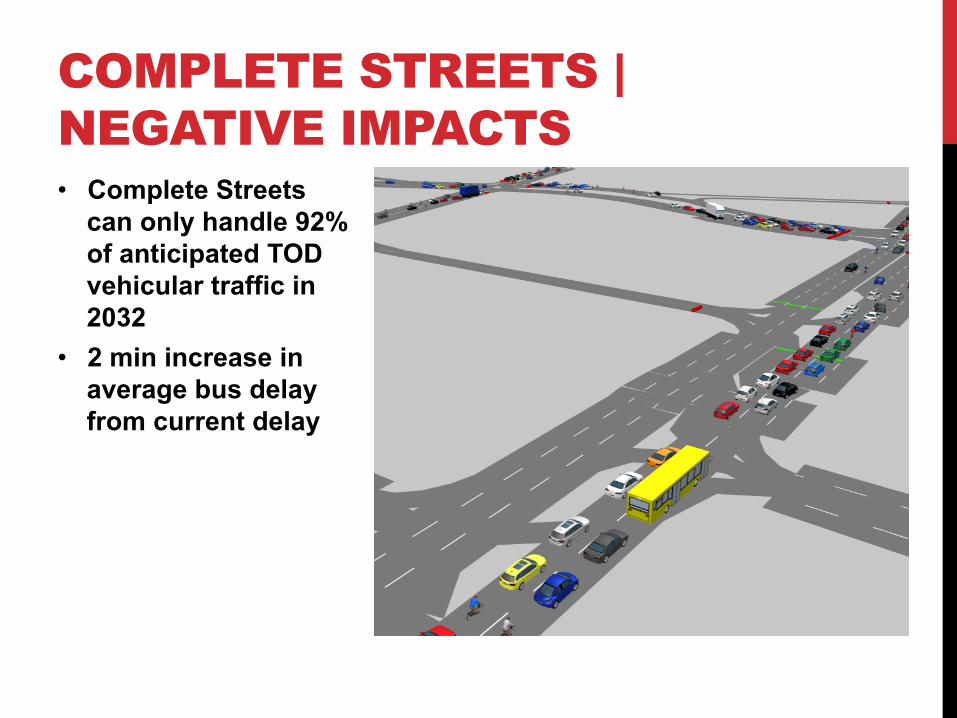
• Complete Streets can only handle 92% of anticipated TOD vehicular traffic in 2032
• 2 min increase in average bus delay from current delay
COMPLETE STREETS | NEGATIVE IMPACTS

50% of through-bikers take Shattuck. Are they being considered?
UNADDRESSED ISSUES

UNDERPASSES | 45TH STREET

UNDERPASSES | 42ND STREET

UNDERPASSES | 40TH STREET

UNDERPASSES | 40TH STREET

UNDERPASSES | MACARTHUR BLVD

UNDERPASSES | RESIDENT PERCEPTIONS
Neighborhood Safety
Neighborhood Safety
Underpasses
Underpasses
0
0.5
1
1.5
2
2.5
3
3.5
4
4.5
5
East West

UNDERPASSES | RESIDENT USAGE
Never
Never
Rarely
Rarely
Occasionally
Occasionally
Frequently
Frequently
0%
10%
20%
30%
40%
50%
60%
70%
80%
90%
100%
East West

PEDESTRIAN WAYFINDING TOO HIGH FOR PEDESTRIANS
TO LOW/SMALL FOR CARS

STREET NETWORK | KEY TAKEAWAYS • Complete Streets plan supports biking and walking, but it
is not enough to avoid congestion from population growth • Complete Streets plan results in increased delay for cars
and buses • Bike travel patterns through Telegraph Ave & 46th and
Telegraph Ave & 40th are not considered in the Complete Streets plan
• Underpasses are neglected and require design focus

CONCLUSIONS
SECTION VI

CONCLUSIONS | RESIDENTS Goal: Support existing residents while developing without displacement ● Current policies do not reduce displacement pressure from
future development.
● There is evidence of sustained disinvestment on the west side of the freeway.
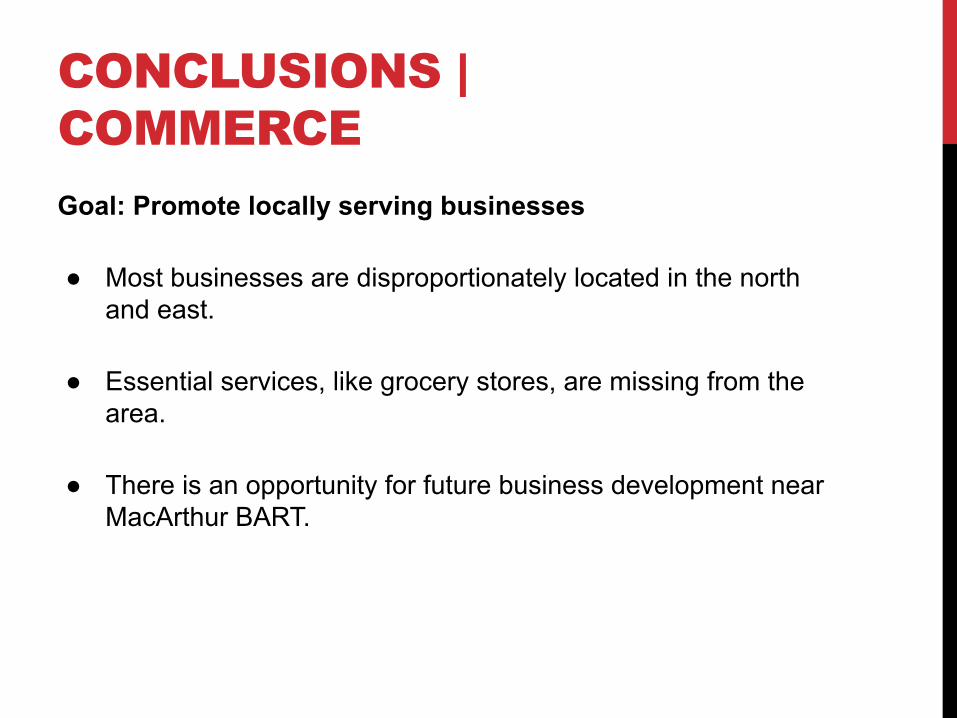
CONCLUSIONS | COMMERCE Goal: Promote locally serving businesses ● Most businesses are disproportionately located in the north
and east.
● Essential services, like grocery stores, are missing from the area.
● There is an opportunity for future business development near MacArthur BART.

CONCLUSIONS | MOBILITY Goal: Enable a multimodal lifestyle ● Current residents are multimodal, but visitors to the
neighborhood are more car dependent.
● The June 2014 Complete Streets Design narrowly supports bicycle and pedestrian activity on Telegraph Avenue, and the plan does not support transit.
● Parking is not being managed strategically.

CONCLUSIONS | CONNECTIVITY Goal: Foster inter- and intra-neighborhood connections ● The design of the street network is fragmented for bicycles
and pedestrians.
● The June 2014 Complete Streets Design does not address most of the significant barriers to a connected street network.
● There are patterns of disconnection in the area: East vs. West and Temescal vs. MacArthur BART.

CONCLUSIONS | GROWTH Goal: Accommodate and promote planned growth and new residents ● Existing policies and public investments are insufficient to
spur development at the level called for by Plan Bay Area. ● A continuation of historical growth trends is not significant
enough to catalyze transformative change in mode shift.

DESIGN AND POLICY SOLUTIONS
SECTION VII
RESIDENTS

Use planned and currently vacant commercial spaces for business types demanded by residents, local shoppers, merchants, e.g. a neighborhood-scale grocery store
RESIDENTS

Study anti-displacement housing policies, such as foreclosure assistance program and financial literacy programs
RESIDENTS

COMMERCE
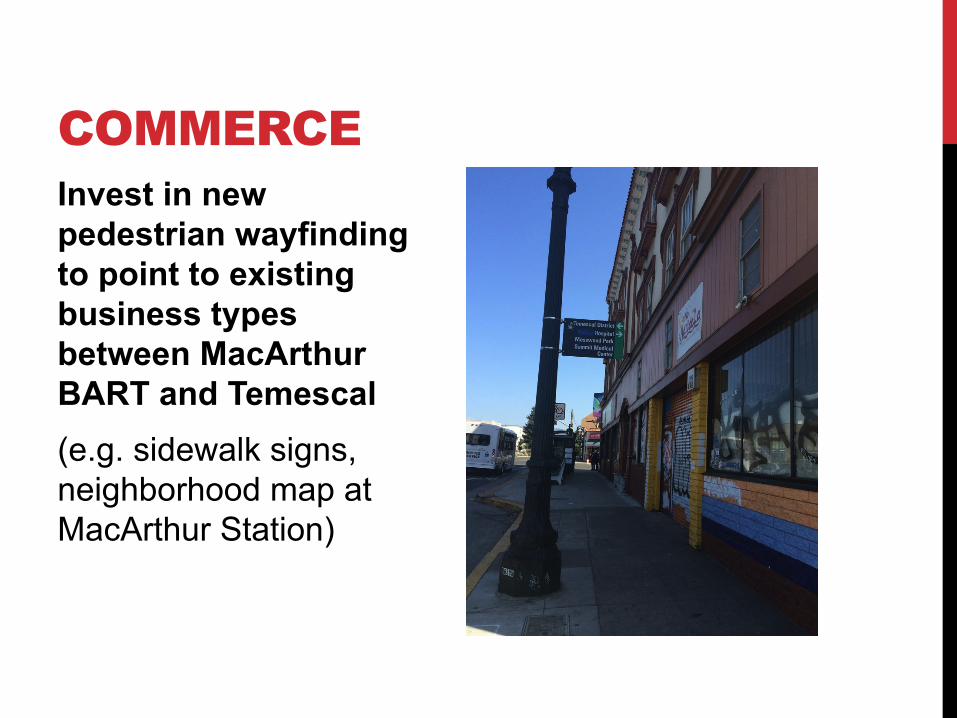
Invest in new pedestrian wayfinding to point to existing business types between MacArthur BART and Temescal (e.g. sidewalk signs, neighborhood map at MacArthur Station)
COMMERCE

COMMERCE Explore expanding the existing Temescal Business Improvement District (BID) or creating a new BID on the west side of the freeway

MOBILITY

MOBILITY | TDM Actively promote mode shift by developing transportation demand management incentives and parking management techniques (e.g. GoBerkeley campaign)

Explore transit improvements, such as dedicated bus lane, a combined bus and bike lane, queue jump lanes, transit signal priority, bulb outs
MOBILITY | TRANSIT

Actively promote a mode shift by investing in bike facilities
MOBILITY | BIKES

MOBILITY | PARKING ● Change parking minimums to maximums
along the major corridors ● Consider relocating metered parking on
Telegraph to shared off-street lots, in the underpasses, and on side streets
● Introduce shared parking for visitors
(shoppers and/or employees), such as partnership with churches with large lots to provide long-term off-street parking

CONNECTIVITY

Redesign underpasses, including new street lighting and pedestrian-friendly signal timing
CONNECTIVITY

UNDERPASSES | MACARTHUR BLVD
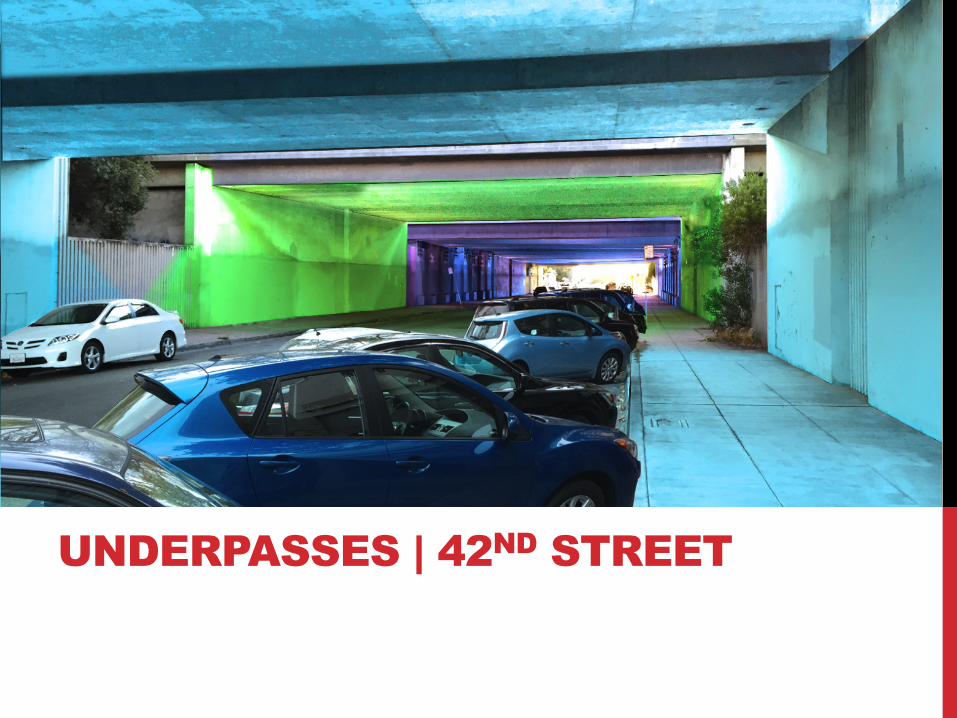
UNDERPASSES | 42ND STREET

UNDERPASSES | 45TH STREET

Incentivize market development at densities similar to that of MacArthur Station around MacArthur BART and corridor
GROWTH

Invest in making MacArthur BART a place, e.g. pedestrianize 40th Street, develop a park, develop new space for retail
GROWTH

40TH STREET REDESIGN

40TH STREET REDESIGN

40TH STREET | WALKING
Wide, well-lit walkway under overpass
Path to 41st Shared Street
Less noise More activity Green Open Space
Easier crossing

40TH STREET | BICYCLING
Bike box
Bike parking Curb protected cycle track
Cycle-activated crossing
Dismount area and raised crossing of transit lane Shared Street

40TH STREET | TRANSIT
Transit / taxi / delivery access only Eastbound stop
Sheltered waiting area for bus, taxi & shuttles
Westbound stop Connection to 1 / 1R
Transit information screens

40TH STREET | RETAIL
Small-format grocery Loading Areas
Food Stands New Retail under Overpass MacArthur TOD
Existing Retail

40TH STREET | PLACEMAKING
Open space
Green plaza & art Street art “Gateway” sculpture
Murals along north wall and lighting under overpass Cafe / biergarten

40TH STREET | PLACEMAKING

SMALL STEPS | 40TH STREET
San Francisco, Flickr user: niallkennedy

NORTH OAKLAND COMMUNITY ANALYSIS
CONNECTING A COMMUNITY AND PROVIDING A TRANSPORTATION VISION FOR THE FUTURE
THANK YOU!
CP 218 | TRANSPORTATION PLANNING STUDIO

¡EXTRA SLIDES!

BART STATION ACCESS
Origins of those walking to BART
Source: Fehr & Peers, 2008
88% of station users originate their trip within 2 miles of the station 29% of station users walk to station 58% of those originate within a ½ mile of station 12% of auto trips to station originate within a ½ mile of station

AN ASIDE ABOUT RETAIL
Angled Parking
“Bajos Puentes” project, Mexico City

AC TRANSIT REROUTES
Angled Parking
After re-route
Today
WB buses turn left EB buses proceed straight
57 & C turn left 31 turns right
40th St & MLK Way MacArthur Blvd & Frontage

AC TRANSIT REROUTES
Angled Parking
Origins of BART patrons accessing station via transit

AC TRANSIT REROUTES
Angled Parking
Origins of BART patrons dropped off at station