Embed Size (px)
Citation preview

BABY BOOMERS IN BOSTONBRA Research Division
November 2015

November 9, 20152
The Baby Boomers are the demographic cohort born between 1946 and 1964
In the United States, the Baby Boomers have been an influential demographic force as they have aged
The Boston situation is different: the Baby Boom population in Boston peaked in 1980 when the Boomers were young adults
Since 1980, the Baby Boomer population of Boston has fallen by about 50%
There were fewer than 120,000 Baby Boomers in Boston in 2013 – 18.5% of the Boston population
Baby Boomers in Boston
Summary

November 9, 20153
The population of Baby Boomers in Boston reached its peak in 1980 when they were 16-34 years old
The Baby Boomer population has been declining since then to a low of 119,568 in 2013
Baby Boomers in Boston
Source: U.S. Census Bureau, 1970-2000 Decennial Census, 2010 & 2013 1-year American Community Survey, IPUMS, BRA Research Division Analysis
230,554 237,000
195,135
140,424
120,252 119,568
-
50,000
100,000
150,000
200,000
250,000
1970 - Ages 6-24 1980 - Ages 16-34 1990 - Ages 26-44 2000 - Ages 36-44 2010 - Ages 46-64 2013 - Ages 49-67
Baby Boomers in Boston

November 9, 20154
The Baby Boomer population of non-Hispanic Whites has fallen dramatically from 167,100 in 1980 to 56,133 in 2013
The Black/African-American Baby Boomer population has also fallen from 46,320 in 1980 to 31,864 in 2013
The Hispanic and Asian Baby Boomer populations have increased since 1980, likely due to immigration
Baby Boomers in Boston
167,100
118,522
67,833 56,072 56,133
46,320
44,419
36,124 32,539 31,864
15,040
20,432
19,163 18,171 17,635
7,020
10,091
9,660 10,640 10,811
-
50,000
100,000
150,000
200,000
250,000
1980 - Ages 16-34 1990 - Ages 26-44 2000 - Ages 36-54 2010 - Ages 46-64 2013 - Ages 49-67
Baby Boomer Population by Race/Ethnicity
White Alone Black/African American Alone Hispanic Asian/Pacific Islander Alone Other
Source: U.S. Census Bureau, 1980-2000 Decennial Census, 2010 & 2013 1-year American Community Survey, IPUMS, BRA Research Division Analysis

November 9, 20155
Baby Boomers are less likely to be Hispanic than the general Boston population – most Hispanics in Boston are younger: 60% are under 35 years old
The share of Baby Boomers who are White or Asian is similar to the Boston population
Baby Boomers in Boston
Source: U.S. Census Bureau, 2013 American Community Survey, IPUMS, BRA Research Division Analysis
46.9% 46.0%
26.6%21.9%
14.7%18.8%
9.0% 8.9%
2.6% 4.4%
0%
10%
20%
30%
40%
50%
60%
70%
80%
90%
100%
Baby Boomers All Residents
Race/Ethnicity in 2013
White Alone Black/African American Alone Hispanic Asian/Pacific Islander Alone Other

November 9, 20156
The foreign-born Baby Boomer population jumped 1980 to 1990 and has remained stable since 1990
The native-born Baby Boomer population fell dramatically from 1980 to 2010
The foreign-born share of the Baby Boomer population rose from 13% in 1980 to 37% in 2013
Baby Boomers in Boston
206,400
150,755
93,961 75,526 75,028
30,600
44,380
46,463 44,726 44,540
-
50,000
100,000
150,000
200,000
250,000
1980: Ages 16-34 1990: Ages 26-44 2000: Ages 36-54 2010: Ages 46-54 2013: Ages 49-67
Baby Boomer Population by Nativity
Native born Foreign born
Source: U.S. Census Bureau, 1980-2000 Decennial Census, 2010 & 2013 1-year American Community Survey, IPUMS, BRA Research Division Analysis

November 9, 20157
37.3% of Baby Boomers in Boston in 2013 were born outside of the United States, significantly higher than the foreign-born percentage for Boston as a whole: 27.3%
60.3% of the foreign-born Baby Boomers and 45.8% of all foreign-born residents are naturalized U.S. citizens
Baby Boomers in Boston
Source: U.S. Census Bureau, 2013 American Community Survey, IPUMS, BRA Research Division Analysis
62.7%72.7%
22.5%12.5%
14.7% 14.8%
0%
10%
20%
30%
40%
50%
60%
70%
80%
90%
100%
Baby Boomers All Residents
Citizenship Status 2013
Native Born Naturalized citizen Not a citizen

November 9, 20158
65.2% of Baby Boomers speak English at home, compared to 61.2% of all Boston residents
The most common other languages are Spanish, Chinese, French, Vietnamese, and Portuguese
Baby Boomers in Boston
Source: U.S. Census Bureau, 2013 American Community Survey, IPUMS, BRA Research Division Analysis
65.2% 61.2%
14.8% 15.7%
4.8% 3.2%4.3% 4.9%2.2% 1.3%
1.7% 1.2%
0%
10%
20%
30%
40%
50%
60%
70%
80%
90%
100%
Baby Boomers All Residents
Language Spoken at Home 2013
English Spanish Chinese French Vietnamese Portuguese

November 9, 20159
About 65% of Baby Boomers and all Boston residents age five and over speak only English at home
Baby Boomers who speak another language at home are less likely to also speak English very well
Baby Boomers in Boston
Source: U.S. Census Bureau, 2013 American Community Survey, IPUMS, BRA Research Division Analysis
65.2%
10.1% 8.2%11.5%
5.1%
64.7%
19.4%
6.4% 6.5%3.0%
0%
10%
20%
30%
40%
50%
60%
70%
Speaks only English at home Speaks another language at home,but speaks English very well
Speaks English well Speaks English, but not well Does not speak English
English Proficiency - 2013
Baby Boomers All Residents 5+

November 9, 201510
Baby Boomers in Boston are fairly evenly distributed at all educational levels
Overall Baby Boomers have somewhat lower educational attainment: 34.1% have a Bachelor’s degree or higher compared to 45.7% of all Boston residents age 25 and over
Baby Boomers in Boston
Source: U.S. Census Bureau, 2013 American Community Survey, IPUMS, BRA Research Division Analysis
19.5%
25.6%
20.9%
16.4%17.7%
13.7%
21.9%
18.7%
25.1%
20.6%
0%
5%
10%
15%
20%
25%
30%
Less than High School High School Some College or Associate'sDegree
Bachelor's Degree Advanced Degree
Educational Attainment
Baby Boomers All Residents 25+

November 9, 201511
About two thirds of Baby Boomers in Boston are in the labor force, either working or looking for work – slightly lower than the labor force participation rate for all residents age 16+ which is 69.1%
Labor force participation rates are about the same for men and women
Baby Boomers in Boston
Source: U.S. Census Bureau, 2013 American Community Survey, IPUMS, BRA Research Division Analysis
67.0% 69.1%
33.0% 30.9%
0%
10%
20%
30%
40%
50%
60%
70%
80%
90%
100%
Baby Boomers All Residents 16+
Labor Force Participation 2013
In Labor Force Not in Labor Force
November 9, 201512
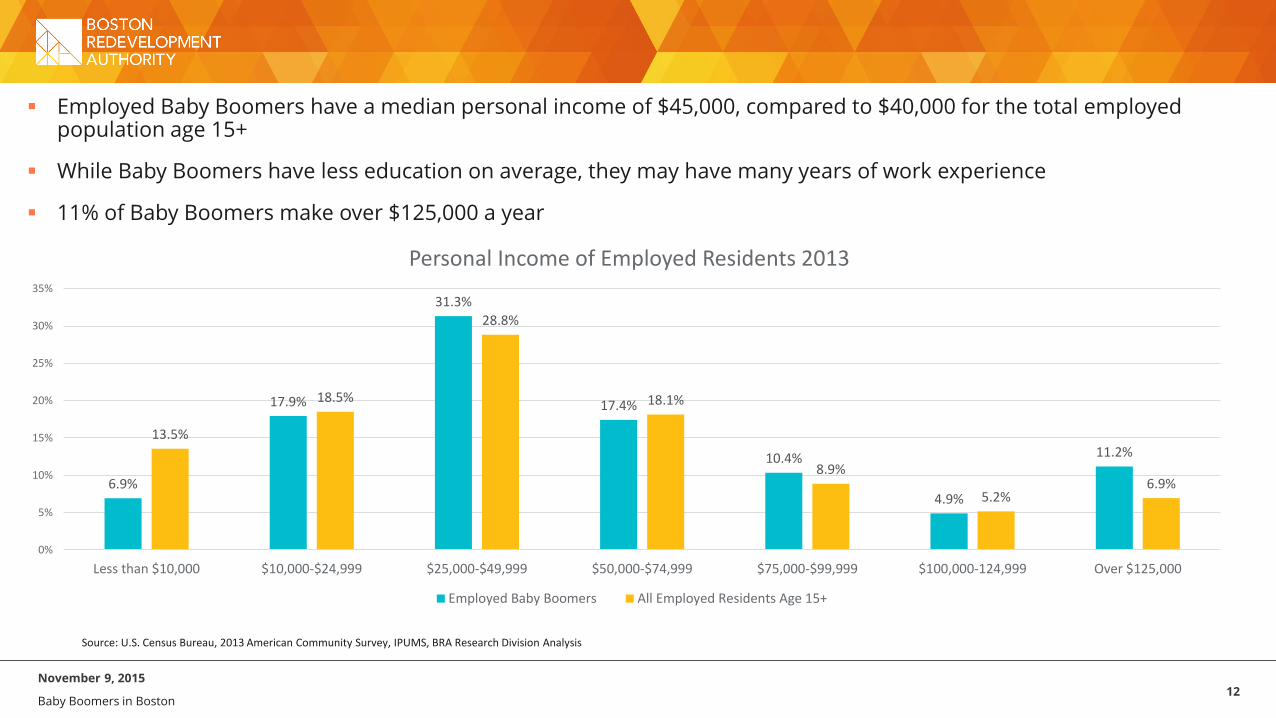
Employed Baby Boomers have a median personal income of $45,000, compared to $40,000 for the total employed population age 15+
While Baby Boomers have less education on average, they may have many years of work experience
11% of Baby Boomers make over $125,000 a year
Baby Boomers in Boston
Source: U.S. Census Bureau, 2013 American Community Survey, IPUMS, BRA Research Division Analysis
6.9%
17.9%
31.3%
17.4%
10.4%
4.9%
11.2%13.5%
18.5%
28.8%
18.1%
8.9%
5.2%6.9%
0%
5%
10%
15%
20%
25%
30%
35%
Less than $10,000 $10,000-$24,999 $25,000-$49,999 $50,000-$74,999 $75,000-$99,999 $100,000-124,999 Over $125,000
Personal Income of Employed Residents 2013
Employed Baby Boomers All Employed Residents Age 15+
November 9, 201513
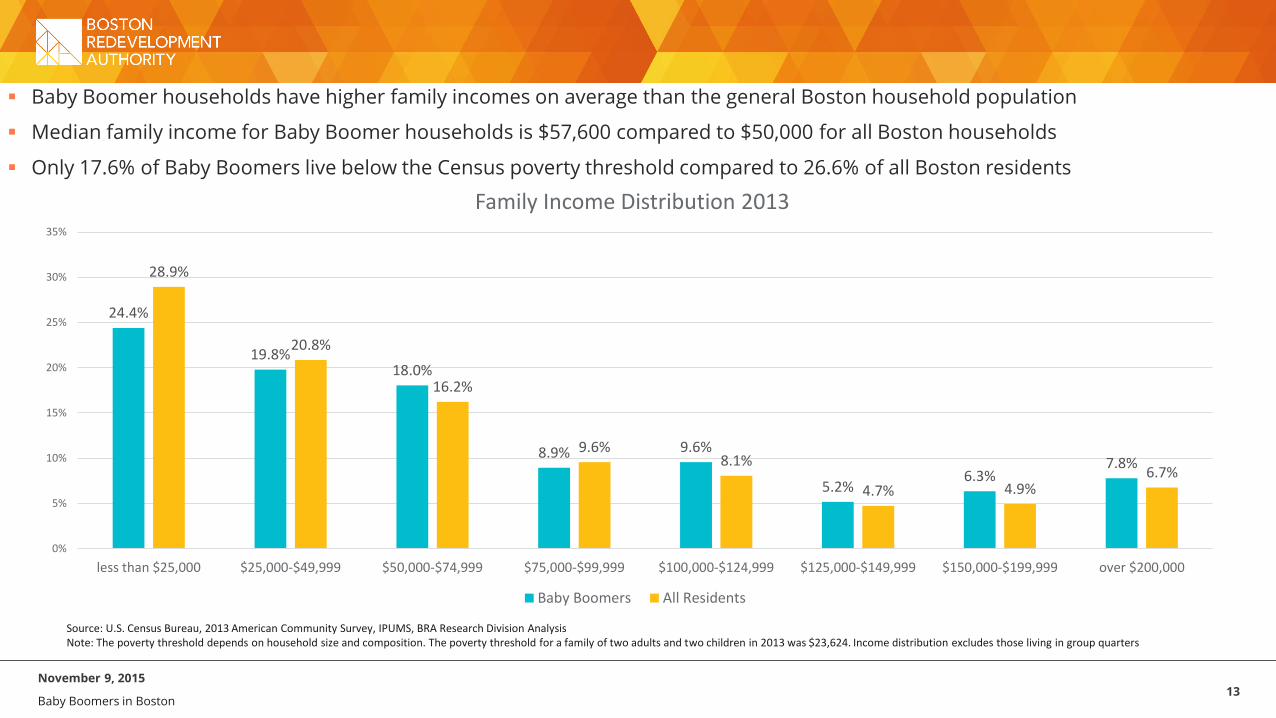
Baby Boomer households have higher family incomes on average than the general Boston household population
Median family income for Baby Boomer households is $57,600 compared to $50,000 for all Boston households
Only 17.6% of Baby Boomers live below the Census poverty threshold compared to 26.6% of all Boston residents
Baby Boomers in Boston
Source: U.S. Census Bureau, 2013 American Community Survey, IPUMS, BRA Research Division AnalysisNote: The poverty threshold depends on household size and composition. The poverty threshold for a family of two adults and two children in 2013 was $23,624. Income distribution excludes those living in group quarters
24.4%
19.8%18.0%
8.9% 9.6%
5.2%6.3%
7.8%
28.9%
20.8%
16.2%
9.6%8.1%
4.7% 4.9%6.7%
0%
5%
10%
15%
20%
25%
30%
35%
less than $25,000 $25,000-$49,999 $50,000-$74,999 $75,000-$99,999 $100,000-$124,999 $125,000-$149,999 $150,000-$199,999 over $200,000
Family Income Distribution 2013
Baby Boomers All Residents

November 9, 201514
Non-Hispanic Whites are the largest group of Baby Boomers to have incomes less than $25,000
However, as a share of their population, Black/African-American, Hispanic and Asian Baby Boomers are more likely to be low income
44% of Hispanic Baby Boomers have family incomes under $25,000
Baby Boomers in Boston
-
1,000
2,000
3,000
4,000
5,000
6,000
7,000
8,000
9,000
10,000
less than $25,000 $25,000-$49,999 $50,000-$74,999 $75,000-$99,999 $100,000-$124,999 $125,000-$149,999 $150,000-$199,999 over $200,000
Nu
mb
er o
f B
aby
Bo
om
ers
Baby Boomer Family Income by Race 2013
White Black/African-American Hispanic Asian
Source: U.S. Census Bureau, 2013 American Community Survey, IPUMS, BRA Research Division Analysis

November 9, 201515
Native-born Baby Boomers have higher family incomes than foreign-born Baby Boomers
23% of Native-born Baby Boomers have family incomes over $125,000 compared to only 13.1% of foreign-born Baby Boomers
Baby Boomers who are naturalized citizens have higher family incomes than those who are not citizens
Baby Boomers in Boston
Source: U.S. Census Bureau, 2013 American Community Survey, IPUMS, BRA Research Division Analysis
-
2,000
4,000
6,000
8,000
10,000
12,000
14,000
16,000
18,000
less than $25,000 $25,000-$49,999 $50,000-$74,999 $75,000-$99,999 $100,000-$124,999 $125,000-$149,999 $150,000-$199,999 over $200,000
Nu
mb
er o
f B
aby
Bo
om
ers
Baby Boomer's Family Income by Citizenship
Native Born Naturalized Citizen Not a Citizen

November 9, 201516
56.5% of employed Baby Boomers living in Boston commute to work by car, compared to 46.3% of all employed residents
73.9% of Baby Boomers live in a household with at least one vehicle, compared to 68.5% of all Boston residents
Baby Boomers are less likely to take public transportation or walk to work than the general employed population
Baby Boomers in Boston
Source: U.S. Census Bureau, 2013 American Community Survey, IPUMS, BRA Research Division Analysis
56.5%46.3%
27.2%
33.2%
9.8% 14.6%
4.3% 3.4%
0%
10%
20%
30%
40%
50%
60%
70%
80%
90%
100%
Baby Boomers All Residents
Commute Mode
Worked at home
Other
Biked
Walked
Transit
Car

November 9, 201517
47.7% of Baby Boomers live in owner-occupied housing, compared to only 32.2% of all Boston residents
Baby Boomers in Boston
Source: U.S. Census Bureau, 2013 American Community Survey, IPUMS, BRA Research Division Analysis
47.7%
32.2%
50.4%
60.4%
1.9%7.4%
0%
10%
20%
30%
40%
50%
60%
70%
80%
90%
100%
Baby Boomers All Residents
Ownership of Residence 2013
Group Quarters
Rented
Owner-Occupied

November 9, 201518
Baby Boomers are less transient than the general population of householders
Over half of all Boston householders have lived in their current residence less than four years, compared to only 30% of Baby Boomer householders
Baby Boomer householders have lived in their current residence for a median of about 10 years, compared to about 4 years for all householders
Baby Boomers in Boston
7.6%
4.8%
17.7%
21.6%
24.5%
14.1%
9.7%
19.8%
8.6%
24.3%
18.0%
14.6%
6.8%7.8%
0%
5%
10%
15%
20%
25%
30%
12 months or less 13-23 months ago 2-4 years ago 5-9 years ago 10-19 years ago 20-29 years ago 30+ years ago
When Boston householder moved into residence
Baby Boomer Householder All Householders
Note: The U.S. Census defines a householder as one of the adults in whose name the housing unit is owned or rented. If the housing unit is owned or rented jointly, either party may be considered the householder.
Source: U.S. Census Bureau, 2013 American Community Survey, IPUMS, BRA Research Division Analysis

November 9, 201519
Migration of Baby Boomers in and out of Suffolk County: 2012-2013
About 6,331 Baby Boomers moved to Suffolk County 2012-2013: 62% from elsewhere in Massachusetts, 26% from other states, and 13% from abroad.
At least 6,041 Baby Boomers left Suffolk County 2012-2013: 67% went elsewhere in Massachusetts and 33% went to other states. An additional unknown number of Baby Boomers left for other countries.
Baby Boomers in Boston
Massachusetts Suffolk County
3,911
4,068
1,6
19
1,9
73
801
?To/from abroad
To/from other states
Source: U.S. Census Bureau, 2013 American Community Survey, IPUMS, BRA Research Division AnalysisNote: Information was not available for those who left the United States. Since they did not reside in the U.S. in 2013, they were not captured in the 2013 American Community Survey

November 9, 201520
The approximately 14,500 Suffolk County Baby Boomers who moved to a new residence 2012-2013 generally did not move far
56.3% moved within Suffolk County and 83.3% moved within Massachusetts
The general population of movers is more likely to come from further away – 19.4% moved from another state and 8.7% moved from abroad
Baby Boomers in Boston
Source: U.S. Census Bureau, 2013 American Community Survey, IPUMS, BRA Research Division Analysis
56.3%
25.4%
1.6%
11.2%
5.5%
48.8%
22.4%
0.6%
19.4%
8.7%
0%
10%
20%
30%
40%
50%
60%
Suffolk County Another county in EasternMassachusetts
Central or Western Massachusetts Another state Abroad
% o
f Su
ffo
lk C
ou
nty
res
iden
ts w
ho
mo
ved
20
12
-20
13
Location of Previous Residence – Suffolk County Residents who moved 2012-2013
Baby Boomers All Suffolk County Residents

November 9, 201521
Approximately 6,041 Baby Boomers moved from Suffolk County in 2012-2013 to other parts of the United States
About two-thirds moved elsewhere in Massachusetts and one-third moved to another state
Florida, New Hampshire, and Texas were the top destinations for Boomers who left Massachusetts
Baby Boomers in Boston
67.3%
32.7%
60.8%
39.2%
0%
10%
20%
30%
40%
50%
60%
70%
80%
Elsewhere in Massachusetts Another State
Current Residence of Former Suffolk County Residents 2013
Baby Boomers All Former Residents
Source: U.S. Census Bureau, 2013 American Community Survey, IPUMS, BRA Research Division AnalysisNote: Information was not available for those who left the United States
November 9, 201522
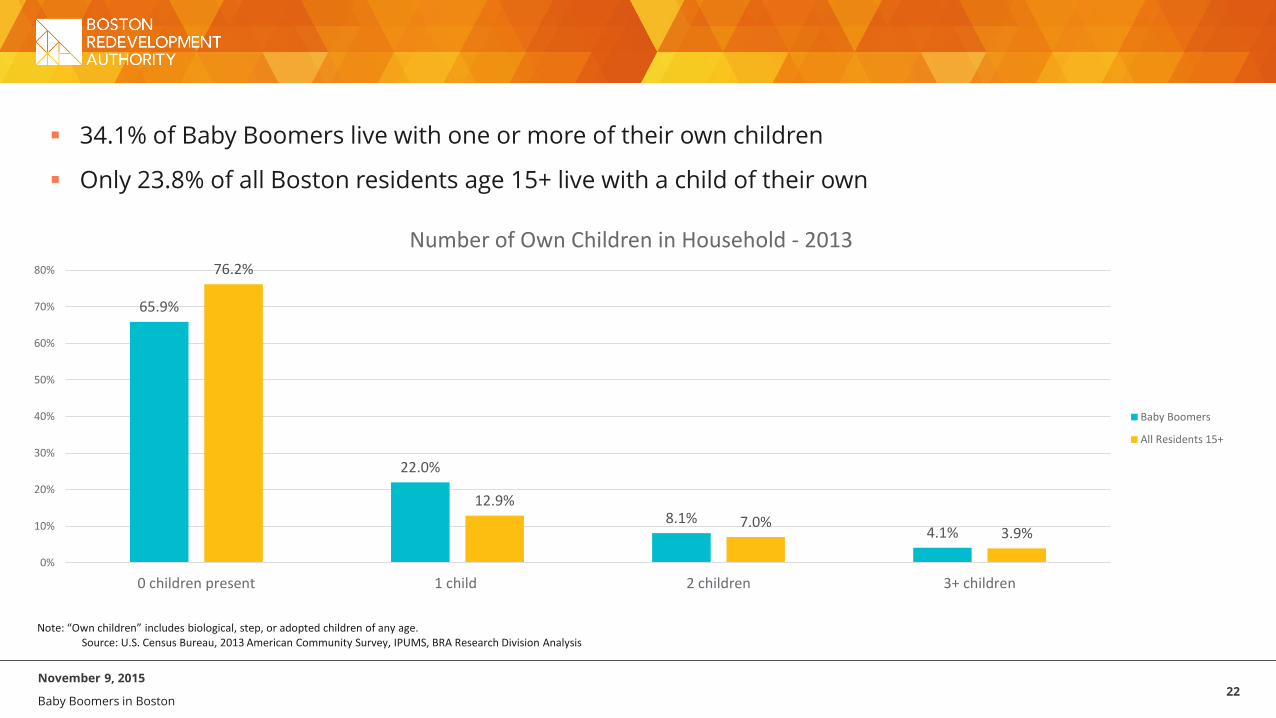
34.1% of Baby Boomers live with one or more of their own children
Only 23.8% of all Boston residents age 15+ live with a child of their own
Baby Boomers in Boston
Note: “Own children” includes biological, step, or adopted children of any age.Source: U.S. Census Bureau, 2013 American Community Survey, IPUMS, BRA Research Division Analysis
65.9%
22.0%
8.1%4.1%
76.2%
12.9%
7.0%3.9%
0%
10%
20%
30%
40%
50%
60%
70%
80%
0 children present 1 child 2 children 3+ children
Number of Own Children in Household - 2013
Baby Boomers
All Residents 15+

November 9, 201523
Almost 44% of Baby Boomers are currently married, but 27.5% are single and have never been married and 28.4% are divorced, widowed, or separated
In comparison, only 28% of all residents age 15 and over are currently married
Baby Boomers in Boston
Source: U.S. Census Bureau, 2013 American Community Survey, IPUMS, BRA Research Division Analysis
44.1
28.4
5.4
2.8
17.6
8.0
5.4
4.5
27.5
56.3
0%
10%
20%
30%
40%
50%
60%
70%
80%
90%
100%
Baby Boomers All Residents 15+
Marital Status 2013
Single, never-married
Widowed
Divorced
Separated
Married