Embed Size (px)
Citation preview
Oregon’s Pedestrian and Bicycle Safety Implementation PlanA Data-informed Approach to Reducing Crashes
March 30, 2015
Casey Bergh, PE

Outline
How have we been using data to address pedestrian and bicycle crashes?How does the Pedestrian and Bicycle Safety Implementation Plan advance the practice?Where to go from here?

Evolution of Pedestrian and Bicycle Safety Evaluations
Concern or perceived safety problem
Crash event (observed)2010
Crash potential (risk)2014
Goal: reduce frequency and severity of crashes involving pedestrians and bicyclists
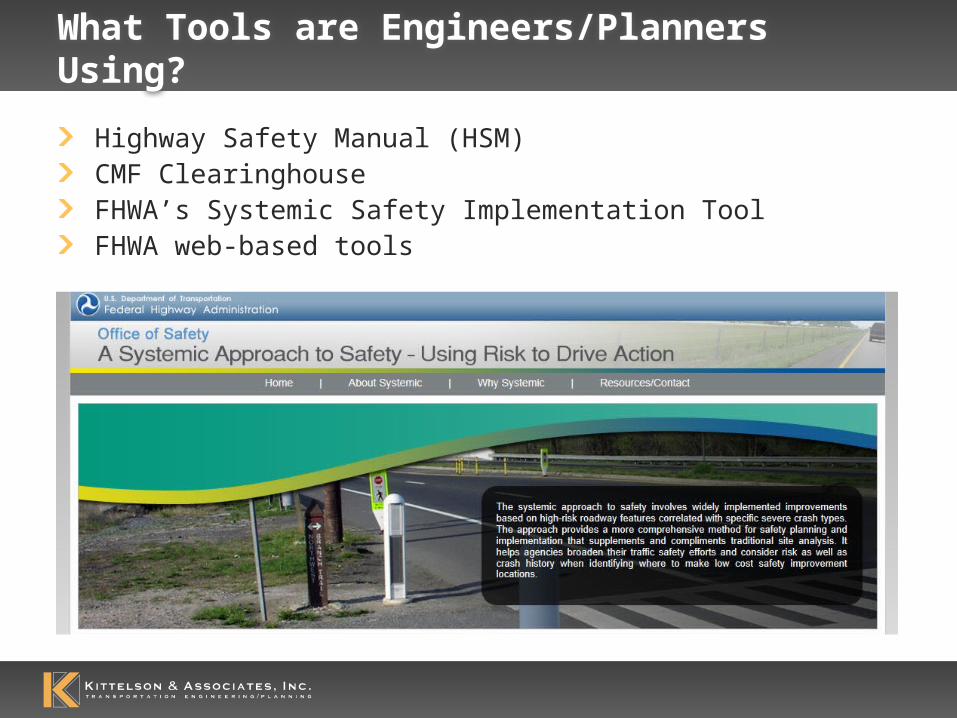
What Tools are Engineers/Planners Using?
Highway Safety Manual (HSM)CMF ClearinghouseFHWA’s Systemic Safety Implementation ToolFHWA web-based tools

Prioritizing Locations for Safety Improvements
Observed crashes used to prioritize locations by ODOT Region for 2017-2021 Statewide Transportation Improvement Program (STIP)Example from Region 1 All Roads Transportation Safety (ARTS) Program

Prioritizing Locations for Safety Improvements
How can we improve? Be more proactive and less
reactive Take into account roadway
context and characteristics that contribute to crashes
Prioritize improvements at locations where the next crash is most likely to occur
Photo source: ODOT

Pedestrian and Bicycle Safety Implementation Plan
Identifies priority corridors for pedestrian and bicycle safety improvements based on a Data-informed approach consistent with MAP 21“Highway safety improvement projects must be identified on the basis of crash experience, crash potential…or other data-supported means.” (23 USC 148(c)(2)(B))
Countermeasure Toolbox to assist in identifying safety improvements

Region 1 Reported Bicycle and Pedestrian Crashes(2009-2013, Fatal and Injury A)
Bicycle/Pedestrian Crashes: 562
Urban: 534(95%)
Pedestrian: 375 (66%)
Intersection: 193 (34%)
Segment: 182 (32%)
Bicycle: 159 (29%)
Intersection: 116 (21%)
Segment: 43 (8%)
Rural: 28(5%)
Pedestrian: 20 (3%)
Bicycle: 8 (2%)

1. Traditional Implement low-cost
countermeasures where frequent and severe crashes were reported
2. Risk-based Implement low-cost
countermeasures where the greatest risk of a crash exists
PBSIP Includes Complementary Systemic Methods
Traditional Systemic Projects
Risk-based Systemic Projects
Safety Implementation
Plan Projects

Identify Risk Factors
• Traffic and geometric characteristics present at fatal and severe-injury crash sites
Select and Prioritize Locations
• Segments exhibiting one or more risk factors
Develop Systemic
Safety Projects
• Apply counter-measures to address risk factors at specific locations
Overview of Risk-Based Systemic Method

Crash Analysis – Example Pedestrian Trend
Reported Crashes on State Highway Segments in Urban Areas (2007-2011)
Identify Risk Factors
Select and Prioritize Locations
Develop Systemic Safety Projects

Crash Analysis – Example Bicycle Trend
Reported Crashes on State Highway Segments in Urban Areas (2007-2011)
Identify Risk Factors
Select and Prioritize Locations
Develop Systemic Safety Projects

Risk Factors - Pedestrians
Pedestrian risk factors identified: Number of travel lanes along
segments Presence of median on 4-lane roads Posted speed along segments Distance between signals or
enhanced crossings Average Daily Traffic Presence of transit stop Number of fatalities or injuries
resulting from a pedestrian crash
Identify Risk Factors
Select and Prioritize Locations
Develop Systemic Safety Projects

Risk Factors - Bicycle
Bicycle risk factors identified: Number of driveways Number of lanes on major street
at intersection Lack of bicycle facility on at least
one approach at intersection Proximity to transit stop Average Daily Traffic Number of fatalities or injuries
resulting from a bicycle crash
Identify Risk Factors
Select and Prioritize Locations
Develop Systemic Safety Projects

Risk-Based Network Screening
Example of risk-based correlation between risk factor and crash frequencyDriveway locations in orange, crash locations in blue
Identify Risk Factors
Select and Prioritize Locations
Develop Systemic Safety Projects
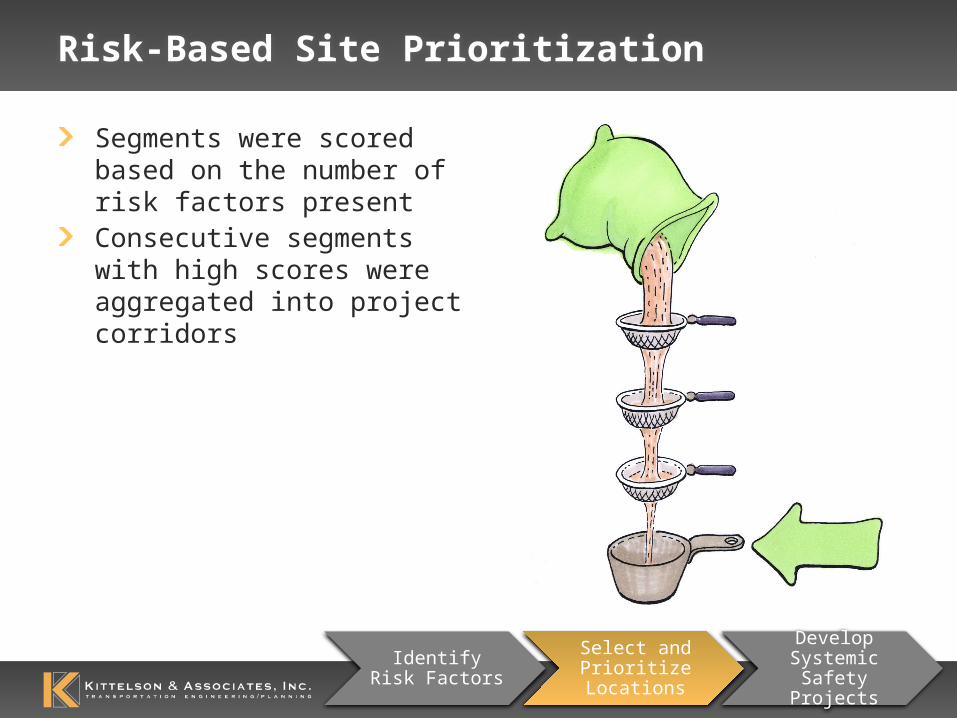
Risk-Based Site Prioritization
Segments were scored based on the number of risk factors presentConsecutive segments with high scores were aggregated into project corridors
Identify Risk Factors
Select and Prioritize Locations
Develop Systemic Safety Projects

Prioritized Corridor Maps – R1 Pedestrian Example
Identify Risk Factors
Select and Prioritize Locations
Develop Systemic Safety Projects

Systemic Countermeasures
Countermeasures evaluated based on Documented effectiveness Ease of implementation Relative cost
Countermeasure toolbox developed with input from stakeholders and project management teamIncludes several FHWA Proven Safety Countermeasures
Identify Risk Factors Select and Prioritize Locations
Develop Systemic Safety Projects
Graphic source: FHWA

Where to Go from Here?
Statewide Improve data:
Consistency across jurisdictional boundaries Broader spatial coverage Crash reporting details for pedestrian and bicycle crashes Obtain exposure data
Local Agencies Consider implementing a risk-based methodology
Additional Research In Oregon PSU and OSU will compile more data and refine risk
factors as part of ODOT-sponsored research Nationally NCHRP Project 17-73 will refine the process to
develop a risk-based method for pedestrian safety

Questions?
Contact Casey Bergh, Kittelson &
Associates, Inc. [email protected]
Plan available online at: http://www.oregon.gov/ODOT/HWY/TS/Pages/Bicycle_Pedestrian_Safety.aspx or search “Oregon bicycle pedestrian safety implementation”