Embed Size (px)
Citation preview

Canadian International Conference on Global Studies 2015 (CGS 2015)
CREATING AGRICULTURAL SUSTAINABILITY INDEX: THE CASE OF RICE FARMERS IN MADA, MALAYSIA
Presented By:
Ajidasile Oluwagbemisola Hannah

INTRODUCTION
The quest for awareness of sustainability has increased around the globe due to thegrowing concern about future food production and changing climatic condition
This fight for food security and environmental safety has pinpointed sustainabilityissues to be paramount (Siwar and Hossain,2001)
The concept of sustainability development is a well defined one but the exact meaningand definition has caused strong debate (Ciegis et al, 2009)
It is a broad multifaceted concept
It is a dynamic concept not a static one
It depends to a large extent upon the maintenance/ enhancement of soil health.

INTRODUCTION CONT’D
It is concerned with “meeting the needs of the current generation without compromisingthe ability of subsequent generations to meet their own needs” (BrundtlandCommission, 1987)
Brief background of the study area
In Malaysia, rice is a traditional staple food crops and the industry is the mainlivelihood to nearly 297, 600 farmers
Muda Agricultural Development Authority (MADA), is a specialized institutionof the Malaysian government to improve paddy production
It is the largest granary area and considered the “rice bowl” of Malaysia(MADA, 2010).

INTRODUCTION CONT’D
MADA rice production is dominated by conventional methods of production
Active use and over-dependence of herbicides
Burning of paddy stalk after harvesting to facilitate land preparation, control
pest and disease
Lack large, industrial-scale growers (average farm size of 2 hectares)
Less productive farmers due to (old) age factor working in the fields
There is widening disparity among farmer incomes

INTRODUCTION CONT’D
Figure 1. Map of Locality Areas of MADA, Malaysia
(Source: EPP10-Strengthening and enhancing rice crop
productivity Muda region
Figure 2: The Regions in MADA, Malaysia
(Source: EPP10-Strengthening and enhancing rice crop productivity
Muda region)

AIM AND OBJECTIVES
This work is therefore aimed at creating agricultural sustainability index with
reference to rice production in MADA, Malaysia.
Specific objective
to describe the underlying principles, the procedure and rationale for scoring
each sustainability items
Farmers practices to
soil health (soil fertility management),
plant protection (insect, disease and weed management) and
socio-economic of the farmers.
formed the basis for accessing the sustainability

MATERIALS AND METHODS
The study area is located on the coastal alluvial plain in the northwestregion of Peninsular Malaysia
Sources and Method of data collection
Primary and secondary data
Embraced the three aspects of sustainability
Focused on present agricultural practices
Sampling techniques
402 randomly selected farmers (selecting from the four regions)
MATERIALS AND METHODS CONT’D
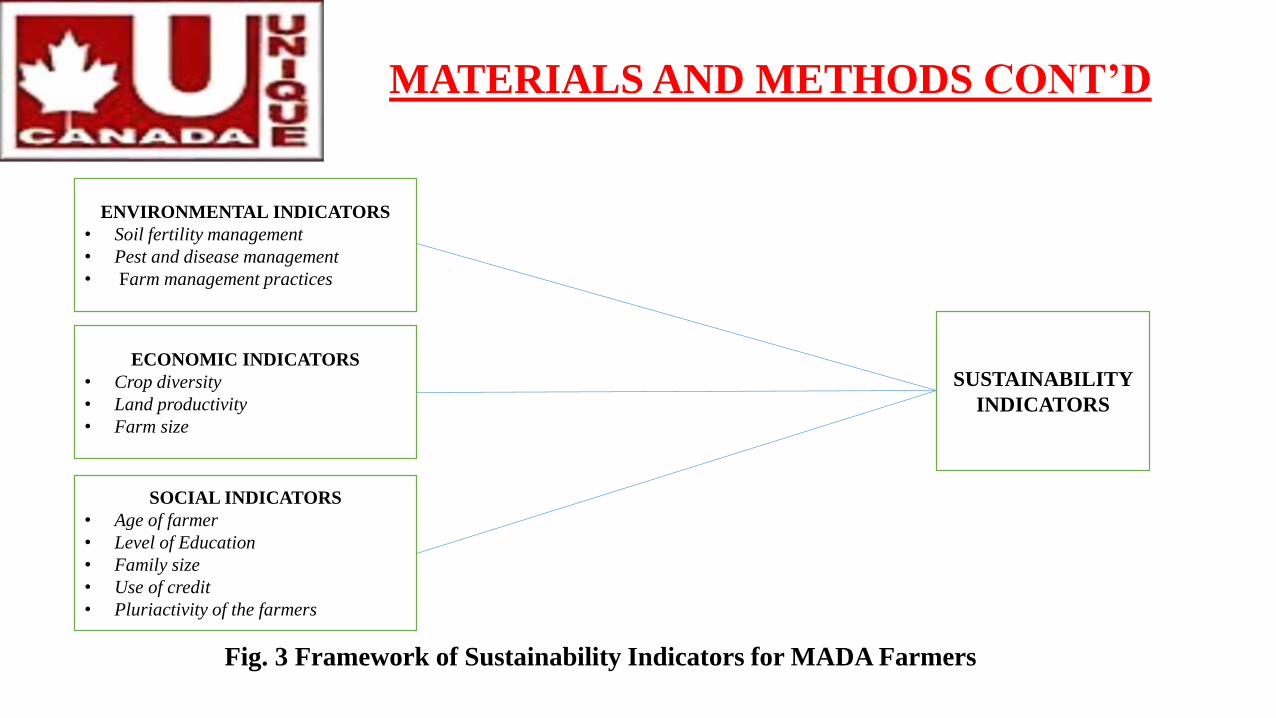
Fig. 3 Framework of Sustainability Indicators for MADA Farmers
ENVIRONMENTAL INDICATORS
• Soil fertility management
• Pest and disease management
• Farm management practices
ECONOMIC INDICATORS
• Crop diversity
• Land productivity
• Farm size
SOCIAL INDICATORS
• Age of farmer
• Level of Education
• Family size
• Use of credit
• Pluriactivity of the farmers
SUSTAINABILITY
INDICATORS

MATERIALS AND METHODS CONT’D
Action Plan
Actions Principles
Item
selection
The underlying principle is that farmers responses must show some minimum
degree of variation in order for the practice to included to the index
It enables differentiation among farmers in their overall degree of sustainability
Each of the 60 practices covered in the instrument were considered for inclusion
in the sustainability index

MATERIALS AND METHODS CONT’D
Bivariate
relationship
Determining whether possible variable for inclusion in the index shows show any probable
relationship with each other
For instance
Strong correlation between one or two (or more) variables, one of the two or more variables is
dropped on the assumption that one variable can adequately convey indications provided by
the other
Variables with little correlation is excluded from the index on the basis that such variable
would certainly not contribute much to determine the patterns intended to be indicated by the
scoring index.
Index
scoring
(4 steps)
Each practice scored individually according to its contribution to sustainability.
i.e. Positive signs (reduction in synthetic chemicals), negative value (increased usage of chemicals
over time) and zero signs (no changes over the usage of chemicals)
Assigning weight to practices in respect to the relative importance in the production of the
practices

MATERIALS AND METHODS CONT’D
Index
scoring
(4 steps)
Handling missing data situation
Adjusting the ASI computation scores for each farmer (in a range of 0 and
100)
Index
Validation
Involved two approaches
Internal validation (item analysis)
External validation
The scores of aggregate sustainability index were assigned to the three distinct
sustainability classes using the following range of index range:
Unsustainable production system : < 40%
Sustainable production system: 40% - 50%
Highly sustainable production system: > 50%

MATERIALS AND METHODS CONT’D
Type of production practice Index Score
Environmental Indicators
Insect pest control (maximum score =44)
Basic for deciding to spray BPH:
- Follow warming sign system Yes = 0; No = +1
- The presence of pest in paddy field Yes = +1; No = 0
- When there is damage to the field Yes = +1; No = 0
- Based on the economics threshold Yes = +2; No = 0
Use bacterial insecticides Yes = +3; No = 0
Pesticide cocktail No= 0; Sometimes= +1; Quite often= -2
Change over last 5 years in application of insecticides More often = -4; No change = -2; Less now = +2
Number of sprayings for the most important insects for both seasons
0 sprays =+2; 1-3 sprays= +4, 4-6 sprays= +2; 7-9
sprays= 0, 10-12 sprays= -2; 13-15 sprays= -4; 16-18
sprays= -6;
> 18 sprays= -8
Non- chemical means for insecticides control:
- Choose pest resistance varieties Yes = +0.5; No = 0
- Modify planting date Yes = +0.5; No = 0
- Burning paddy straw Yes = 0; No = +0.5
- Use biological control Yes = +0.5; No = 0
TABLE 1. Production practices included in the unadjusted Agricultural Sustainability index (ASI)

MATERIALS AND METHODS CONT’D
Disease control (maximum score = 8.0)
Number of sprays for most important disease for both seasons
0 sprays = +1; 1-3 sprays= +2;
4-6 sprays = +1; 7-9 sprays= 0; >
sprays = -1
Non-chemical means for disease control
- Choosing disease resistance varieties Yes = +0.5; No = 0
- Modify planting date Yes = +0.5; No = 0
- Ensure paddy not planted too close Yes = +0.5; No = 0
- Plow Yes = +0.5; No = 0
Weed control (maximum score = 8)
Number of sprays for the most important weed for both seasons0 sprays = +1; 2 sprays = 0; 3-6
sprays = -1
Non- chemical means for weed control
- Mechanical weed control Yes = +1; No = 0
- Use of hand tools Yes = +1; No = 0
- Using natural biological control Yes = +1; No = 0
- Accurate water management Yes = +1; No = 0
- Plowing Yes = +1; No = 0

MATERIALS AND METHODS CONT’D
Soil fertilizer maintenance and enhancement (maximum score =12)
Number of application in inorganic fertilizer
0 0r 1 application = 0;
2 applications = +1;
3 applications = +2
Percentage of total applied nitrogen (N) from organic source
0% = -1;
1-50% = 0;
> 50 = +1
Changes over last 5 years in application of inorganic fertilizer
More = -2;
No changes = 0;
Less now =+2
Other means to enhance soil fertility and health:
- Mix lime with water Yes = 1; No = 0
- Waste from paddy Yes = 1; No = 0
- Livestock manure Yes = 1; No = 0
Others (maximum score = 3)
Heard about IPM Yes = 1; No = 0
Taken IPM course Yes = 1; No = 0
Practice IPM strategies Yes = 1; No = 0

MATERIALS AND METHODS CONT’D
Social indicators
Age
< 30years = + 5; 31 – 40years = +4;
41 – 50years = +3; 60 –70years = +2;
> 70years = +1
Education
Never attend school = 0; Primary = +6;
Lower secondary = 9; Higher secondary =
11; Universities = +13
Family size < 5 = +1; 5 – 9 = +2; >10 = +3
Use of credit Yes = + 1; No = 0
Non-agricultural activities Yes = + 1; No = 0
Economic indicators
Crop diversities Yes = 1; No = 0
Farm size< 3 Ha = 1; 3 – 4 Ha = 2; 5 – 6 Ha = 3;
> 7Ha = 4
Land productivity< 5mt = 1; 5 – 10mt =2;10 – 15mt = 3;
> 15mt = 4
Note: the maximum range of score in unadjusted ASI = 107

RESULTS
TABLE 2: Summary of statistics for
farmer’s socio-demographic
characteristics
Variables
Avera
ge
Minim
um
Maxim
um
Standard
deviation
Age (years) 55.82 25 80 11.333
Land (Ha) 3 0.29 9.21 1.928
Education
(years) 8.02 0 13 2.91
Household
size (person) 6 1 13 2.042
TABLE 3. Final adjusted overall ASI for rice
farmers in MADA, Malaysia
Index value
Sustainability index
criteria Frequency
Mean _ 49.14
Median _ 48.84
Mode _ 41.41
Range _ 30.38 - 76.04
0.00 – 40.0 %
Unsustainable
production 30 (7.46)*
40.1 - 50.0 %
Sustainable
production 195 (48.51)*
> 50%
Highly sustainable
production 177 (44.03)*
*Figures in parenthesis are percentages

DISCUSSIONS
From table 2, Most of the farmers are small holder farmers (those who cultivated farm size between 0.29ha to 6.0ha )
Most of the farmers are old (seen from the average age of 56years)
The level of education was 8years on the average (this shows highest percentage of educated farmers)
From Table 3, the ASI valves for the 402 farmers range from 30.38 to 76.04 (scale: 0 to 100) with mean value of 49.14
The overall analysis shows that 92.5% of the farmers to be sustainable while 7.46% were unsustainable in their production system.
The analysis shows that farmers who practice sustainable production are those with smaller farm size as supported by Nwaiwu et al. (2013) and Kadiri et al. (2014)

CONCLUSIONS
Sustainability is more than whether farmers does use or doesn’t use any synthetic fertilizerand agricultural chemicals
From the result, the high scores in the overall ASI was attributed to the high score in thefarmers’ environmental sustainability index
The farmers shows great inclination to follow integrated pest management (IPM) practices
High percentage of farmers follows IPM rules in spraying brown plant hopper(BPH) whichrequired highest effort in both wet and dry season
Low score in the economic sustainability index was due to small holding, less crop diversity,land productivity (yields)
The high agricultural chemical inputs shows increasing trends compared to the past 10 years

THANK YOU FOR
LISTENING

Canadian International Conference on Global Studies 2015 (CGS 2015)
CREATING AGRICULTURAL SUSTAINABILITY INDEX: THE CASE OF RICE FARMERS’ IN MADA, MALAYSIA
Presented By:
Ajidasile Oluwagbemisola Hannah


![[PVG] Hannah Montana - Hannah Montana 3](https://img.dokumen.tips/doc/110x75/56d6bf381a28ab30169562c0/pvg-hannah-montana-hannah-montana-3.jpg)