arX
iv:0
704.
2971
v1 [
astr
o-ph
] 2
3 A
pr 2
007
Mon. Not. R. Astron. Soc. 000, 000–000 (0000) Printed 1 February 2008 (MN LATEX style file v2.2)
The XMM-SSC survey of hard-spectrum XMM-Newton
sources 1: optically bright sources
M.J. Page1, I. Lehmann2, Th. Boller2, M.G. Watson3, T. Dwelly1,4, S. Hess2,
I. Matute2, N.S. Loaring1,5, S. Rosen1, H. Ziaeepour1, A. Schwope6,
G. Lamer6, F.J. Carrera7, J. Tedds3, R. Della Ceca8, P. Severgnini8,
R.G. McMahon9, and W. Yuan9,10
1Mullard Space Science Laboratory, University College London, Holmbury St Mary, Dorking, Surrey RH5 6NT, UK.2Max-Planck-Institut fur extraterrestrische Physik, Giessenbachstrasse, Postfach 1312, 85741 Garching, Germany.3Department of Physics and Astronomy, University of Leicester, LE1 7RH, UK.4School of Physics and Astronomy, University of Southampton, Southampton, SO17 1BJ, UK5South African Astronomical Observatory, Observatory, 7935 Cape Town, South Africa6Astrophysikalisches Institut Potsdam (AIP), An der Sternwarte 16, 14482 Potsdam, Germany.7Instituto de Fısica de Cantabria (CSIC–Universidad de Cantabria), 39005 Santander, Spain.8INAF-Osservatorio Astronomico di Brera, via Brera 28, I-20121 Milano, Italy.9University of Cambridge, Institute of Astronomy, Madingley Road, Cambridge CB3 0HA, UK10National Astronomical Observatory of China/Yunnan Observatory, Kunming, 650011, PO Box 110 Yunnan, China
ABSTRACT
We present optical and X-ray data for a sample of serendipitous XMM-Newton
sources that are selected to have 0.5-2 keV vs 2-4.5 keV X-ray hardness ratioswhich are harder than the X-ray background. The sources have 2-4.5 keV X-ray flux≥ 10−14 erg cm−2 s−1, and in this paper we examine a subsample of 42 opticallybright (r < 21) sources; this subsample is 100 per cent spectroscopically identified.All but one of the optical counterparts are extragalactic, and we argue that thesingle exception, a Galactic M star, is probably a coincidental association ratherthan the correct identification of the X-ray source. The X-ray spectra of all thesources are consistent with heavily absorbed power laws (21.8 < log NH < 23.4),and all of them, including the 2 sources with 2-10 keV intrinsic luminosities of< 1042 erg s−1, appear to be absorbed AGN. The majority of the sources showonly narrow emission lines in their optical spectra, implying that they are type-2 AGN. Three sources have 2-10 keV luminosities of > 1044 erg s−1, and twoof these sources have optical spectra which are dominated by narrow emissionlines, i.e. are type-2 QSOs. Only a small fraction of the sources (7/42) show broadoptical emission lines, and all of these have NH < 1023 cm−2. This implies thatratios of X-ray absorption to optical/UV extinction equivalent to > 100× theGalactic gas-to-dust ratio are rare in AGN absorbers (at most a few percent of thepopulation), and may be restricted to broad absorption-line QSOs. Seven objectsappear to have an additional soft X-ray component in addition to the heavilyabsorbed power law; all seven are narrow emission line objects with z < 0.3 and2-10 keV intrinsic luminosities < 1043 erg s−1. We consider the implications of ourresults in the light of the AGN unified scheme. We find that the soft componentsin narrow-line objects are consistent with the unified scheme provided that > 4per cent of broad-line AGN have ionised absorbers that attenuate their soft X-rayflux by > 50 per cent. In at least one of the X-ray absorbed, broad-line AGN inour sample the X-ray spectrum requires an ionised absorber, consistent with thispicture.
Key words: X-rays: galaxies – galaxies: active
c© 0000 RAS
2 Page, et al.
1 INTRODUCTION
Deep surveys with Chandra and XMM-Newton havenow resolved the majority of the extragalactic X-ray background (XRB) at < 5 keV into pointsources (Alexander et al., 2003; Rosati et al., 2002;Worsley et al., 2004; Bauer et al., 2004). At the brightflux limits that were probed with Einstein and ROSAT
surveys, the soft X-ray sky is dominated by broad-lineAGN with soft X-ray spectra (Maccacaro et al., 1988;Mittaz et al., 1999). At faint fluxes, the bulk of thesources have hard X-ray spectra (Giacconi et al., 2001;Brandt et al., 2001), as required to produce the overallXRB spectral shape. XRB synthesis models predictthat these faint, hard sources are intrinsically absorbedAGN (e.g. Setti & Woltjer, 1989; Comastri et al., 1995;Gilli, Salvati & Hasinger, 2001). These absorbed sourcesare likely to be the dominant AGN population: they areresponsible for the majority of the XRB energy densityand probably outnumber unabsorbed AGN by a factor of4 or more (Fabian & Iwasawa, 1999), as is found in opticaland X-ray studies of local AGN (Maiolino & Rieke, 1995;Risaliti, Maiolino & Salvati, 1999). Optical/infraredimaging and spectroscopy of the faint, hard-spectrumsources, while consistent with the absorbed AGN hy-pothesis, reveals a heterogeneous population. Manyof these sources are narrow-line AGN (Seyfert 2sand QSO 2s), others show no emission lines whatso-ever, while some are optically unobscured, broad lineAGN (e.g. Mainieri et al., 2002; Barger et al., 2003;Szokoly et al., 2004; Page et al., 2006b). This varietysuggests that there is a large range of gas-to-dust ratioswithin the absorbed population.
There are a variety of important issues regard-ing the absorbed population which remain to beaddressed. First, the relationship between the op-tical spectroscopic characteristics and the levelof X-ray absorption is not fully understood (e.g.Maiolino et al., 2001; Page, Mittaz & Carrera, 2001;Boller et al. , 2003; Barcons, Carrera & Ceballos, 2003;Caccianiga et al., 2004; Carrera, Page & Mittaz, 2004).Nor is it established whether the fraction of ab-sorbed AGN depends on redshift and/or on lu-minosity: several recent studies suggest that thefraction of absorbed AGN decreases with lumi-nosity and/or redshift (e.g. Cowie et al., 2003;Barger et al., 2003; Steffen et al., 2003; Ueda et al., 2003;La Franca et al., 2005), while other studies suggestthat the absorbed fraction is independent of lumi-nosity (e.g. Treister et al., 2004; Dwelly et al., 2005;Dwelly & Page, 2006; Tozzi et al., 2006). Indeed,this issue has been debated since at least the early1980s (e.g. Lawrence & Elvis, 1982; Mushotzky, 1982;Maccacaro, Gioia & Stocke, 1984). Another partic-ularly important question is whether the absorbedAGN population is wholly related to the unabsorbedpopulation by AGN geometric unification schemes(Antonucci, 1993). Broad line AGN with significant X-rayabsorption but little or no optical/UV obscuration (e.g.Barr et al., 1977; Elvis et al., 1994; Akiyama et al., 2000;Page, Mittaz & Carrera, 2001) have proven particularlychallenging to fit within such schemes. Alternatively,parts of the absorbed population may be physically
distinct from the unabsorbed population, as predictedby some evolutionary models (Sanders et al., 1988;Fabian, 1999; Franceschini, Braito & Fadda, 2002;Elvis, Marengo & Karovska, 2002; Page et al., 2004).
In this paper we present a sample of serendipitousXMM-Newton sources selected to have hard X-ray spectrain the 0.5-4.5 keV energy range. This sample is well suitedfor the study of the X-ray and optical characteristics of theX-ray/optically bright part of the X-ray absorbed AGNpopulation. We describe the X-ray and optical selection ofthe sample in detail in Section 2, and in Sections 3 and4 we describe the optical spectroscopic observations andthe construction of the X-ray spectra. Our results are pre-sented in Section 5 and their implications for the absorbedAGN population are discussed in Section 6. Throughoutthis paper we assume H0 = 70 km s−1 Mpc−1, Ωm = 0.3,and ΩΛ = 0.7. We define a power law spectrum such thatdN/dE = AE−Γ where N is the number of photons, E isphoton energy, Γ is the photon index and A is the normal-isation.
2 SAMPLE SELECTION
Thanks to XMM-Newton’s exceptional throughput andlarge field of view (30′ diameter), a serendipitous XMM-
Newton catalogue is the obvious resource with which tofind bright examples of the absorbed AGN population.Our serendipitous catalogue was constructed by concate-nating the source lists from 100 pipeline processed XMM-
Newton fields. This catalogue preceded the public re-lease of the 1XMM catalogue, which is about 6 timeslarger, (Watson et al., 2003) but contains similar informa-tion about each source. The targets of the XMM-Newton
observations were excluded from the catalogue. Hard-spectrum sources are heavily outnumbered at bright fluxesby soft-spectrum, unabsorbed AGN, even in the 2-10 keVband. Therefore we have selected our sample from the cat-alogue using the 2-4.5 keV vs 0.5-2 keV hardness ratio. Werefer to this ratio as “HR2” to follow the convention usedin the 1XMM catalogue. HR2 is defined as
HR2 =CR2−4.5 − CR0.5−2
CR2−4.5 + CR0.5−2
(1)
where CR2−4.5 is the vignetting-corrected countrate in the2-4.5 keV range and CR0.5−2 is the vignetting-correctedcountrate in the 0.5-2 keV range. HR2 is calculated in-dependently for each of the 3 EPIC cameras. The specificcriterion used to select the sample is:
HR2− σHR2 > −0.3 (2)
where σHR2 is the 68% uncertainty on HR2. The HR2threshold of −0.3 corresponds approximately to the slopeof the XRB in the same energy range, so that only ob-jects with spectra harder than the XRB will be pickedup with this criterion. This range of HR2 also cor-responds to the most heavily absorbed AGN typicallyfound in XMM-Newton surveys (Caccianiga et al., 2004;Della Ceca et al., 2004), the numbers and redshifts ofwhich place significant constraints on XRB synthesis mod-els (Dwelly et al., 2005). For inclusion in the sample, werequire a source to have a detection likelihood (DET ML
c© 0000 RAS, MNRAS 000

The XMM-SSC survey of hard-spectrum XMM-Newton sources 1: optically bright sources 3
Figure 1. HR2 and HR3 hardness ratio distribution of theoptically bright sources (large dots) and optically-faint / blank-field sources (small dots) from the hard spectrum sample.The underlying greyscale and contours show the pn-camerahardness ratio distribution of the entire high galactic latitude(| b |> 20) 1XMM catalogue, and have a logarithmic scaling(Watson et al., 2003).
in 1XMM) > 7.51 in the 2-4.5 keV band, 2-4.5 keV flux> 10−14 erg cm−2 s−1 Galactic NH < 5 × 1020cm−2,|b| > 30 degrees, and satisfy equation 2 in at least oneof the three EPIC cameras. The DET ML threshold of7.5 corresponds to a probability of being a backgroundfluctuation of 5 × 10⁻⁴, and a spurious source fraction of< 1% (Watson et al., 2003). From a total of 9340 sourceswith DET ML > 7.5 found in the 100 XMM-Newton fieldsused here, we obtained a sample of 136 sources which meetthe selection criteria for our hard spectrum sample.
The sources were categorised according to opticalmagnitude to facilitate our optical identification pro-gramme. Those sources with counterparts on SuperCOS-MOS digitisations of the Palomar or UK Schmidt Tele-scope sky survey plates within 6′′ of the X-ray positionwill be referred to as the optically bright sample; thisamounts to 73 sources, and provides the target list for ourspectroscopic identification programme on 4m telescopes.Those sources without sky survey counterparts2 but whichhave counterparts in deeper imaging form the target listfor our spectroscopic identification programme on 8-10mtelescopes and are considered the optically-faint sample.Our identification programme for the optically faint sam-ple is ongoing. The final category of sources (“blank-field
1 A coding error in the task emldetect led to overestimatedvalues for DET ML prior to SAS version 6.0. The values ofDET ML given in this paper have been corrected for this prob-lem.2 We take the the sky survey plate limit to be r ∼ 21, and con-sider sources with r > 21 as part of the optically-faint sampleeven if they are detected on the sky survey plates.
Figure 2. 2-4.5 keV X-ray flux vs optical r-band magnitudefor the hard-spectrum sources. The solid line corresponds tothe ratio fX/fR = 1 and the dashed lines indicate the ±1 dexinterval, where fX/fR is the ratio of X-ray to optical flux as de-fined in McHardy et al. (2003). The 2 - 4.5 keV fluxes (f2−4.5)were determined from the 2-4.5 keV count rates, assuming aphoton index Γ = 1.7.
sources”) are those for which no optical counterpart isfound to r ∼ 23. Discussion of the optically faint andblank-field samples is deferred to a future paper pendingthe results of the 8-10m spectroscopic campaign.
The hardness ratios, HR2 and HR3, for the full sam-ple of hard spectrum sources are shown in Fig. 1, whereHR3 is the 4.5-7.5 keV vs 2-4.5 keV hardness ratio, de-fined as
HR3 =CR4.5−7.5 − CR2−4.5
CR4.5−7.5 + CR2−4.5
(3)
The optically bright sources are shown as large dots,while the optically faint and blank-field sources are shownas small dots. The optically faint and optically brightparts of the sample have similar hardness ratio distribu-tions: the two distributions are indistinguishable at the 90per cent confidence level according to the 2-dimensionalKolmogorov-Smirnov test (Fasano & Franceschini, 1987).The underlying greyscale and contours show the hard-ness ratio distribution for the | b |> 20 1XMM catalogue(Watson et al., 2003). The peak in the underlying distri-bution at (−0.6,−0.5) corresponds to the typical spectraof unabsorbed, broad-line AGN. While such sources dom-inate the 1XMM catalogue, (and all medium-depth, flux-limited samples of serendipitous XMM-Newton sources)the distribution shows a significant tail stretching to largervalues of HR2. The hard spectrum sample described inthis paper follows the underlying distribution of 1XMMsources well for HR2 >−0.2, and so is ideal for the studyof this hard-spectrum tail of the population.
The optical magnitudes and X-ray fluxes of the hardspectrum sources are shown in Fig. 2, and in this fig-ure we also show the interval | log10(fX/fR) |< 1,where fX and fR are X-ray flux and optical flux respec-tively, as defined by McHardy et al. (2003)3. The major-
3 The relationship fX = fR as defined by(McHardy et al., 2003) translates to r = 20.175 − log f2−4.5
where f2−4.5 is the 2 - 4.5 keV flux in units of
c© 0000 RAS, MNRAS 000, 000–000
4 Page, et al.
ity of hard-spectrum sources lie within this interval, as domost of the X-ray selected population at this flux level(Stocke et al., 1991).
3 OPTICAL SPECTROSCOPIC
OBSERVATIONS
Optical spectra were obtained in two observing runs. Thefirst run took place on the nights of 27th and 28th Jan-uary 2003 at the William Herschel Telescope on La Palma.Observing conditions were variable, but most of the datawere taken in conditions of good seeing (∼ 1′′) and skytransparency. Observations were made with the ISIS dualarm spectrograph using a 1.5′′ slit oriented at the paral-lactic angle, and employing the 5400 A dichroic. On theblue arm we used the R300B grating, covering the wave-length range from 3000 – 5700 A at 4.9 A resolution (mea-sured from arc lines taken through the slit) and on thered arm we used the R158R grating, covering the wave-length range 5000 – 10000 A at 10.1 A resolution. Spectraof CuNe and CuAr arclamps were used to calibrate thewavelength scale. Flux calibration, and approximate cor-rection for the telluric absorption bands at ∼ 6900 and∼ 7600 A were achieved through observations of G191-B2B and BD+33 2642. Data were reduced using standardIRAF routines. The reduced, flux calibrated spectra fromthe red and blue arms were then merged to form a singlespectrum for each target.
The second observing run took place at the New Tech-nology Telescope (NTT) at La Silla on the nights of the2nd and 3rd May 2003 in conditions of variable seeingand sky transparency. Observations were made using theEMMI spectrograph using a 1′′ slit at the parallactic angleand grism #3, providing 8 A resolution and a wavelengthrange of 3800–9000 A. Spectra of He and Ar arclamps wereused to calibrate the wavelength scale. Observations ofthe spectrophotometric standards LTT4364 and LTT2415were used for relative flux calibration.
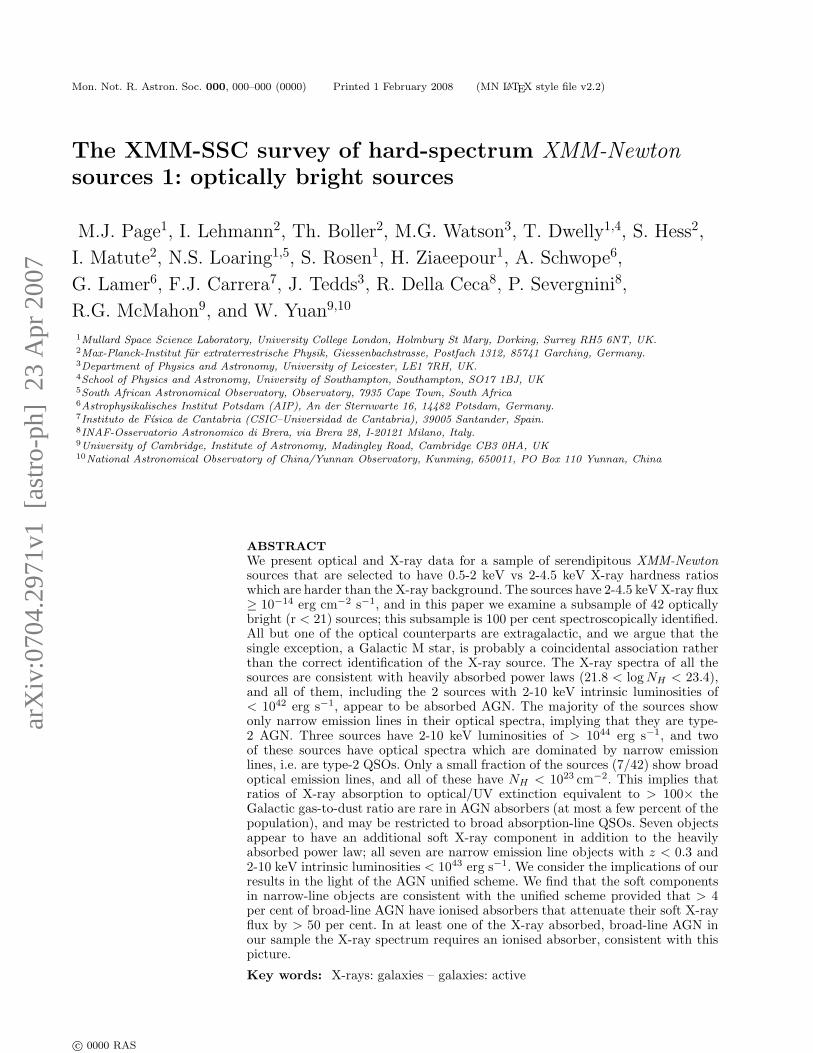
In total, spectra of the optical counterparts to 42hard-spectrum sources were observed. The spectroscopiccompleteness is 100% for the observed sample, i.e. anadequate spectrum yielding a reliable redshift was ob-tained for every optical counterpart that was observed.Apart from the selection of counterparts from sky surveyplates, we did not bias the spectroscopic observations tobright sources. To demonstrate this, Fig. 4 compares theoptical magnitude distributions for the optically brightsources which were and were not observed spectroscopi-cally; the two distributions are indistinguishable accordingto the Kolmogorov-Smirnov test, which gives the proba-bility that they were both drawn from the same distri-bution as 46 per cent. Hence our spectroscopically identi-fied sources are a representative and statistically-completesample of the optically bright (r< 21), hard spectrum pop-ulation.
10−14 ergs cm−2 s−1, assuming an X-ray photon indexΓ = 1.7.
Figure 4. Magnitude distributions for sources with r<21 whichwere (upper panel) and were not (lower panel) observed duringour optical spectroscopic observations.
4 CONSTRUCTION OF X-RAY SPECTRA
We extracted X-ray spectra for every source using theavailable XMM-Newton EPIC data. For sources which arepresent in more than one XMM-Newton observation in thepublic archive, we have used all the available data to ob-tain the highest possible signal to noise ratio. Table 1 givesthe XMM-Newton observations used to construct the X-ray spectrum of each source. The EPIC data were reducedusing the Science Analysis System (SAS) verson 5.4. TheXMM-Newton point spread function changes with off-axisangle. Therefore source spectra were extracted from ellip-tical source regions with sizes and orientations depend-ing on the fluxes and off-axis angles of the sources. Typ-ically, these regions have major axes of ∼ 18′′ and mi-nor axes of ∼ 10′′. Background spectra were extractedfrom annular regions, of 2.5′ outer radius, centred on thesource, and with all significant X-ray sources excised. Re-sponse matrices and the appropriate effective area fileswere computed using the SAS tasks RMFGEN and ARF-
GEN respectively. For each source the EPIC spectra werecombined to form a single spectrum using the method ofPage, Davis & Salvi (2003). Source spectra were groupedusing the HEASOFT tool GRPPHA to ensure the mini-mum number of counts per bin given in Table 3 (usually20) before fitting.
5 RESULTS
5.1 Optical spectra
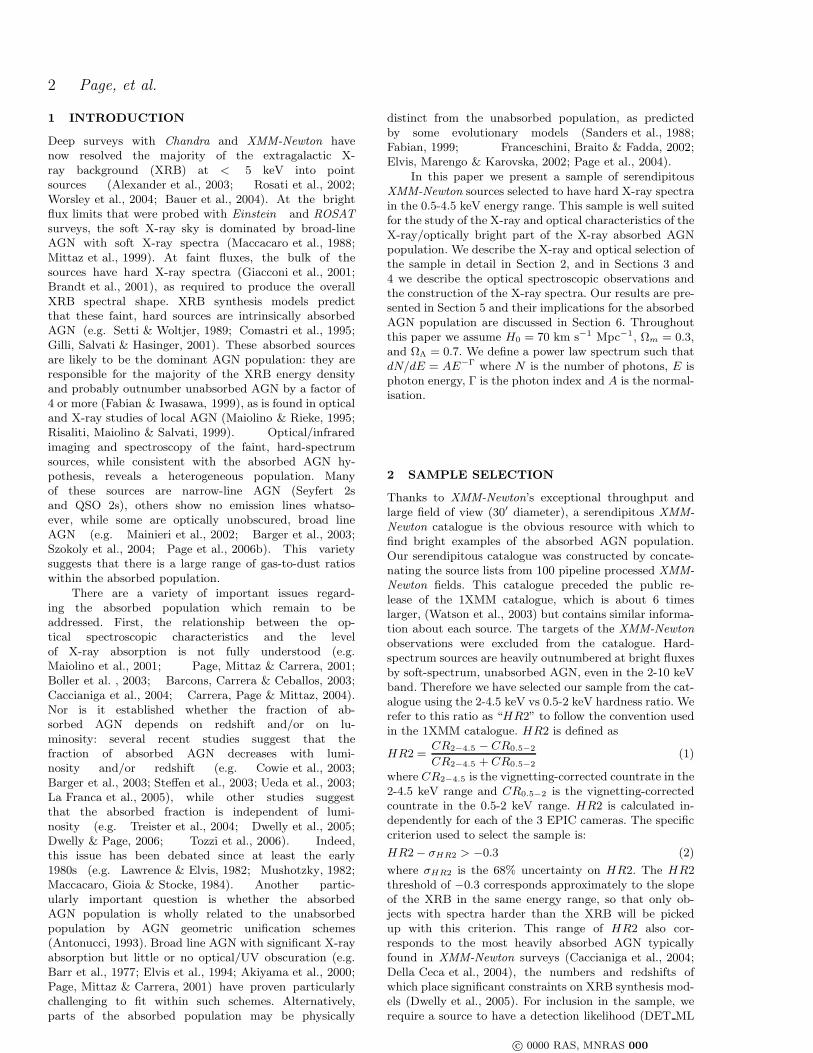
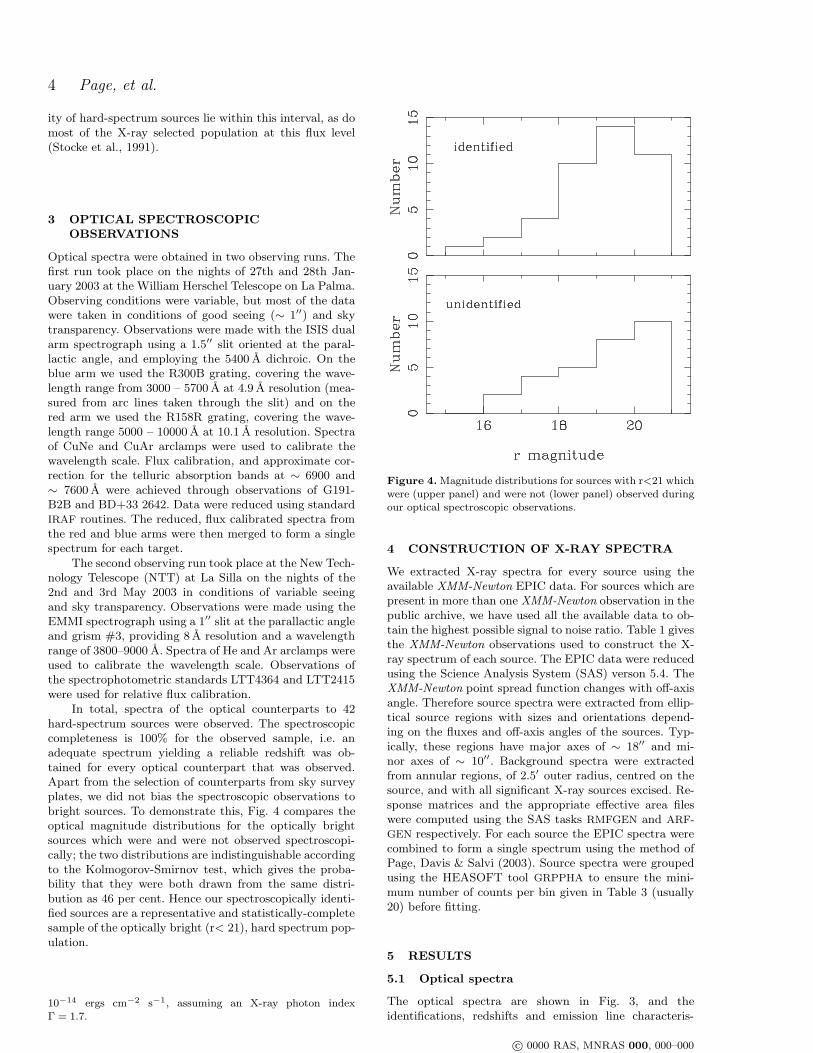
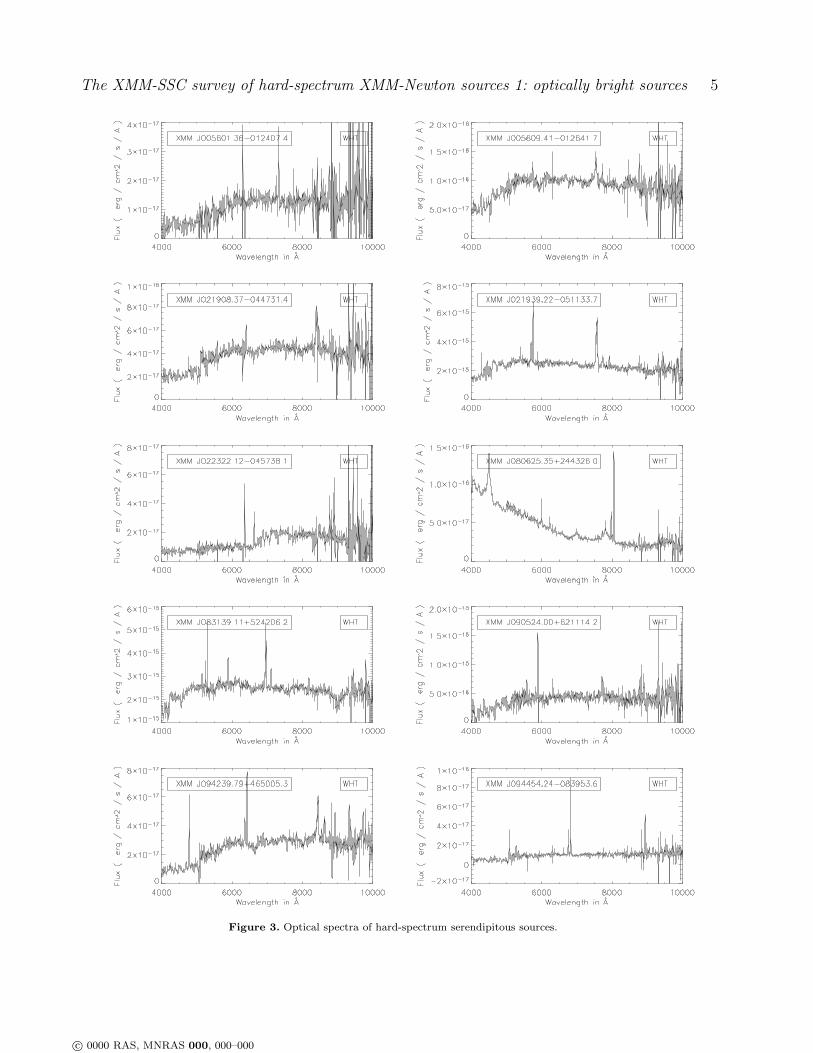
The optical spectra are shown in Fig. 3, and theidentifications, redshifts and emission line characteris-
c© 0000 RAS, MNRAS 000, 000–000
The XMM-SSC survey of hard-spectrum XMM-Newton sources 1: optically bright sources 5
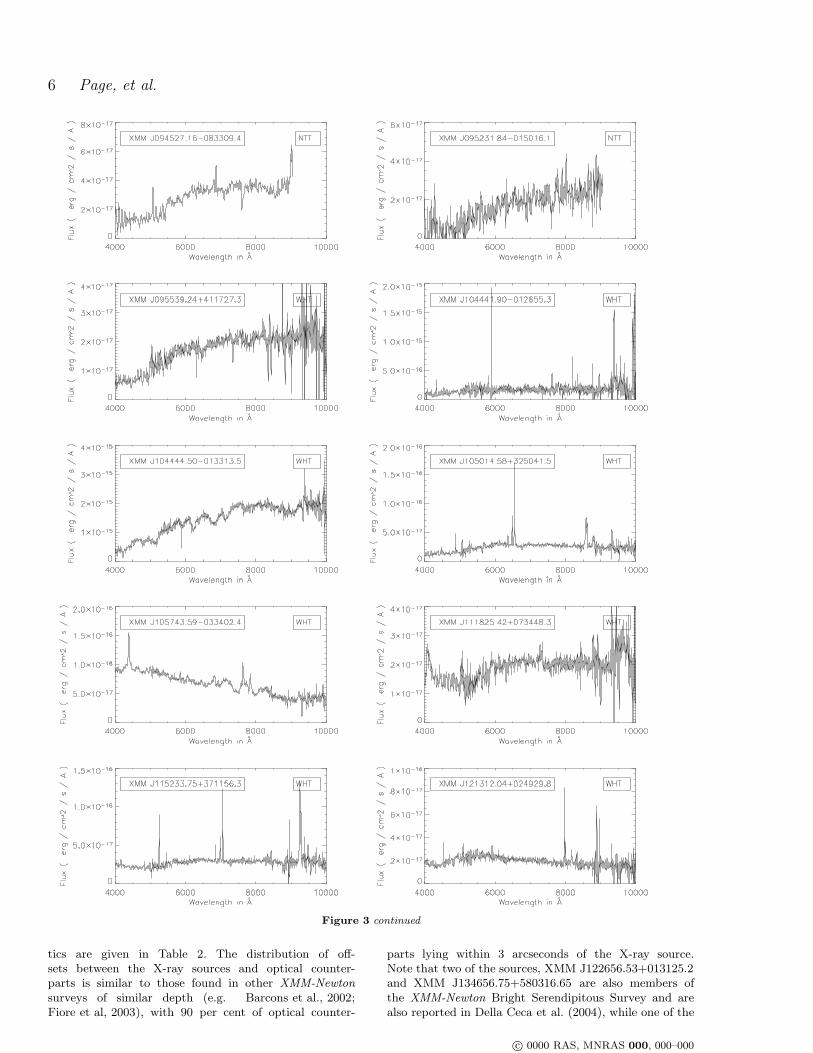
Figure 3. Optical spectra of hard-spectrum serendipitous sources.
c© 0000 RAS, MNRAS 000, 000–000
6 Page, et al.
Figure 3 continued
tics are given in Table 2. The distribution of off-sets between the X-ray sources and optical counter-parts is similar to those found in other XMM-Newton
surveys of similar depth (e.g. Barcons et al., 2002;Fiore et al, 2003), with 90 per cent of optical counter-
parts lying within 3 arcseconds of the X-ray source.Note that two of the sources, XMM J122656.53+013125.2and XMM J134656.75+580316.65 are also members ofthe XMM-Newton Bright Serendipitous Survey and arealso reported in Della Ceca et al. (2004), while one of the
c© 0000 RAS, MNRAS 000, 000–000
The XMM-SSC survey of hard-spectrum XMM-Newton sources 1: optically bright sources 7
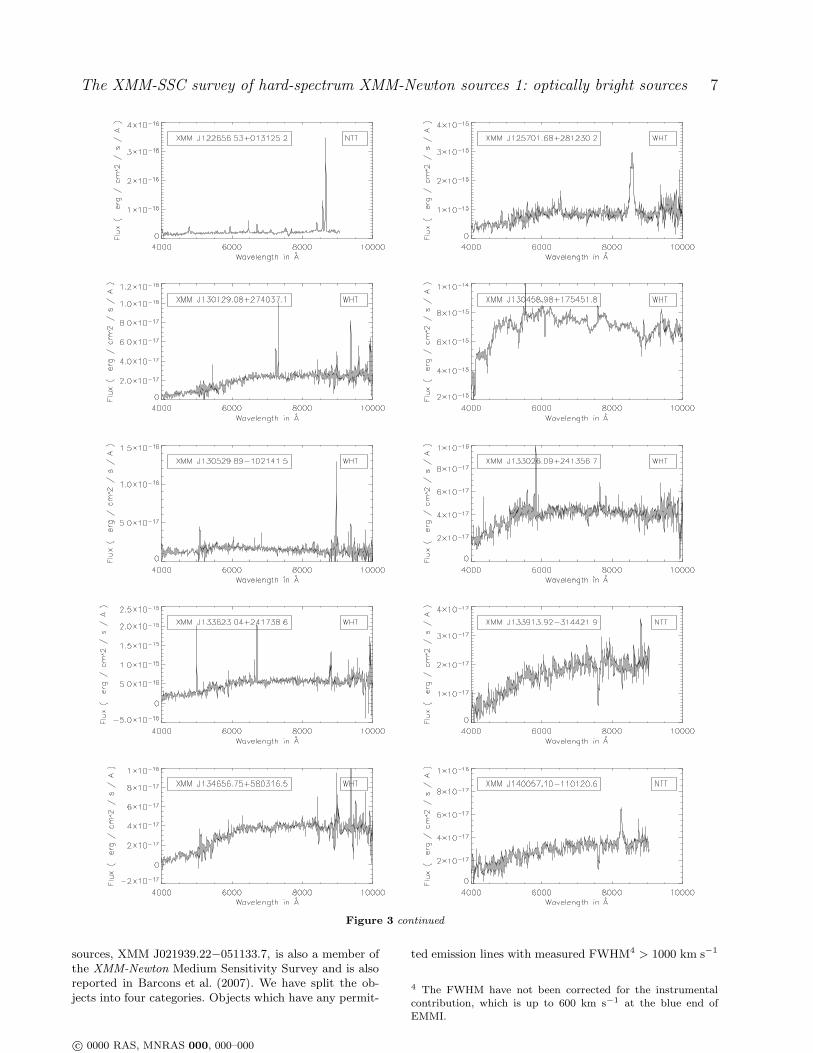
Figure 3 continued
sources, XMM J021939.22−051133.7, is also a member ofthe XMM-Newton Medium Sensitivity Survey and is alsoreported in Barcons et al. (2007). We have split the ob-jects into four categories. Objects which have any permit-
ted emission lines with measured FWHM4 > 1000 km s−1
4 The FWHM have not been corrected for the instrumentalcontribution, which is up to 600 km s−1 at the blue end ofEMMI.
c© 0000 RAS, MNRAS 000, 000–000

8 Page, et al.
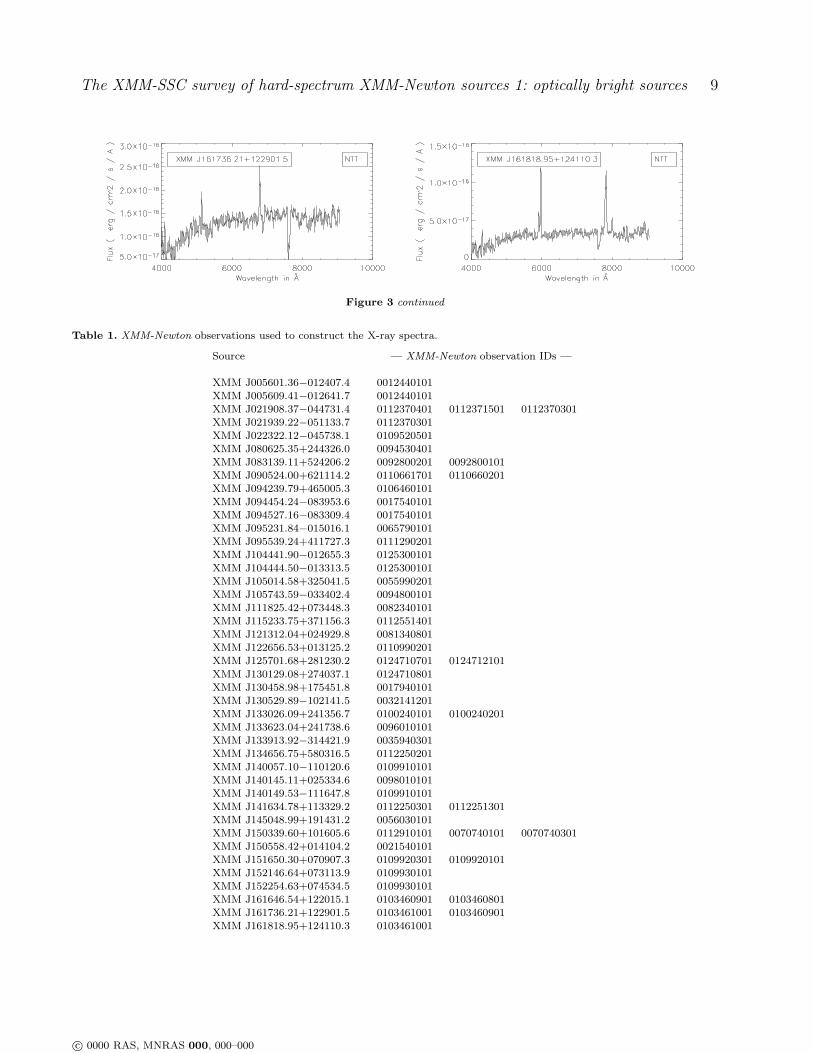
Figure 3 continued
have been classified as broad-line active galactic nuclei(BLAGN); this class includes QSOs and type 1 Seyferts.Galaxies which only show emission lines with FWHM< 1000 km s−1 have been classified as narrow emissionline galaxies (NELGs). Galaxies in which we do not detect
any emission lines have been classified simply as ‘galaxies’.Finally, one object has the spectrum of a Galactic star.
As can be seen in Fig. 3 and Table 2, the sources allhave z < 0.8, and majority (31/42) of the sources are clas-sified as NELGs. In all the NELGs we observe at least one
c© 0000 RAS, MNRAS 000, 000–000
The XMM-SSC survey of hard-spectrum XMM-Newton sources 1: optically bright sources 9
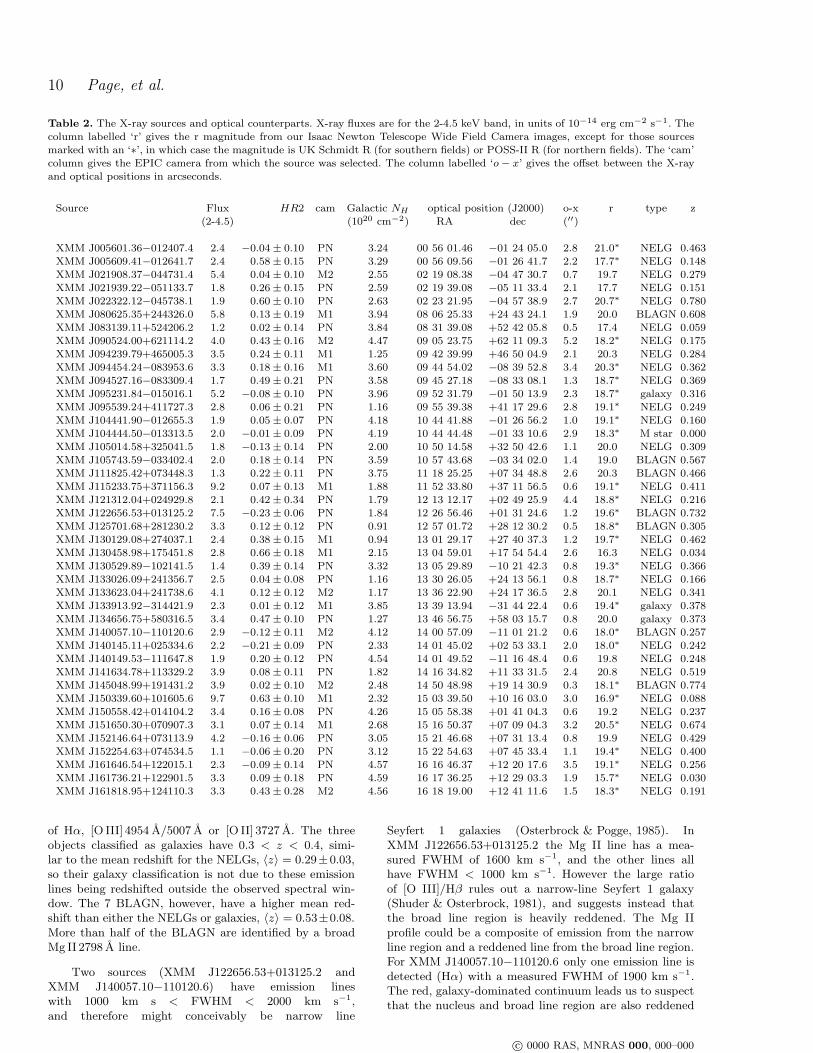
Figure 3 continued
Table 1. XMM-Newton observations used to construct the X-ray spectra.
Source — XMM-Newton observation IDs —
XMM J005601.36−012407.4 0012440101XMM J005609.41−012641.7 0012440101XMM J021908.37−044731.4 0112370401 0112371501 0112370301XMM J021939.22−051133.7 0112370301XMM J022322.12−045738.1 0109520501XMM J080625.35+244326.0 0094530401XMM J083139.11+524206.2 0092800201 0092800101XMM J090524.00+621114.2 0110661701 0110660201XMM J094239.79+465005.3 0106460101XMM J094454.24−083953.6 0017540101XMM J094527.16−083309.4 0017540101XMM J095231.84−015016.1 0065790101XMM J095539.24+411727.3 0111290201XMM J104441.90−012655.3 0125300101XMM J104444.50−013313.5 0125300101XMM J105014.58+325041.5 0055990201XMM J105743.59−033402.4 0094800101XMM J111825.42+073448.3 0082340101XMM J115233.75+371156.3 0112551401XMM J121312.04+024929.8 0081340801XMM J122656.53+013125.2 0110990201XMM J125701.68+281230.2 0124710701 0124712101
XMM J130129.08+274037.1 0124710801XMM J130458.98+175451.8 0017940101XMM J130529.89−102141.5 0032141201XMM J133026.09+241356.7 0100240101 0100240201XMM J133623.04+241738.6 0096010101XMM J133913.92−314421.9 0035940301XMM J134656.75+580316.5 0112250201XMM J140057.10−110120.6 0109910101XMM J140145.11+025334.6 0098010101XMM J140149.53−111647.8 0109910101XMM J141634.78+113329.2 0112250301 0112251301XMM J145048.99+191431.2 0056030101XMM J150339.60+101605.6 0112910101 0070740101 0070740301XMM J150558.42+014104.2 0021540101XMM J151650.30+070907.3 0109920301 0109920101XMM J152146.64+073113.9 0109930101XMM J152254.63+074534.5 0109930101XMM J161646.54+122015.1 0103460901 0103460801XMM J161736.21+122901.5 0103461001 0103460901XMM J161818.95+124110.3 0103461001
c© 0000 RAS, MNRAS 000, 000–000
10 Page, et al.
Table 2. The X-ray sources and optical counterparts. X-ray fluxes are for the 2-4.5 keV band, in units of 10−14 erg cm−2 s−1. Thecolumn labelled ‘r’ gives the r magnitude from our Isaac Newton Telescope Wide Field Camera images, except for those sourcesmarked with an ‘∗’, in which case the magnitude is UK Schmidt R (for southern fields) or POSS-II R (for northern fields). The ‘cam’column gives the EPIC camera from which the source was selected. The column labelled ‘o − x’ gives the offset between the X-rayand optical positions in arcseconds.
Source Flux HR2 cam Galactic NH optical position (J2000) o-x r type z(2-4.5) (1020 cm−2) RA dec (′′)
XMM J005601.36−012407.4 2.4 −0.04 ± 0.10 PN 3.24 00 56 01.46 −01 24 05.0 2.8 21.0∗ NELG 0.463XMM J005609.41−012641.7 2.4 0.58 ± 0.15 PN 3.29 00 56 09.56 −01 26 41.7 2.2 17.7∗ NELG 0.148XMM J021908.37−044731.4 5.4 0.04 ± 0.10 M2 2.55 02 19 08.38 −04 47 30.7 0.7 19.7 NELG 0.279XMM J021939.22−051133.7 1.8 0.26 ± 0.15 PN 2.59 02 19 39.08 −05 11 33.4 2.1 17.7 NELG 0.151XMM J022322.12−045738.1 1.9 0.60 ± 0.10 PN 2.63 02 23 21.95 −04 57 38.9 2.7 20.7∗ NELG 0.780XMM J080625.35+244326.0 5.8 0.13 ± 0.19 M1 3.94 08 06 25.33 +24 43 24.1 1.9 20.0 BLAGN 0.608XMM J083139.11+524206.2 1.2 0.02 ± 0.14 PN 3.84 08 31 39.08 +52 42 05.8 0.5 17.4 NELG 0.059XMM J090524.00+621114.2 4.0 0.43 ± 0.16 M2 4.47 09 05 23.75 +62 11 09.3 5.2 18.2∗ NELG 0.175XMM J094239.79+465005.3 3.5 0.24 ± 0.11 M1 1.25 09 42 39.99 +46 50 04.9 2.1 20.3 NELG 0.284XMM J094454.24−083953.6 3.3 0.18 ± 0.16 M1 3.60 09 44 54.02 −08 39 52.8 3.4 20.3∗ NELG 0.362XMM J094527.16−083309.4 1.7 0.49 ± 0.21 PN 3.58 09 45 27.18 −08 33 08.1 1.3 18.7∗ NELG 0.369XMM J095231.84−015016.1 5.2 −0.08 ± 0.10 PN 3.96 09 52 31.79 −01 50 13.9 2.3 18.7∗ galaxy 0.316XMM J095539.24+411727.3 2.8 0.06 ± 0.21 PN 1.16 09 55 39.38 +41 17 29.6 2.8 19.1∗ NELG 0.249XMM J104441.90−012655.3 1.9 0.05 ± 0.07 PN 4.18 10 44 41.88 −01 26 56.2 1.0 19.1∗ NELG 0.160XMM J104444.50−013313.5 2.0 −0.01 ± 0.09 PN 4.19 10 44 44.48 −01 33 10.6 2.9 18.3∗ M star 0.000XMM J105014.58+325041.5 1.8 −0.13 ± 0.14 PN 2.00 10 50 14.58 +32 50 42.6 1.1 20.0 NELG 0.309XMM J105743.59−033402.4 2.0 0.18 ± 0.14 PN 3.59 10 57 43.68 −03 34 02.0 1.4 19.0 BLAGN 0.567XMM J111825.42+073448.3 1.3 0.22 ± 0.11 PN 3.75 11 18 25.25 +07 34 48.8 2.6 20.3 BLAGN 0.466XMM J115233.75+371156.3 9.2 0.07 ± 0.13 M1 1.88 11 52 33.80 +37 11 56.5 0.6 19.1∗ NELG 0.411XMM J121312.04+024929.8 2.1 0.42 ± 0.34 PN 1.79 12 13 12.17 +02 49 25.9 4.4 18.8∗ NELG 0.216XMM J122656.53+013125.2 7.5 −0.23 ± 0.06 PN 1.84 12 26 56.46 +01 31 24.6 1.2 19.6∗ BLAGN 0.732XMM J125701.68+281230.2 3.3 0.12 ± 0.12 PN 0.91 12 57 01.72 +28 12 30.2 0.5 18.8∗ BLAGN 0.305XMM J130129.08+274037.1 2.4 0.38 ± 0.15 M1 0.94 13 01 29.17 +27 40 37.3 1.2 19.7∗ NELG 0.462XMM J130458.98+175451.8 2.8 0.66 ± 0.18 M1 2.15 13 04 59.01 +17 54 54.4 2.6 16.3 NELG 0.034XMM J130529.89−102141.5 1.4 0.39 ± 0.14 PN 3.32 13 05 29.89 −10 21 42.3 0.8 19.3∗ NELG 0.366XMM J133026.09+241356.7 2.5 0.04 ± 0.08 PN 1.16 13 30 26.05 +24 13 56.1 0.8 18.7∗ NELG 0.166XMM J133623.04+241738.6 4.1 0.12 ± 0.12 M2 1.17 13 36 22.90 +24 17 36.5 2.8 20.1 NELG 0.341XMM J133913.92−314421.9 2.3 0.01 ± 0.12 M1 3.85 13 39 13.94 −31 44 22.4 0.6 19.4∗ galaxy 0.378XMM J134656.75+580316.5 3.4 0.47 ± 0.10 PN 1.27 13 46 56.75 +58 03 15.7 0.8 20.0 galaxy 0.373XMM J140057.10−110120.6 2.9 −0.12 ± 0.11 M2 4.12 14 00 57.09 −11 01 21.2 0.6 18.0∗ BLAGN 0.257XMM J140145.11+025334.6 2.2 −0.21 ± 0.09 PN 2.33 14 01 45.02 +02 53 33.1 2.0 18.0∗ NELG 0.242XMM J140149.53−111647.8 1.9 0.20 ± 0.12 PN 4.54 14 01 49.52 −11 16 48.4 0.6 19.8 NELG 0.248XMM J141634.78+113329.2 3.9 0.08 ± 0.11 PN 1.82 14 16 34.82 +11 33 31.5 2.4 20.8 NELG 0.519XMM J145048.99+191431.2 3.9 0.02 ± 0.10 M2 2.48 14 50 48.98 +19 14 30.9 0.3 18.1∗ BLAGN 0.774XMM J150339.60+101605.6 9.7 0.63 ± 0.10 M1 2.32 15 03 39.50 +10 16 03.0 3.0 16.9∗ NELG 0.088XMM J150558.42+014104.2 3.4 0.16 ± 0.08 PN 4.26 15 05 58.38 +01 41 04.3 0.6 19.2 NELG 0.237XMM J151650.30+070907.3 3.1 0.07 ± 0.14 M1 2.68 15 16 50.37 +07 09 04.3 3.2 20.5∗ NELG 0.674XMM J152146.64+073113.9 4.2 −0.16 ± 0.06 PN 3.05 15 21 46.68 +07 31 13.4 0.8 19.9 NELG 0.429XMM J152254.63+074534.5 1.1 −0.06 ± 0.20 PN 3.12 15 22 54.63 +07 45 33.4 1.1 19.4∗ NELG 0.400XMM J161646.54+122015.1 2.3 −0.09 ± 0.14 PN 4.57 16 16 46.37 +12 20 17.6 3.5 19.1∗ NELG 0.256XMM J161736.21+122901.5 3.3 0.09 ± 0.18 PN 4.59 16 17 36.25 +12 29 03.3 1.9 15.7∗ NELG 0.030XMM J161818.95+124110.3 3.3 0.43 ± 0.28 M2 4.56 16 18 19.00 +12 41 11.6 1.5 18.3∗ NELG 0.191
of Hα, [O III] 4954 A/5007 A or [O II] 3727 A. The threeobjects classified as galaxies have 0.3 < z < 0.4, simi-lar to the mean redshift for the NELGs, 〈z〉 = 0.29±0.03,so their galaxy classification is not due to these emissionlines being redshifted outside the observed spectral win-dow. The 7 BLAGN, however, have a higher mean red-shift than either the NELGs or galaxies, 〈z〉 = 0.53±0.08.More than half of the BLAGN are identified by a broadMg II 2798 A line.
Two sources (XMM J122656.53+013125.2 andXMM J140057.10−110120.6) have emission lineswith 1000 km s < FWHM < 2000 km s−1,and therefore might conceivably be narrow line
Seyfert 1 galaxies (Osterbrock & Pogge, 1985). InXMM J122656.53+013125.2 the Mg II line has a mea-sured FWHM of 1600 km s−1, and the other lines allhave FWHM < 1000 km s−1. However the large ratioof [O III]/Hβ rules out a narrow-line Seyfert 1 galaxy(Shuder & Osterbrock, 1981), and suggests instead thatthe broad line region is heavily reddened. The Mg IIprofile could be a composite of emission from the narrowline region and a reddened line from the broad line region.For XMM J140057.10−110120.6 only one emission line isdetected (Hα) with a measured FWHM of 1900 km s−1.The red, galaxy-dominated continuum leads us to suspectthat the nucleus and broad line region are also reddened
c© 0000 RAS, MNRAS 000, 000–000
The XMM-SSC survey of hard-spectrum XMM-Newton sources 1: optically bright sources 11
in this object, and that the Hα line profile is likely to bea composite of emission from the narrow line region anda reddened broad line.
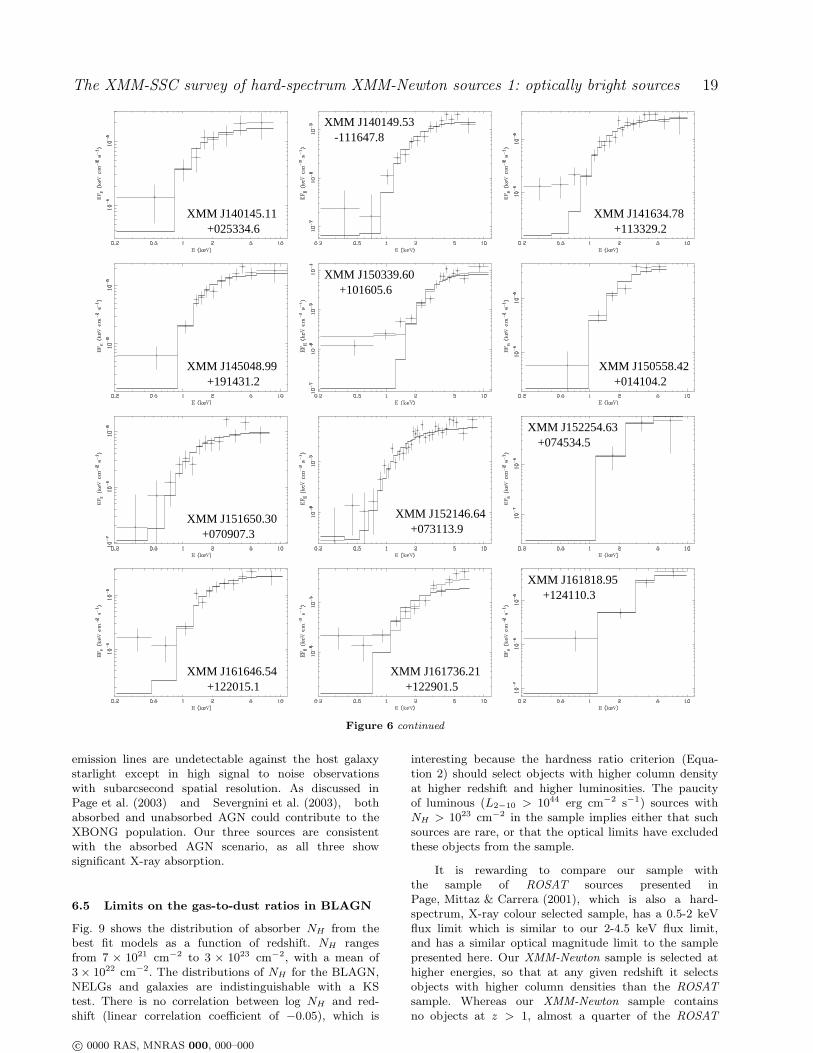
5.2 Basic X-ray spectral modeling
The X-ray spectra are shown in Fig. 6. As a starting pointfor the spectral modeling we considered an absorbed powerlaw model, corresponding to an AGN viewed through ascreen of cold material. For each object we included azero-redshift absorber with NH fixed at the Galactic valuefound from 21 cm observations (Dickey & Lockman, 1990)and a cold absorber at the redshift of the source with NH
as a free parameter in the fit. In fits of this type, partic-ularly in low–moderate signal/noise data, the power-lawphoton index Γ and absorbing column density NH aresomewhat degenerate, and this can lead to large, highlycoupled uncertainties on both parameters. Thereforewe began our spectral fitting with Γ fixed at a valueof 1.9, which is the mean slope found for unobscuredBLAGN in XMM-Newton surveys (Mainieri et al., 2002;Piconcelli et al., 2002; Caccianiga et al., 2004;Mateos et al., 2005a; Page et al., 2006b).
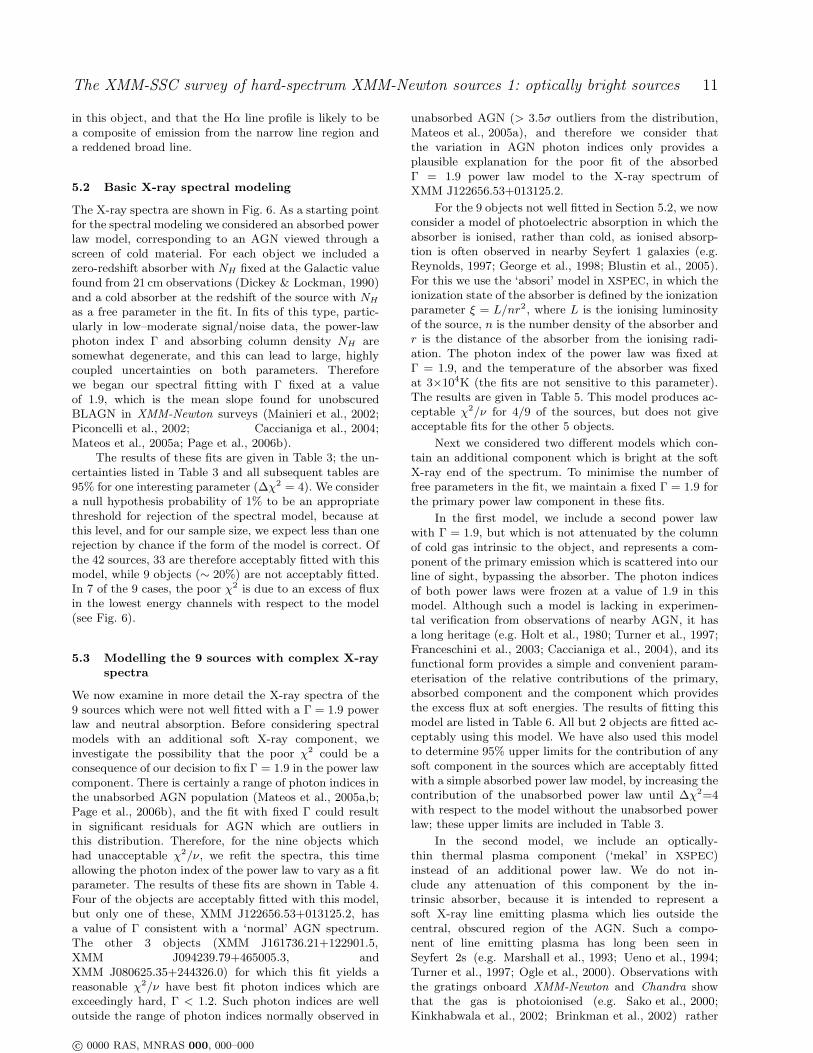
The results of these fits are given in Table 3; the un-certainties listed in Table 3 and all subsequent tables are95% for one interesting parameter (∆χ2 = 4). We considera null hypothesis probability of 1% to be an appropriatethreshold for rejection of the spectral model, because atthis level, and for our sample size, we expect less than onerejection by chance if the form of the model is correct. Ofthe 42 sources, 33 are therefore acceptably fitted with thismodel, while 9 objects (∼ 20%) are not acceptably fitted.In 7 of the 9 cases, the poor χ2 is due to an excess of fluxin the lowest energy channels with respect to the model(see Fig. 6).
5.3 Modelling the 9 sources with complex X-ray
spectra
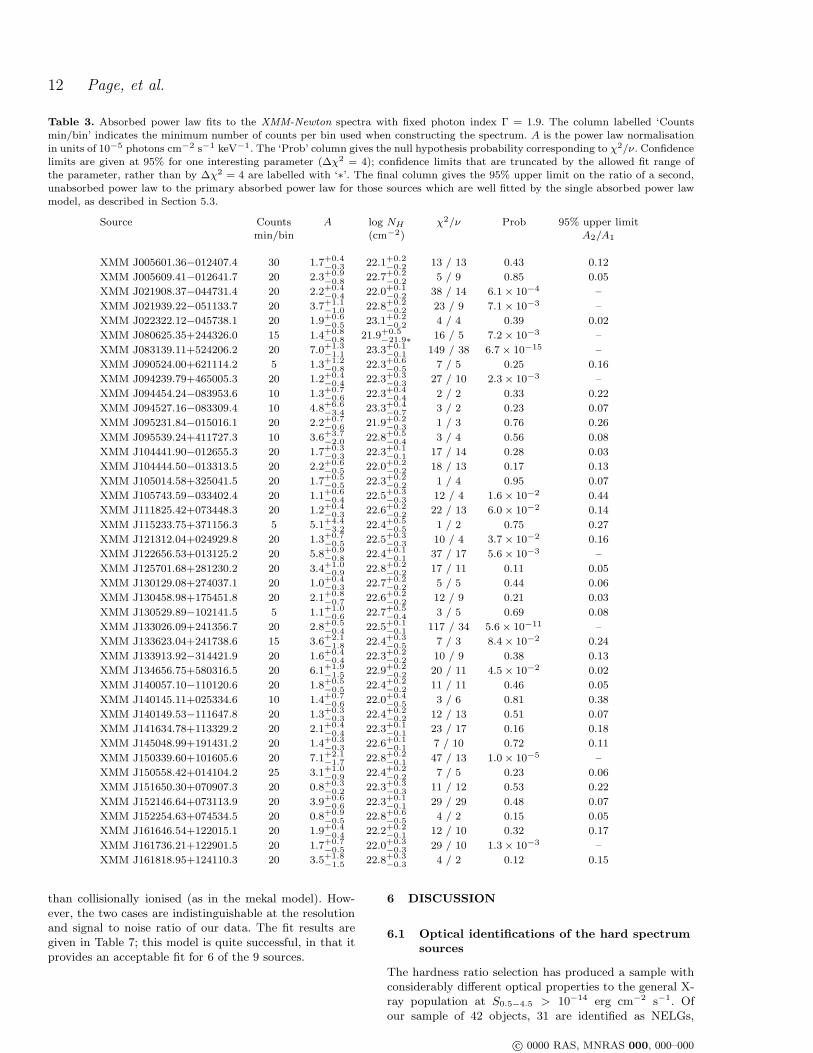
We now examine in more detail the X-ray spectra of the9 sources which were not well fitted with a Γ = 1.9 powerlaw and neutral absorption. Before considering spectralmodels with an additional soft X-ray component, weinvestigate the possibility that the poor χ2 could be aconsequence of our decision to fix Γ = 1.9 in the power lawcomponent. There is certainly a range of photon indices inthe unabsorbed AGN population (Mateos et al., 2005a,b;Page et al., 2006b), and the fit with fixed Γ could resultin significant residuals for AGN which are outliers inthis distribution. Therefore, for the nine objects whichhad unacceptable χ2/ν, we refit the spectra, this timeallowing the photon index of the power law to vary as a fitparameter. The results of these fits are shown in Table 4.Four of the objects are acceptably fitted with this model,but only one of these, XMM J122656.53+013125.2, hasa value of Γ consistent with a ‘normal’ AGN spectrum.The other 3 objects (XMM J161736.21+122901.5,XMM J094239.79+465005.3, andXMM J080625.35+244326.0) for which this fit yields areasonable χ2/ν have best fit photon indices which areexceedingly hard, Γ < 1.2. Such photon indices are welloutside the range of photon indices normally observed in
unabsorbed AGN (> 3.5σ outliers from the distribution,Mateos et al., 2005a), and therefore we consider thatthe variation in AGN photon indices only provides aplausible explanation for the poor fit of the absorbedΓ = 1.9 power law model to the X-ray spectrum ofXMM J122656.53+013125.2.
For the 9 objects not well fitted in Section 5.2, we nowconsider a model of photoelectric absorption in which theabsorber is ionised, rather than cold, as ionised absorp-tion is often observed in nearby Seyfert 1 galaxies (e.g.Reynolds, 1997; George et al., 1998; Blustin et al., 2005).For this we use the ‘absori’ model in XSPEC, in which theionization state of the absorber is defined by the ionizationparameter ξ = L/nr2, where L is the ionising luminosityof the source, n is the number density of the absorber andr is the distance of the absorber from the ionising radi-ation. The photon index of the power law was fixed atΓ = 1.9, and the temperature of the absorber was fixedat 3×10⁴K (the fits are not sensitive to this parameter).The results are given in Table 5. This model produces ac-ceptable χ2/ν for 4/9 of the sources, but does not giveacceptable fits for the other 5 objects.
Next we considered two different models which con-tain an additional component which is bright at the softX-ray end of the spectrum. To minimise the number offree parameters in the fit, we maintain a fixed Γ = 1.9 forthe primary power law component in these fits.
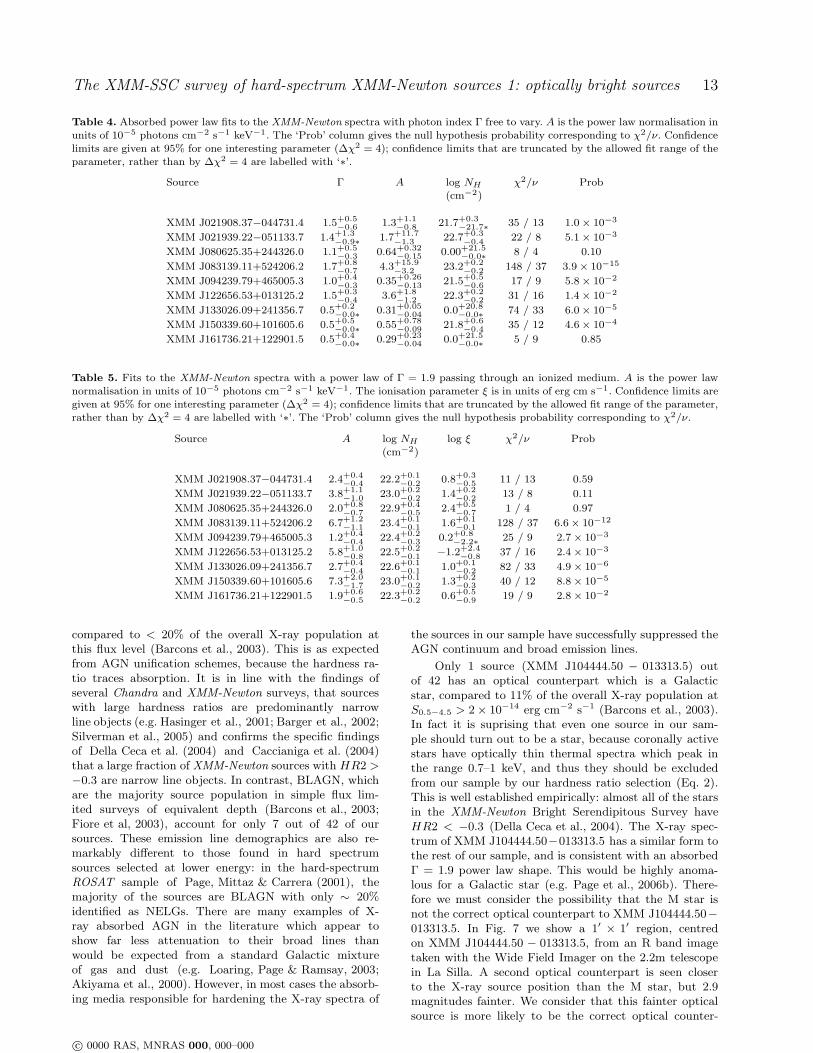
In the first model, we include a second power lawwith Γ = 1.9, but which is not attenuated by the columnof cold gas intrinsic to the object, and represents a com-ponent of the primary emission which is scattered into ourline of sight, bypassing the absorber. The photon indicesof both power laws were frozen at a value of 1.9 in thismodel. Although such a model is lacking in experimen-tal verification from observations of nearby AGN, it hasa long heritage (e.g. Holt et al., 1980; Turner et al., 1997;Franceschini et al., 2003; Caccianiga et al., 2004), and itsfunctional form provides a simple and convenient param-eterisation of the relative contributions of the primary,absorbed component and the component which providesthe excess flux at soft energies. The results of fitting thismodel are listed in Table 6. All but 2 objects are fitted ac-ceptably using this model. We have also used this modelto determine 95% upper limits for the contribution of anysoft component in the sources which are acceptably fittedwith a simple absorbed power law model, by increasing thecontribution of the unabsorbed power law until ∆χ2=4with respect to the model without the unabsorbed powerlaw; these upper limits are included in Table 3.
In the second model, we include an optically-thin thermal plasma component (‘mekal’ in XSPEC)instead of an additional power law. We do not in-clude any attenuation of this component by the in-trinsic absorber, because it is intended to represent asoft X-ray line emitting plasma which lies outside thecentral, obscured region of the AGN. Such a compo-nent of line emitting plasma has long been seen inSeyfert 2s (e.g. Marshall et al., 1993; Ueno et al., 1994;Turner et al., 1997; Ogle et al., 2000). Observations withthe gratings onboard XMM-Newton and Chandra showthat the gas is photoionised (e.g. Sako et al., 2000;Kinkhabwala et al., 2002; Brinkman et al., 2002) rather
c© 0000 RAS, MNRAS 000, 000–000
12 Page, et al.
Table 3. Absorbed power law fits to the XMM-Newton spectra with fixed photon index Γ = 1.9. The column labelled ‘Countsmin/bin’ indicates the minimum number of counts per bin used when constructing the spectrum. A is the power law normalisationin units of 10−5 photons cm−2 s−1 keV−1. The ‘Prob’ column gives the null hypothesis probability corresponding to χ2/ν. Confidencelimits are given at 95% for one interesting parameter (∆χ2 = 4); confidence limits that are truncated by the allowed fit range ofthe parameter, rather than by ∆χ2 = 4 are labelled with ‘∗’. The final column gives the 95% upper limit on the ratio of a second,unabsorbed power law to the primary absorbed power law for those sources which are well fitted by the single absorbed power lawmodel, as described in Section 5.3.
Source Counts A log NH χ2/ν Prob 95% upper limitmin/bin (cm−2) A2/A1
XMM J005601.36−012407.4 30 1.7+0.4−0.3
22.1+0.2−0.2
13 / 13 0.43 0.12
XMM J005609.41−012641.7 20 2.3+0.9−0.8
22.7+0.2−0.2
5 / 9 0.85 0.05
XMM J021908.37−044731.4 20 2.2+0.4−0.4
22.0+0.1−0.2
38 / 14 6.1 × 10⁻⁴ –
XMM J021939.22−051133.7 20 3.7+1.1−1.0
22.8+0.2−0.2
23 / 9 7.1 × 10⁻³ –
XMM J022322.12−045738.1 20 1.9+0.6−0.5
23.1+0.2−0.2
4 / 4 0.39 0.02
XMM J080625.35+244326.0 15 1.4+0.8−0.8
21.9+0.5−21.9∗
16 / 5 7.2 × 10⁻³ –
XMM J083139.11+524206.2 20 7.0+1.3−1.1
23.3+0.1−0.1
149 / 38 6.7 × 10⁻¹⁵ –
XMM J090524.00+621114.2 5 1.3+1.2−0.8
22.3+0.6−0.5
7 / 5 0.25 0.16
XMM J094239.79+465005.3 20 1.2+0.4−0.4
22.3+0.3−0.3
27 / 10 2.3 × 10⁻³ –
XMM J094454.24−083953.6 10 1.3+0.7−0.6
22.3+0.4−0.4
2 / 2 0.33 0.22
XMM J094527.16−083309.4 10 4.8+6.6−3.4
23.3+0.4−0.7
3 / 2 0.23 0.07
XMM J095231.84−015016.1 20 2.2+0.7−0.6
21.9+0.2−0.3
1 / 3 0.76 0.26
XMM J095539.24+411727.3 10 3.6+3.7−2.0
22.8+0.5−0.4
3 / 4 0.56 0.08
XMM J104441.90−012655.3 20 1.7+0.3−0.3
22.3+0.1−0.1
17 / 14 0.28 0.03
XMM J104444.50−013313.5 20 2.2+0.6−0.5
22.0+0.2−0.2
18 / 13 0.17 0.13
XMM J105014.58+325041.5 20 1.7+0.5−0.5
22.3+0.2−0.2
1 / 4 0.95 0.07
XMM J105743.59−033402.4 20 1.1+0.6−0.4
22.5+0.3−0.3
12 / 4 1.6 × 10⁻² 0.44
XMM J111825.42+073448.3 20 1.2+0.4−0.3
22.6+0.2−0.2
22 / 13 6.0 × 10⁻² 0.14
XMM J115233.75+371156.3 5 5.1+4.4−3.2
22.4+0.5−0.5
1 / 2 0.75 0.27
XMM J121312.04+024929.8 20 1.3+0.7−0.5
22.5+0.3−0.3
10 / 4 3.7 × 10⁻² 0.16
XMM J122656.53+013125.2 20 5.8+0.9−0.8
22.4+0.1−0.1
37 / 17 5.6 × 10⁻³ –
XMM J125701.68+281230.2 20 3.4+1.0−0.9
22.8+0.2−0.2
17 / 11 0.11 0.05
XMM J130129.08+274037.1 20 1.0+0.4−0.3
22.7+0.2−0.2
5 / 5 0.44 0.06
XMM J130458.98+175451.8 20 2.1+0.8−0.7
22.6+0.2−0.2
12 / 9 0.21 0.03
XMM J130529.89−102141.5 5 1.1+1.0−0.6
22.7+0.5−0.4
3 / 5 0.69 0.08
XMM J133026.09+241356.7 20 2.8+0.5−0.4
22.5+0.1−0.1
117 / 34 5.6 × 10⁻¹¹ –
XMM J133623.04+241738.6 15 3.6+2.1−1.8
22.4+0.3−0.5
7 / 3 8.4 × 10⁻² 0.24
XMM J133913.92−314421.9 20 1.6+0.4−0.4
22.3+0.2−0.2
10 / 9 0.38 0.13
XMM J134656.75+580316.5 20 6.1+1.9−1.5
22.9+0.2−0.2
20 / 11 4.5 × 10⁻² 0.02
XMM J140057.10−110120.6 20 1.8+0.5−0.5
22.4+0.2−0.2
11 / 11 0.46 0.05
XMM J140145.11+025334.6 10 1.4+0.7−0.6
22.0+0.4−0.5
3 / 6 0.81 0.38
XMM J140149.53−111647.8 20 1.3+0.3−0.3
22.4+0.2−0.2
12 / 13 0.51 0.07
XMM J141634.78+113329.2 20 2.1+0.4−0.4
22.3+0.1−0.1
23 / 17 0.16 0.18
XMM J145048.99+191431.2 20 1.4+0.3−0.3
22.6+0.1−0.1
7 / 10 0.72 0.11
XMM J150339.60+101605.6 20 7.1+2.1−1.7
22.8+0.2−0.1
47 / 13 1.0 × 10⁻⁵ –
XMM J150558.42+014104.2 25 3.1+1.0−0.9
22.4+0.2−0.2
7 / 5 0.23 0.06
XMM J151650.30+070907.3 20 0.8+0.3−0.2
22.3+0.3−0.3
11 / 12 0.53 0.22
XMM J152146.64+073113.9 20 3.9+0.6−0.6
22.3+0.1−0.1
29 / 29 0.48 0.07
XMM J152254.63+074534.5 20 0.8+0.9−0.5
22.8+0.6−0.5
4 / 2 0.15 0.05
XMM J161646.54+122015.1 20 1.9+0.4−0.4
22.2+0.2−0.1
12 / 10 0.32 0.17
XMM J161736.21+122901.5 20 1.7+0.7−0.5
22.0+0.3−0.3
29 / 10 1.3 × 10⁻³ –
XMM J161818.95+124110.3 20 3.5+1.8−1.5
22.8+0.3−0.3
4 / 2 0.12 0.15
than collisionally ionised (as in the mekal model). How-ever, the two cases are indistinguishable at the resolutionand signal to noise ratio of our data. The fit results aregiven in Table 7; this model is quite successful, in that itprovides an acceptable fit for 6 of the 9 sources.
6 DISCUSSION
6.1 Optical identifications of the hard spectrum
sources
The hardness ratio selection has produced a sample withconsiderably different optical properties to the general X-ray population at S0.5−4.5 > 10−14 erg cm−2 s−1. Ofour sample of 42 objects, 31 are identified as NELGs,
c© 0000 RAS, MNRAS 000, 000–000
The XMM-SSC survey of hard-spectrum XMM-Newton sources 1: optically bright sources 13
Table 4. Absorbed power law fits to the XMM-Newton spectra with photon index Γ free to vary. A is the power law normalisation inunits of 10−5 photons cm−2 s−1 keV−1. The ‘Prob’ column gives the null hypothesis probability corresponding to χ2/ν. Confidencelimits are given at 95% for one interesting parameter (∆χ2 = 4); confidence limits that are truncated by the allowed fit range of theparameter, rather than by ∆χ2 = 4 are labelled with ‘∗’.
Source Γ A log NH χ2/ν Prob(cm−2)
XMM J021908.37−044731.4 1.5+0.5−0.6
1.3+1.1−0.8
21.7+0.3−21.7∗
35 / 13 1.0 × 10⁻³
XMM J021939.22−051133.7 1.4+1.3−0.9∗
1.7+11.7−1.3
22.7+0.3−0.4
22 / 8 5.1 × 10⁻³
XMM J080625.35+244326.0 1.1+0.5−0.3
0.64+0.32−0.15
0.00+21.5−0.0∗
8 / 4 0.10
XMM J083139.11+524206.2 1.7+0.8−0.7
4.3+15.9−3.2
23.2+0.2−0.2
148 / 37 3.9 × 10⁻¹⁵
XMM J094239.79+465005.3 1.0+0.4−0.3
0.35+0.26−0.13
21.5+0.5−0.6
17 / 9 5.8 × 10⁻²
XMM J122656.53+013125.2 1.5+0.3−0.4
3.6+1.8−1.2
22.3+0.2−0.2
31 / 16 1.4 × 10⁻²
XMM J133026.09+241356.7 0.5+0.2−0.0∗
0.31+0.05−0.04
0.0+20.8−0.0∗
74 / 33 6.0 × 10⁻⁵
XMM J150339.60+101605.6 0.5+0.5−0.0∗
0.55+0.78−0.09
21.8+0.6−0.4
35 / 12 4.6 × 10⁻⁴
XMM J161736.21+122901.5 0.5+0.4−0.0∗
0.29+0.23−0.04
0.0+21.5−0.0∗
5 / 9 0.85
Table 5. Fits to the XMM-Newton spectra with a power law of Γ = 1.9 passing through an ionized medium. A is the power lawnormalisation in units of 10−5 photons cm−2 s−1 keV−1. The ionisation parameter ξ is in units of erg cm s−1. Confidence limits aregiven at 95% for one interesting parameter (∆χ2 = 4); confidence limits that are truncated by the allowed fit range of the parameter,rather than by ∆χ2 = 4 are labelled with ‘∗’. The ‘Prob’ column gives the null hypothesis probability corresponding to χ2/ν.
Source A log NH log ξ χ2/ν Prob(cm−2)
XMM J021908.37−044731.4 2.4+0.4−0.4
22.2+0.1−0.2
0.8+0.3−0.5
11 / 13 0.59
XMM J021939.22−051133.7 3.8+1.1−1.0
23.0+0.2−0.2
1.4+0.2−0.2
13 / 8 0.11
XMM J080625.35+244326.0 2.0+0.8−0.7
22.9+0.4−0.5
2.4+0.5−0.7
1 / 4 0.97
XMM J083139.11+524206.2 6.7+1.2−1.1
23.4+0.1−0.1
1.6+0.1−0.1
128 / 37 6.6 × 10⁻¹²
XMM J094239.79+465005.3 1.2+0.4−0.4
22.4+0.2−0.3
0.2+0.8−2.2∗
25 / 9 2.7 × 10⁻³
XMM J122656.53+013125.2 5.8+1.0−0.8
22.5+0.2−0.1
−1.2+2.4−0.8
37 / 16 2.4 × 10⁻³
XMM J133026.09+241356.7 2.7+0.4−0.4
22.6+0.1−0.1
1.0+0.1−0.2
82 / 33 4.9 × 10⁻⁶
XMM J150339.60+101605.6 7.3+2.0−1.7
23.0+0.1−0.2
1.3+0.2−0.3
40 / 12 8.8 × 10⁻⁵
XMM J161736.21+122901.5 1.9+0.6−0.5
22.3+0.2−0.2
0.6+0.5−0.9
19 / 9 2.8 × 10⁻²
compared to < 20% of the overall X-ray population atthis flux level (Barcons et al., 2003). This is as expectedfrom AGN unification schemes, because the hardness ra-tio traces absorption. It is in line with the findings ofseveral Chandra and XMM-Newton surveys, that sourceswith large hardness ratios are predominantly narrowline objects (e.g. Hasinger et al., 2001; Barger et al., 2002;Silverman et al., 2005) and confirms the specific findingsof Della Ceca et al. (2004) and Caccianiga et al. (2004)that a large fraction of XMM-Newton sources with HR2 >−0.3 are narrow line objects. In contrast, BLAGN, whichare the majority source population in simple flux lim-ited surveys of equivalent depth (Barcons et al., 2003;Fiore et al, 2003), account for only 7 out of 42 of oursources. These emission line demographics are also re-markably different to those found in hard spectrumsources selected at lower energy: in the hard-spectrumROSAT sample of Page, Mittaz & Carrera (2001), themajority of the sources are BLAGN with only ∼ 20%identified as NELGs. There are many examples of X-ray absorbed AGN in the literature which appear toshow far less attenuation to their broad lines thanwould be expected from a standard Galactic mixtureof gas and dust (e.g. Loaring, Page & Ramsay, 2003;Akiyama et al., 2000). However, in most cases the absorb-ing media responsible for hardening the X-ray spectra of
the sources in our sample have successfully suppressed theAGN continuum and broad emission lines.
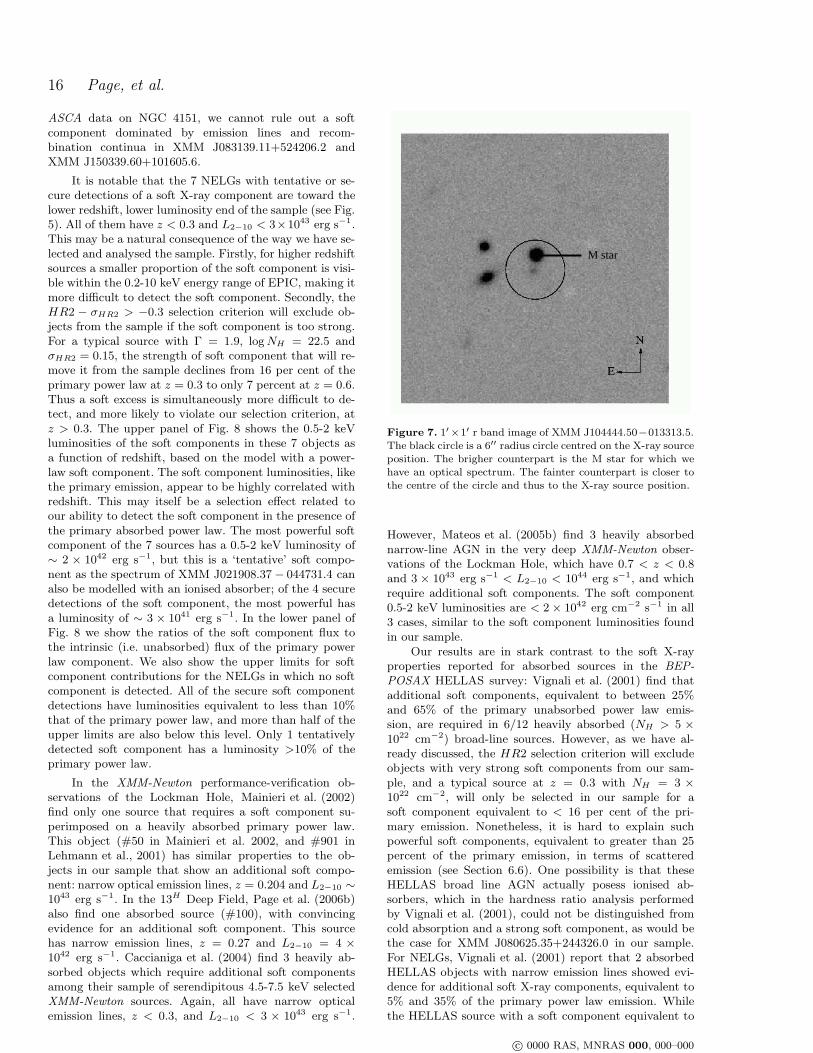
Only 1 source (XMM J104444.50 − 013313.5) outof 42 has an optical counterpart which is a Galacticstar, compared to 11% of the overall X-ray population atS0.5−4.5 > 2 × 10⁻¹⁴ erg cm−2 s−1 (Barcons et al., 2003).In fact it is suprising that even one source in our sam-ple should turn out to be a star, because coronally activestars have optically thin thermal spectra which peak inthe range 0.7–1 keV, and thus they should be excludedfrom our sample by our hardness ratio selection (Eq. 2).This is well established empirically: almost all of the starsin the XMM-Newton Bright Serendipitous Survey haveHR2 < −0.3 (Della Ceca et al., 2004). The X-ray spec-trum of XMM J104444.50−013313.5 has a similar form tothe rest of our sample, and is consistent with an absorbedΓ = 1.9 power law shape. This would be highly anoma-lous for a Galactic star (e.g. Page et al., 2006b). There-fore we must consider the possibility that the M star isnot the correct optical counterpart to XMM J104444.50−013313.5. In Fig. 7 we show a 1′ × 1′ region, centredon XMM J104444.50 − 013313.5, from an R band imagetaken with the Wide Field Imager on the 2.2m telescopein La Silla. A second optical counterpart is seen closerto the X-ray source position than the M star, but 2.9magnitudes fainter. We consider that this fainter opticalsource is more likely to be the correct optical counter-
c© 0000 RAS, MNRAS 000, 000–000
14 Page, et al.
Table 6. Two component fits to the XMM-Newton spectra consisting of two power laws, of which one is absorbed by cold material,and the other is not. A1 is the normalisation of the absorbed power law and A2 is the normalisation of the unabsorbed component, inunits of 10−5 photons cm−2 s−1 keV−1. Both power laws have fixed Γ = 1.9. Confidence limits are given at 95% for one interestingparameter (∆χ2 = 4); confidence limits that are truncated by the allowed fit range of the parameter, rather than by ∆χ2 = 4 arelabelled with ‘∗’. The ‘Prob’ column gives the null hypothesis probability corresponding to χ2/ν.
Source A1 A2 log NH χ2/ν Prob(cm−2)
XMM J021908.37−044731.4 2.2+0.5−0.5
0.32+0.12−0.13
22.3+0.2−0.2
16 / 13 0.27
XMM J021939.22−051133.7 4.1+1.3−1.1
0.11+0.05−0.05
22.9+0.3−0.3
7 / 8 0.54
XMM J080625.35+244326.0 1.5+1.1−0.9
0.56+0.23−0.27
22.7+0.6−0.5
4 / 4 0.47
XMM J083139.11+524206.2 7.6+1.4−1.3
0.13+0.02−0.03
23.4+0.1−0.1
39 / 37 0.38
XMM J094239.79+465005.3 1.3+0.4−0.4
0.05+0.05−0.05
22.4+0.3−0.3
23 / 9 5.5 × 10⁻³
XMM J122656.53+013125.2 5.7+0.7−0.8
0.00+0.09−0.00∗
22.4+0.1−0.1
37 / 16 2.0 × 10⁻³
XMM J133026.09+241356.7 3.0+0.5−0.4
0.20+0.05−0.04
22.6+0.1−0.1
27 / 33 0.78
XMM J150339.60+101605.6 7.9+2.2−1.9
0.21+0.09−0.08
22.9+0.1−0.1
22 / 12 3.7 × 10⁻²
XMM J161736.21+122901.5 2.4+1.1−0.8
0.23+0.09−0.10
22.5+0.3−0.3
11 / 9 0.30
Table 7. Two component fits to the XMM-Newton spectra consisting of an absorbed, Γ = 1.9 power law, and an optically-thinthermal plasma. A is the power law normalisation in units of 10−5 photons cm−2 s−1 keV−1. The ‘Prob’ column gives the nullhypothesis probability corresponding to χ2/ν. Confidence limits are given at 95% for one interesting parameter (∆χ2 = 4); confidencelimits that are truncated by the allowed fit range of the parameter, rather than by ∆χ2 = 4 are labelled with ‘∗’.
Source A log NH kT χ2/ν Prob(cm−2) (keV)
XMM J021908.37−044731.4 2.4+0.5−0.5
22.1+0.2−0.2
0.23+0.07−0.07
10 / 12 0.64
XMM J021939.22−051133.7 3.8+1.1−1.0
22.8+0.2−0.2
0.30+0.11−0.08
3 / 7 0.88
XMM J080625.35+244326.0 1.9+0.7−0.7
22.4+0.2−0.5
0.43+0.40−0.23
1 / 3 0.93
XMM J083139.11+524206.2 7.2+1.2−1.2
23.3+0.1−0.1
1.00+0.00∗−0.11
77 / 40 8.6 × 10⁻⁵
XMM J094239.79+465005.3 1.4+0.4−0.4
22.5+0.1−0.2
1.00+0.00∗−0.18
16 / 8 4.9 × 10⁻²
XMM J122656.53+013125.2 5.7+1.0−0.8
22.4+0.1−0.1
1.00+0.00∗−0.90∗
37 / 15 1.2 × 10⁻³
XMM J133026.09+241356.7 2.9+0.4−0.4
22.5+0.1−0.1
0.29+0.06−0.05
44 / 32 7.5 × 10⁻²
XMM J150339.60+101605.6 7.3+2.3−1.7
22.8+0.2−0.1
1.00+0.00∗−0.21
27 / 11 4.0 × 10⁻³
XMM J161736.21+122901.5 2.1+0.8−0.6
22.3+0.3−0.2
0.41+0.59−0.20
17 / 8 2.9 × 10⁻²
part than the M star, and that the proximity of the Mstar to the X-ray source is coincidental. If this is correct,then XMM J104444.50 − 013313.5 should be assigned tothe optically-faint subsample, rather than optically-brightsubsample.
6.2 Redshift and luminosity distributions
For each source we have calculated the intrinsic, rest-frame2-10 keV luminosity, based on the unabsorbed primarypower law continuum from the best-fit spectral model,shown in Fig. 6. These luminosities are shown as a func-tion of redshift in Fig. 5. As expected from a flux limitedsample,5 luminosity is strongly correlated with redshift:the linear correlation coefficient of log L2−10 and z is 0.84,and the probability that there is no correlation is < 10−11.The BLAGN of the sample have higher mean redshifts andluminosities (〈z〉 = 0.53 ± 0.08, 〈log L2−10〉 = 43.7 ± 0.19)than the NELGs (〈z〉 = 0.30 ± 0.03, 〈log L2−10〉 = 43.0 ±0.12), but the differences are only of moderate statistical
5 A uniform flux limit has not been imposed on the sample;nonetheless the sample is flux-limited in that the distance towhich an object of any particular luminosity can be detected isdetermined by its flux.
significance: according to the Kolmogorov-Smirnov testboth the redshift distributions and the luminosity distri-butions differ between the BLAGN and NELGs with 98%confidence.
All but 2 of the sources have 2-10 keV luminosities inexcess of 1042 erg s−1, and therefore undoubtably containAGN. The other two objects, which have 2-10 keV lu-minosities of ∼ 1041 erg s−1, do not display deep Balmerabsorption lines in their optical spectra, which would indi-cate a population of young stars. One of these two sources,XMM J161736.21 + 122901.5, has emission lines whichclassify it as a Seyfert 2, and hence is unambiguouslyAGN-dominated. The other, XMM J130458.98+175451.8,has only a weak [O II] 3727 A line, and no Hα emission canbe discerned, suggesting that it is not strongly star form-ing, and hence that its X-ray emission must also comefrom an obscured AGN.
Most of the objects in our sample have luminosi-ties typical of Seyfert galaxies (1041 < L2−10 < 1044).However, the three highest redshift objects have L2−10 >1044 erg s−1, within the luminosity range of QSOs. Twoof these would be classified as ‘type 2’ QSOs according totheir optical spectra: XMM J022322.12 − 045738.1 showsonly narrow lines, and XMM J122656.53 + 013125.2 isdominated by narrow lines (although the FWHM of Mg IIexceeds 1000 kms−1, leading to a BLAGN classification
c© 0000 RAS, MNRAS 000, 000–000
The XMM-SSC survey of hard-spectrum XMM-Newton sources 1: optically bright sources 15
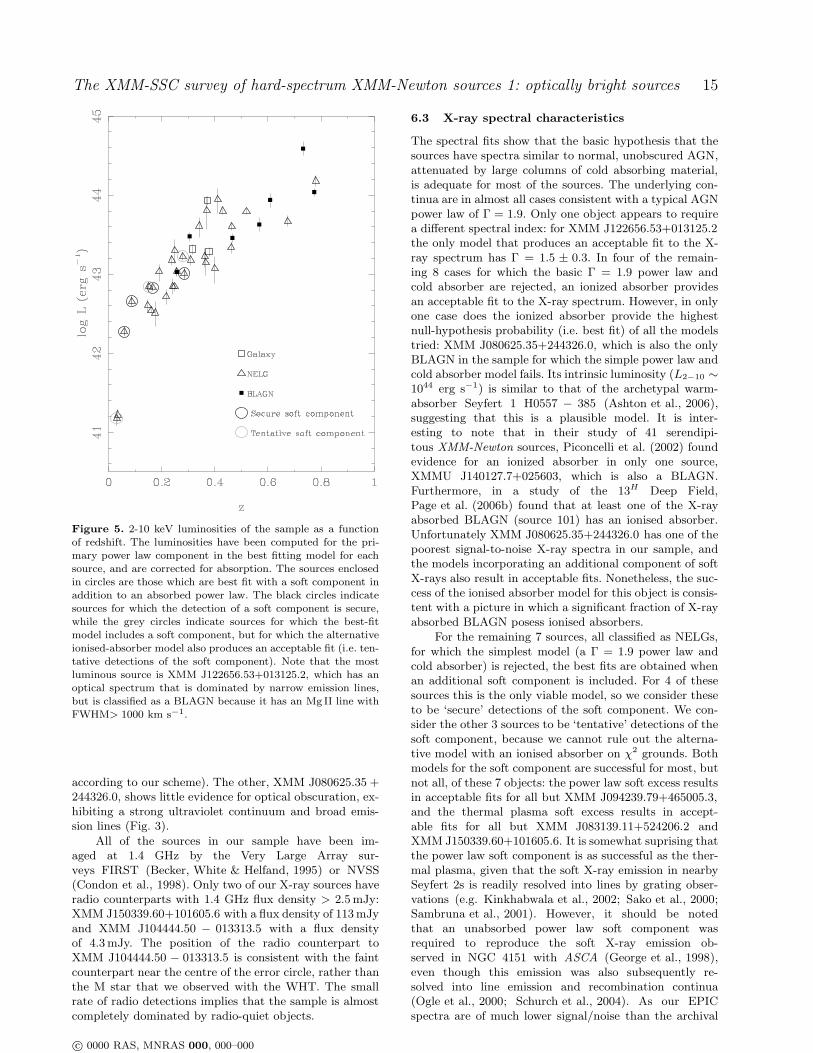
Figure 5. 2-10 keV luminosities of the sample as a functionof redshift. The luminosities have been computed for the pri-mary power law component in the best fitting model for eachsource, and are corrected for absorption. The sources enclosedin circles are those which are best fit with a soft component inaddition to an absorbed power law. The black circles indicatesources for which the detection of a soft component is secure,while the grey circles indicate sources for which the best-fitmodel includes a soft component, but for which the alternativeionised-absorber model also produces an acceptable fit (i.e. ten-tative detections of the soft component). Note that the mostluminous source is XMM J122656.53+013125.2, which has anoptical spectrum that is dominated by narrow emission lines,but is classified as a BLAGN because it has an Mg II line withFWHM> 1000 km s−1.
according to our scheme). The other, XMM J080625.35 +244326.0, shows little evidence for optical obscuration, ex-hibiting a strong ultraviolet continuum and broad emis-sion lines (Fig. 3).
All of the sources in our sample have been im-aged at 1.4 GHz by the Very Large Array sur-veys FIRST (Becker, White & Helfand, 1995) or NVSS(Condon et al., 1998). Only two of our X-ray sources haveradio counterparts with 1.4 GHz flux density > 2.5 mJy:XMM J150339.60+101605.6 with a flux density of 113 mJyand XMM J104444.50 − 013313.5 with a flux densityof 4.3 mJy. The position of the radio counterpart toXMM J104444.50 − 013313.5 is consistent with the faintcounterpart near the centre of the error circle, rather thanthe M star that we observed with the WHT. The smallrate of radio detections implies that the sample is almostcompletely dominated by radio-quiet objects.
6.3 X-ray spectral characteristics
The spectral fits show that the basic hypothesis that thesources have spectra similar to normal, unobscured AGN,attenuated by large columns of cold absorbing material,is adequate for most of the sources. The underlying con-tinua are in almost all cases consistent with a typical AGNpower law of Γ = 1.9. Only one object appears to requirea different spectral index: for XMM J122656.53+013125.2the only model that produces an acceptable fit to the X-ray spectrum has Γ = 1.5 ± 0.3. In four of the remain-ing 8 cases for which the basic Γ = 1.9 power law andcold absorber are rejected, an ionized absorber providesan acceptable fit to the X-ray spectrum. However, in onlyone case does the ionized absorber provide the highestnull-hypothesis probability (i.e. best fit) of all the modelstried: XMM J080625.35+244326.0, which is also the onlyBLAGN in the sample for which the simple power law andcold absorber model fails. Its intrinsic luminosity (L2−10 ∼1044 erg s−1) is similar to that of the archetypal warm-absorber Seyfert 1 H0557 − 385 (Ashton et al., 2006),suggesting that this is a plausible model. It is inter-esting to note that in their study of 41 serendipi-tous XMM-Newton sources, Piconcelli et al. (2002) foundevidence for an ionized absorber in only one source,XMMU J140127.7+025603, which is also a BLAGN.Furthermore, in a study of the 13H Deep Field,Page et al. (2006b) found that at least one of the X-rayabsorbed BLAGN (source 101) has an ionised absorber.Unfortunately XMM J080625.35+244326.0 has one of thepoorest signal-to-noise X-ray spectra in our sample, andthe models incorporating an additional component of softX-rays also result in acceptable fits. Nonetheless, the suc-cess of the ionised absorber model for this object is consis-tent with a picture in which a significant fraction of X-rayabsorbed BLAGN posess ionised absorbers.
For the remaining 7 sources, all classified as NELGs,for which the simplest model (a Γ = 1.9 power law andcold absorber) is rejected, the best fits are obtained whenan additional soft component is included. For 4 of thesesources this is the only viable model, so we consider theseto be ‘secure’ detections of the soft component. We con-sider the other 3 sources to be ‘tentative’ detections of thesoft component, because we cannot rule out the alterna-tive model with an ionised absorber on χ2 grounds. Bothmodels for the soft component are successful for most, butnot all, of these 7 objects: the power law soft excess resultsin acceptable fits for all but XMM J094239.79+465005.3,and the thermal plasma soft excess results in accept-able fits for all but XMM J083139.11+524206.2 andXMM J150339.60+101605.6. It is somewhat suprising thatthe power law soft component is as successful as the ther-mal plasma, given that the soft X-ray emission in nearbySeyfert 2s is readily resolved into lines by grating obser-vations (e.g. Kinkhabwala et al., 2002; Sako et al., 2000;Sambruna et al., 2001). However, it should be notedthat an unabsorbed power law soft component wasrequired to reproduce the soft X-ray emission ob-served in NGC 4151 with ASCA (George et al., 1998),even though this emission was also subsequently re-solved into line emission and recombination continua(Ogle et al., 2000; Schurch et al., 2004). As our EPICspectra are of much lower signal/noise than the archival
c© 0000 RAS, MNRAS 000, 000–000
16 Page, et al.
ASCA data on NGC 4151, we cannot rule out a softcomponent dominated by emission lines and recom-bination continua in XMM J083139.11+524206.2 andXMM J150339.60+101605.6.
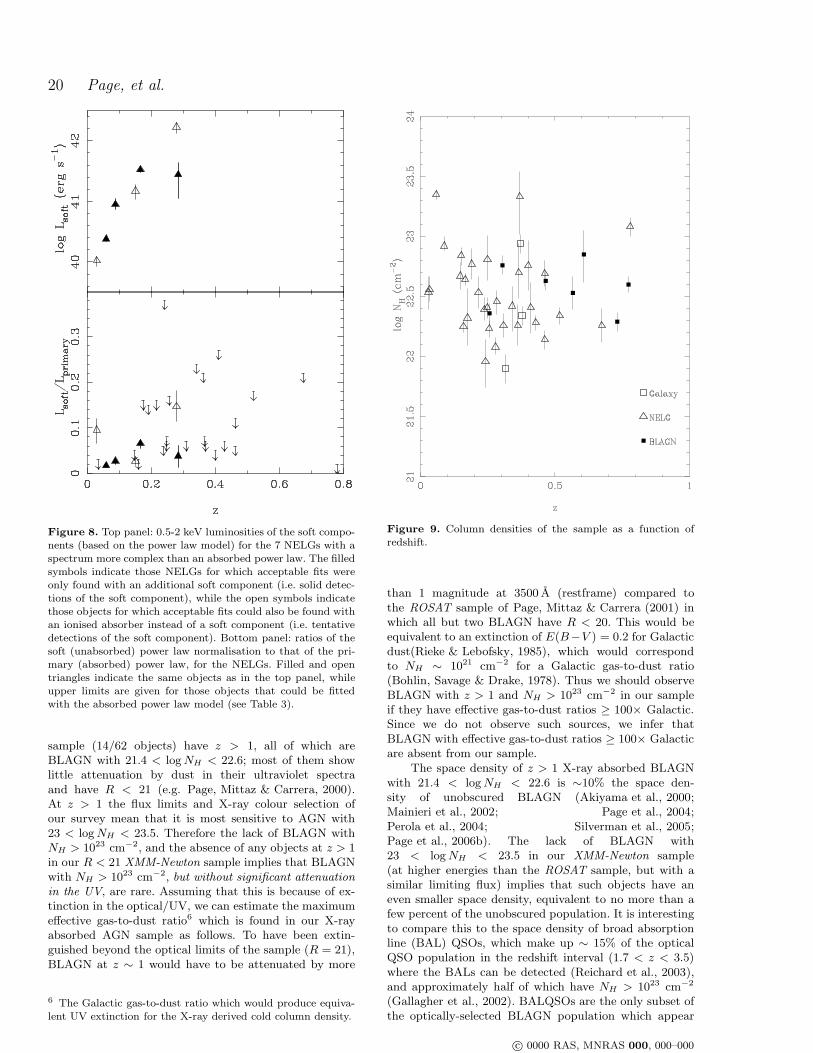
It is notable that the 7 NELGs with tentative or se-cure detections of a soft X-ray component are toward thelower redshift, lower luminosity end of the sample (see Fig.5). All of them have z < 0.3 and L2−10 < 3×1043 erg s−1.This may be a natural consequence of the way we have se-lected and analysed the sample. Firstly, for higher redshiftsources a smaller proportion of the soft component is visi-ble within the 0.2-10 keV energy range of EPIC, making itmore difficult to detect the soft component. Secondly, theHR2 − σHR2 > −0.3 selection criterion will exclude ob-jects from the sample if the soft component is too strong.For a typical source with Γ = 1.9, log NH = 22.5 andσHR2 = 0.15, the strength of soft component that will re-move it from the sample declines from 16 per cent of theprimary power law at z = 0.3 to only 7 percent at z = 0.6.Thus a soft excess is simultaneously more difficult to de-tect, and more likely to violate our selection criterion, atz > 0.3. The upper panel of Fig. 8 shows the 0.5-2 keVluminosities of the soft components in these 7 objects asa function of redshift, based on the model with a power-law soft component. The soft component luminosities, likethe primary emission, appear to be highly correlated withredshift. This may itself be a selection effect related toour ability to detect the soft component in the presence ofthe primary absorbed power law. The most powerful softcomponent of the 7 sources has a 0.5-2 keV luminosity of∼ 2 × 1042 erg s−1, but this is a ‘tentative’ soft compo-nent as the spectrum of XMM J021908.37 − 044731.4 canalso be modelled with an ionised absorber; of the 4 securedetections of the soft component, the most powerful hasa luminosity of ∼ 3 × 1041 erg s−1. In the lower panel ofFig. 8 we show the ratios of the soft component flux tothe intrinsic (i.e. unabsorbed) flux of the primary powerlaw component. We also show the upper limits for softcomponent contributions for the NELGs in which no softcomponent is detected. All of the secure soft componentdetections have luminosities equivalent to less than 10%that of the primary power law, and more than half of theupper limits are also below this level. Only 1 tentativelydetected soft component has a luminosity >10% of theprimary power law.
In the XMM-Newton performance-verification ob-servations of the Lockman Hole, Mainieri et al. (2002)find only one source that requires a soft component su-perimposed on a heavily absorbed primary power law.This object (#50 in Mainieri et al. 2002, and #901 inLehmann et al., 2001) has similar properties to the ob-jects in our sample that show an additional soft compo-nent: narrow optical emission lines, z = 0.204 and L2−10 ∼1043 erg s−1. In the 13H Deep Field, Page et al. (2006b)also find one absorbed source (#100), with convincingevidence for an additional soft component. This sourcehas narrow emission lines, z = 0.27 and L2−10 = 4 ×1042 erg s−1. Caccianiga et al. (2004) find 3 heavily ab-sorbed objects which require additional soft componentsamong their sample of serendipitous 4.5-7.5 keV selectedXMM-Newton sources. Again, all have narrow opticalemission lines, z < 0.3, and L2−10 < 3 × 1043 erg s−1.
M star
Figure 7. 1′×1′ r band image of XMM J104444.50−013313.5.The black circle is a 6′′ radius circle centred on the X-ray sourceposition. The brigher counterpart is the M star for which wehave an optical spectrum. The fainter counterpart is closer tothe centre of the circle and thus to the X-ray source position.
However, Mateos et al. (2005b) find 3 heavily absorbednarrow-line AGN in the very deep XMM-Newton obser-vations of the Lockman Hole, which have 0.7 < z < 0.8and 3 × 1043 erg s−1 < L2−10 < 1044 erg s−1, and whichrequire additional soft components. The soft component0.5-2 keV luminosities are < 2 × 1042 erg cm−2 s−1 in all3 cases, similar to the soft component luminosities foundin our sample.
Our results are in stark contrast to the soft X-rayproperties reported for absorbed sources in the BEP-
POSAX HELLAS survey: Vignali et al. (2001) find thatadditional soft components, equivalent to between 25%and 65% of the primary unabsorbed power law emis-sion, are required in 6/12 heavily absorbed (NH > 5 ×1022 cm−2) broad-line sources. However, as we have al-ready discussed, the HR2 selection criterion will excludeobjects with very strong soft components from our sam-ple, and a typical source at z = 0.3 with NH = 3 ×1022 cm−2, will only be selected in our sample for asoft component equivalent to < 16 per cent of the pri-mary emission. Nonetheless, it is hard to explain suchpowerful soft components, equivalent to greater than 25percent of the primary emission, in terms of scatteredemission (see Section 6.6). One possibility is that theseHELLAS broad line AGN actually posess ionised ab-sorbers, which in the hardness ratio analysis performedby Vignali et al. (2001), could not be distinguished fromcold absorption and a strong soft component, as would bethe case for XMM J080625.35+244326.0 in our sample.For NELGs, Vignali et al. (2001) report that 2 absorbedHELLAS objects with narrow emission lines showed evi-dence for additional soft X-ray components, equivalent to5% and 35% of the primary power law emission. Whilethe HELLAS source with a soft component equivalent to
c© 0000 RAS, MNRAS 000, 000–000
The XMM-SSC survey of hard-spectrum XMM-Newton sources 1: optically bright sources 17
XMM J005609
-012407.4
-012641.7
XMM J021908.37-044731.4
XMM J021939.22
XMM J005601.36
-051133.7
-012655.3
XMM J083139.11+524206.2
XMM J090524.00+621114.2
XMM J022322.12
XMM J094239.79+465005.3
XMM J094527.16-083309.4
XMM J095231.84-015016.1
XMM J095539.24+411727.3
XMM J104444.50-013313.5
-045738.1
XMM J080625.35+244326.0
XMM J094454.24-083953.6
XMM J104441.90
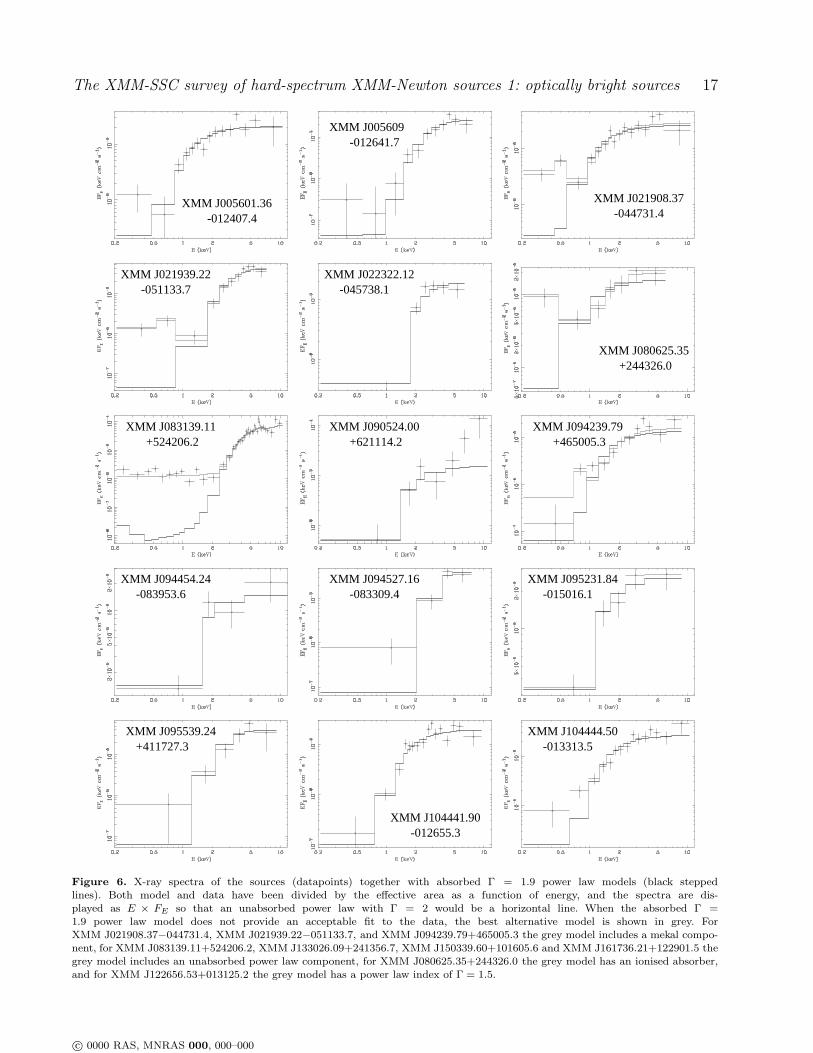
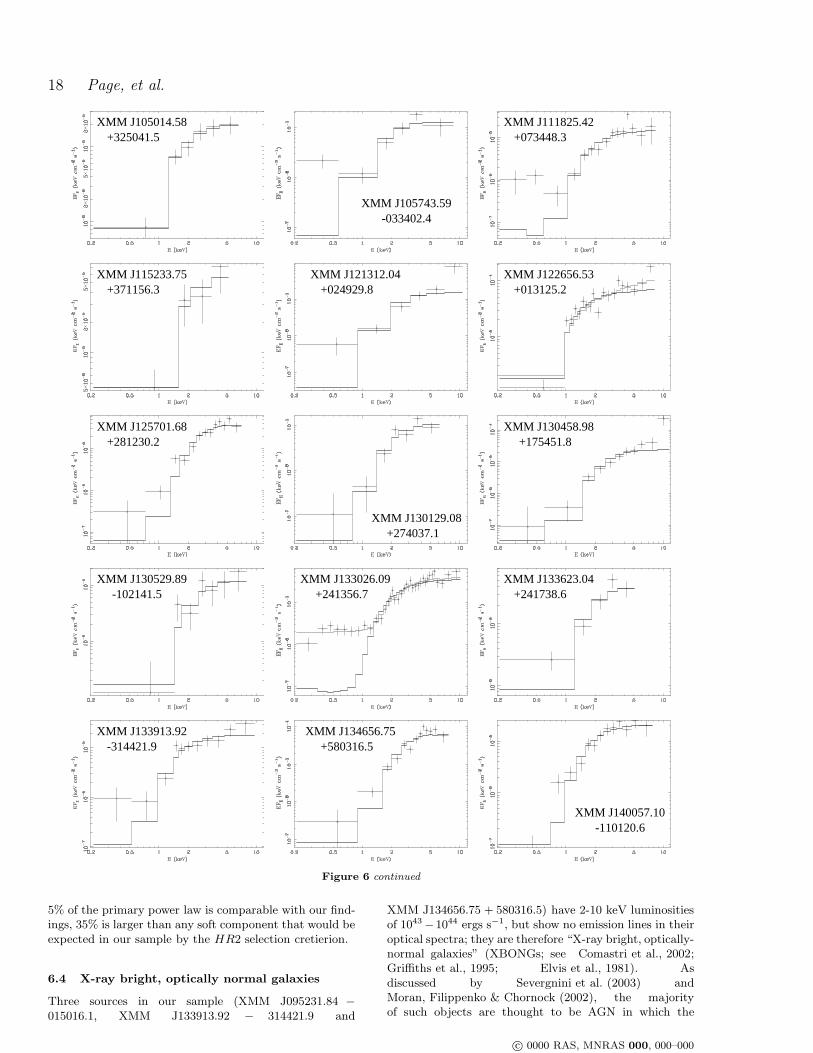
Figure 6. X-ray spectra of the sources (datapoints) together with absorbed Γ = 1.9 power law models (black steppedlines). Both model and data have been divided by the effective area as a function of energy, and the spectra are dis-played as E × FE so that an unabsorbed power law with Γ = 2 would be a horizontal line. When the absorbed Γ =1.9 power law model does not provide an acceptable fit to the data, the best alternative model is shown in grey. ForXMM J021908.37−044731.4, XMM J021939.22−051133.7, and XMM J094239.79+465005.3 the grey model includes a mekal compo-nent, for XMM J083139.11+524206.2, XMM J133026.09+241356.7, XMM J150339.60+101605.6 and XMM J161736.21+122901.5 thegrey model includes an unabsorbed power law component, for XMM J080625.35+244326.0 the grey model has an ionised absorber,and for XMM J122656.53+013125.2 the grey model has a power law index of Γ = 1.5.
c© 0000 RAS, MNRAS 000, 000–000
18 Page, et al.
-102141.5XMM J133026.09
+241356.7
XMM J133913.92-314421.9
-033402.4
XMM J130529.89
XMM J105743.59
XMM J140057.10
XMM J105014.58 XMM J111825.42+073448.3+325041.5
XMM J115233.75+371156.3
XMM J121312.04+024929.8
XMM J122656.53+013125.2
XMM J130458.98+175451.8
XMM J125701.68+281230.2
XMM J133623.04+241738.6
XMM J134656.75+580316.5
XMM J130129.08+274037.1
-110120.6
Figure 6 continued
5% of the primary power law is comparable with our find-ings, 35% is larger than any soft component that would beexpected in our sample by the HR2 selection cretierion.
6.4 X-ray bright, optically normal galaxies
Three sources in our sample (XMM J095231.84 −015016.1, XMM J133913.92 − 314421.9 and
XMM J134656.75 + 580316.5) have 2-10 keV luminositiesof 1043 −1044 ergs s−1, but show no emission lines in theiroptical spectra; they are therefore “X-ray bright, optically-normal galaxies” (XBONGs; see Comastri et al., 2002;Griffiths et al., 1995; Elvis et al., 1981). Asdiscussed by Severgnini et al. (2003) andMoran, Filippenko & Chornock (2002), the majorityof such objects are thought to be AGN in which the
c© 0000 RAS, MNRAS 000, 000–000
The XMM-SSC survey of hard-spectrum XMM-Newton sources 1: optically bright sources 19
+101605.6
XMM J161736.21+122901.5
XMM J140149.53-111647.8
XMM J150339.60
XMM J152254.63
XMM J145048.99
+074534.5
XMM J161818.95+124110.3
+122015.1XMM J161646.54
+070907.3XMM J151650.30
+073113.9XMM J152146.64
+014104.2XMM J150558.42
+025334.6XMM J140145.11
+113329.2XMM J141634.78
+191431.2
Figure 6 continued
emission lines are undetectable against the host galaxystarlight except in high signal to noise observationswith subarcsecond spatial resolution. As discussed inPage et al. (2003) and Severgnini et al. (2003), bothabsorbed and unabsorbed AGN could contribute to theXBONG population. Our three sources are consistentwith the absorbed AGN scenario, as all three showsignificant X-ray absorption.
6.5 Limits on the gas-to-dust ratios in BLAGN
Fig. 9 shows the distribution of absorber NH from thebest fit models as a function of redshift. NH rangesfrom 7 × 1021 cm−2 to 3 × 1023 cm−2, with a mean of3 × 1022 cm−2. The distributions of NH for the BLAGN,NELGs and galaxies are indistinguishable with a KStest. There is no correlation between log NH and red-shift (linear correlation coefficient of −0.05), which is
interesting because the hardness ratio criterion (Equa-tion 2) should select objects with higher column densityat higher redshift and higher luminosities. The paucityof luminous (L2−10 > 1044 erg cm−2 s−1) sources withNH > 1023 cm−2 in the sample implies either that suchsources are rare, or that the optical limits have excludedthese objects from the sample.
It is rewarding to compare our sample withthe sample of ROSAT sources presented inPage, Mittaz & Carrera (2001), which is also a hard-spectrum, X-ray colour selected sample, has a 0.5-2 keVflux limit which is similar to our 2-4.5 keV flux limit,and has a similar optical magnitude limit to the samplepresented here. Our XMM-Newton sample is selected athigher energies, so that at any given redshift it selectsobjects with higher column densities than the ROSAT
sample. Whereas our XMM-Newton sample containsno objects at z > 1, almost a quarter of the ROSAT
c© 0000 RAS, MNRAS 000, 000–000
20 Page, et al.
Figure 8. Top panel: 0.5-2 keV luminosities of the soft compo-nents (based on the power law model) for the 7 NELGs with aspectrum more complex than an absorbed power law. The filledsymbols indicate those NELGs for which acceptable fits wereonly found with an additional soft component (i.e. solid detec-tions of the soft component), while the open symbols indicatethose objects for which acceptable fits could also be found withan ionised absorber instead of a soft component (i.e. tentativedetections of the soft component). Bottom panel: ratios of thesoft (unabsorbed) power law normalisation to that of the pri-mary (absorbed) power law, for the NELGs. Filled and opentriangles indicate the same objects as in the top panel, whileupper limits are given for those objects that could be fittedwith the absorbed power law model (see Table 3).
sample (14/62 objects) have z > 1, all of which areBLAGN with 21.4 < log NH < 22.6; most of them showlittle attenuation by dust in their ultraviolet spectraand have R < 21 (e.g. Page, Mittaz & Carrera, 2000).At z > 1 the flux limits and X-ray colour selection ofour survey mean that it is most sensitive to AGN with23 < log NH < 23.5. Therefore the lack of BLAGN withNH > 1023 cm−2, and the absence of any objects at z > 1in our R < 21 XMM-Newton sample implies that BLAGNwith NH > 1023 cm−2, but without significant attenuation
in the UV, are rare. Assuming that this is because of ex-tinction in the optical/UV, we can estimate the maximumeffective gas-to-dust ratio6 which is found in our X-rayabsorbed AGN sample as follows. To have been extin-guished beyond the optical limits of the sample (R = 21),BLAGN at z ∼ 1 would have to be attenuated by more
6 The Galactic gas-to-dust ratio which would produce equiva-lent UV extinction for the X-ray derived cold column density.
Figure 9. Column densities of the sample as a function ofredshift.
than 1 magnitude at 3500 A (restframe) compared tothe ROSAT sample of Page, Mittaz & Carrera (2001) inwhich all but two BLAGN have R < 20. This would beequivalent to an extinction of E(B−V ) = 0.2 for Galacticdust(Rieke & Lebofsky, 1985), which would correspondto NH ∼ 1021 cm−2 for a Galactic gas-to-dust ratio(Bohlin, Savage & Drake, 1978). Thus we should observeBLAGN with z > 1 and NH > 1023 cm−2 in our sampleif they have effective gas-to-dust ratios ≥ 100× Galactic.Since we do not observe such sources, we infer thatBLAGN with effective gas-to-dust ratios ≥ 100× Galacticare absent from our sample.
The space density of z > 1 X-ray absorbed BLAGNwith 21.4 < log NH < 22.6 is ∼10% the space den-sity of unobscured BLAGN (Akiyama et al., 2000;Mainieri et al., 2002; Page et al., 2004;Perola et al., 2004; Silverman et al., 2005;Page et al., 2006b). The lack of BLAGN with23 < log NH < 23.5 in our XMM-Newton sample(at higher energies than the ROSAT sample, but with asimilar limiting flux) implies that such objects have aneven smaller space density, equivalent to no more than afew percent of the unobscured population. It is interestingto compare this to the space density of broad absorptionline (BAL) QSOs, which make up ∼ 15% of the opticalQSO population in the redshift interval (1.7 < z < 3.5)where the BALs can be detected (Reichard et al., 2003),and approximately half of which have NH > 1023 cm−2
(Gallagher et al., 2002). BALQSOs are the only subset ofthe optically-selected BLAGN population which appear
c© 0000 RAS, MNRAS 000, 000–000
The XMM-SSC survey of hard-spectrum XMM-Newton sources 1: optically bright sources 21
to have effective gas-to-dust ratios ∼ 100×Galactic(Maiolino et al., 2001), showing both strong UV emissionand large X-ray column densities. The limits from oursurvey imply that BALQSOs will also form the majorityof BLAGN with extreme gas-to-dust ratios amongst theX-ray selected population.
6.6 Implications for the AGN population and
geometric unification
The phenomonology of X-ray absorbed AGN is an im-portant test of the AGN unification scheme, which pos-tulates that AGN are surrounded by a dense obscuringtorus of dust and gas (Antonucci, 1993), or optically thickmaterial associated with the outer accretion disc (e.g.Elitzur & Shlosman, 2006), and therefore the X-ray andoptical absorption properties of AGN are primarily deter-mined by their orientation with respect to the observer.Overall, the results found here and elsewhere are in broadagreement with this unification scheme, because the ma-jority of the sources that show significant X-ray absorption(i.e. NH > 1022 cm−2) are NELGs, and so have opticalproperties consistent with an edge-on perspective, namelynarrow emission lines and absent or highly-attenuated nu-clear UV/optical continua. From the X-ray spectra of 31such NELGs presented earlier, there are 4 secure detec-tions of an additional soft component which is equivalentto between 2 and 7 per cent of the primary, absorbed,emission. In addition, there are 3 tentative detections,and for most of the sources the upper limits do not ruleout a soft component equivalent to several per cent ofthe primary emission. The secure detection rate alone im-plies that such components are present in > 4% of thepopulation (at 95% confidence, based on the estimatorsof Gehrels, 1986). Thus a non-negligible fraction of theseheavily absorbed, narrow-line objects show an additionalcomponent of soft X-ray emission that apparently escapesthe obscuring torus.
In the context of the unified scheme, some soft X-ray emission is expected to arise from obscured AGN inthe form of X-rays that are reprocessed or scattered inthe ionisation cones of the AGN. In such a geometry,the amount of soft X-ray radiation that can be directedinto our line of sight depends on the opening angle of thetorus, and the fraction of the soft X-ray emission that isabsorbed or scattered in the ionisation cones. Assumingthat the torus covers 80% of the sky, as inferred in opticaland X-ray studies of local AGN (Maiolino & Rieke, 1995;Risaliti, Maiolino & Salvati, 1999), and that the radiationthat is intercepted within the ionisation cones is scatteredor re-emitted isotropically (so that half is directed backtowards the torus), then the luminosity of the scatteredcomponent will be 10 per cent of the luminosity that wasabsorbed or scattered within the ionisation cone. Thus toproduce a soft component equivalent to 5 percent of theprimary power law requires that ∼ half of the soft X-raysare absorbed or scattered within the ionisation cone. Forsuch a large fraction of the soft X-ray radiation to be in-tercepted within the ionisation cone implies that the conemust contain an ionised absorber with a large column den-sity.
Thus within the context of the unified scheme, the
fraction of absorbed, narrow line objects that show anadditional soft component, equivalent to several per centof the primary emission, should be matched by (at least)the same fraction (i.e. > 4 per cent) of broad line objectsdisplaying significant absorption (≥ 50 per cent) of theirsoft X-rays from an ionised absorber. Note that this is alower limit to the fraction of heavily absorbed broad lineobjects, since ionised absorption close to the base of theionisation cone will not redirect X-rays over the edge ofthe torus.
While many Seyfert 1s in the local Universe haveionised absorbers (Reynolds, 1997; George et al., 1998;Blustin et al., 2005), only a few nearby objects suchas NGC3783 (Blustin et al., 2002; Netzer et al., 2003;Krongold et al., 2003; Behar et al., 2003) and H 0557-385(Ashton et al., 2006) are known to absorb more thanhalf of the incident soft X-ray emission. Nonetheless,the presence of these 2 objects within the 19 BLAGNin the Piccinotti et al. (1982) sample is consistent withour expectation of > 4 per cent. For more distantobjects, the fraction of BLAGN with heavy soft X-rayabsorption is ∼ 10 per cent (Akiyama et al., 2000;Mainieri et al., 2002; Page et al., 2004;Perola et al., 2004; Silverman et al., 2005;Page et al., 2006b). This is compatible with our findingsfor the NELGs provided that > 40 per cent of theseX-ray absorbed BLAGN are viewed pole-on and harbourhigh-opacity ionised absorbers, so that > 4 per centof all BLAGN have this property. Evidence that thiscould be the case is building up: within the samplepresented here an ionised absorber provides the bestfit to the spectrum of XMM J080625.35 + 244326.0,and examples of X-ray absorbed BLAGN whichrequire ionised absorbers have also been foundby Piconcelli et al. (2002), Page et al. (2006a), andPage et al. (2006b). Objects classified as “soft X-rayweak quasars” (Brand, Laor & Wills, 2000) also appearto be BLAGN with substantial soft X-ray absorption, andthe absorbers in a significant fraction of these are alsofound to be ionised (Schartel et al., 2005). These resultsindicate that within the context of the unified scheme,the current limits on the scattered components in narrowline objects are compatible with the numbers of X-rayabsorbed broad line objects.
Finally, it is worth asking how the three galaxies with-out discernable optical emission lines fit within this pic-ture. In our sample, they are outnumbered ∼10:1 by theNELGs, and so are a minority of the absorbed AGN pop-ulation. In trying to fit these objects with the unifiedscheme, we can envisage four possible hypotheses for theapparent weakness of their optical emission lines: (i) theAGN are so weak compared to the host galaxies that theemission lines are undetectable against the bright galaxycontinua, (ii) the tori in these objects have covering fac-tors approaching unity, (iii) their narrow line regions arethemselves obscured, or (iv) the gas in their narrow lineregions is so tenuous as to make the optical emission linesanomalously weak. Hypothesis (i) can be ruled out im-mediately: their optical to X-ray flux ratios lie within 0.5dex of the fX/fR = 1 line shown in Fig. 2, and are in-distinguishable from those of the NELGs. In all the re-maining possibilities, the fraction of soft X-rays that can
c© 0000 RAS, MNRAS 000, 000–000
22 Page, et al.
be reprocessed and redirected into our line of sight shouldbe negligible, and so significant soft X-ray components intheir X-ray spectra would be inconsistent with the unifiedscheme. Soft components are not detected in any of the 3,as expected from the unified scheme.
7 CONCLUSIONS
We have defined the XMM-SSC survey of hard-spectrumXMM-Newton sources, and presented optical and X-rayspectra for an optically-bright (r < 21) sample of 42sources. We find that our hardness ratio selection crite-rion provides a very clean sample of X-ray absorbed AGN,in agreement with the findings of Caccianiga et al. (2004)and Della Ceca et al. (2004). Every source in the opticallybright sample is an AGN with 21.8 < log NH < 23.4, withthe possible exception of one source. This source has anoptical counterpart which is a Galactic M star, but weargue that a fainter optical counterpart, closer to the X-ray source position, is more likely to be the correct opticalcounterpart. Most (36/42) of the sources have X-ray lumi-nosities characteristic of Seyferts (1042 erg s−1 < L2−10 <1044 erg s−1). The majority of the sources (31/42) showonly narrow emission lines (FWHM < 1000 kms−1) intheir optical spectra, although a small number (7) of thesources also show broad emission lines, and 3 sources haveno detectable emission lines in their optical spectra. Noneof the sources have z > 1. The lack of broad line AGNat higher redshifts, luminosities and column densities im-plies that the effective gas-to-dust ratio in AGN absorbersrarely exceeds 100× Galactic, and it is unlikely that morethan a few percent of broad line AGN have X-ray columndensities of cold gas which are > 1023 cm−2. In 7 of the31 NELGs an absorbed power law is unable to fit the X-ray spectrum satisfactorily; an additional soft componentprovides acceptable fits for these objects. In our sample,these soft components are only observed in narrow emis-sion line objects which are relatively nearby (z < 0.3) andhave low-moderate luminosity (L2−10 < 3×1043 erg s−1).These soft components are a natural consequence of theAGN unified scheme if they are soft X-rays that have beenabsorbed and re-emitted within the narrow line region.This would require that > 4 per cent of broad line AGNhave ionised absorbers with > 50 per cent opacity to softX-rays, indicating that a substantial fraction of X-ray ab-sorbed broad-line AGN have ionised absorbers.
8 ACKNOWLEDGMENTS
Based on observations obtained with XMM-Newton, anESA science mission with instruments and contributionsdirectly funded by ESA Member States and NASA. Thisresearch was also based on observations made at theWilliam Herschel Telescope which is operated on the is-land of La Palma by the Isaac Newton Group in the Span-ish Observatorio del Roque de los Muchachos of the In-stituto de Astrofisica de Canarias, and on observationscollected at the European Southern Observatory, Chile,ESO No. 71.A-0444. This research has made use of the
NASA/IPAC Extragalactic Database (NED) which is op-erated by the Jet Propulsion Laboratory, California In-stitute of Technology, under contract with the NationalAeronautics and Space Administration. This research hasmade use of data obtained from the SuperCOSMOS Sci-ence Archive, prepared and hosted by the Wide Field As-tronomy Unit, Institute for Astronomy, University of Ed-inburgh, which is funded by the UK Particle Physics andAstronomy Research Council. FJC acknowledges financialsupport from the Spanish Ministerio de Educacion Cien-cia, under projectw ESP2003-00812 and ESP2006-13608-C02-01. RDC and PS acknowledge partial financial sup-port by hte MIUR (Cofin-03-02-23) and INAF. We thankNatalie Webb for useful comments.
REFERENCES
Ashton C.E., Page M.J., Branduardi-Raymont G.,Blustin A.J., 2006, MNRAS, 366, 521
Akiyama M., et al., 2000, ApJ, 532, 700Alexander D.M., et al., 2003, AJ, 126, 239Antonucci R., 1993, ARA&A, 31, 473Barcons X., et al., 2002, A&A, 382, 522Barcons X., Carrera F.J., Ceballos M.T., 2003, MNRAS,339, 757
Barcons X., Carrera F.J., Ceballos M.T., Mateos S., PageM.J., Perez-Fournon I., Watson M.G., 2003, AN, 324,44
Barcons X., et al., 2007, A&A, submittedBarger A.J., et al., 2002, AJ, 124, 1839Barger A.J., et al., 2003, AJ, 126, 632Barr P., White N.E., Sanford P.W. & Ives J.C., 1977,MNRAS, 181, 43P
Bauer F.E., Alexander D.M., Brandt W.N., SchneiderD.P., Treister E., Hornschemeier A.E., Garmire G.P.,2004, AJ, 128, 2048
Becker R.H., White R.L. & Helfand D.J., 1995, ApJ, 450,559
Behar E., Rasmussen A.P., Blustin A.J., Sako M., KahnS.M., Kaastra J.S., Branduardi-Raymont G., Steen-brugge K.C., 2003, ApJ, 598, 232
Blustin A.J., Branduardi-Raymont G., Behar E., KaastraJ.S., Kahn S.M., Page M.J., Sako M., Steenbrugge K.C.,2002, A&A, 392, 453
Blustin A.J., Page M.J., Fuerst S.V., Branduardi-Raymont G., Ashton C.E., 2005, A&A, 431, 111
Bohlin R.C., Savage B.D. & Drake J.F., 1978, ApJ, 224,132
Boller Th., et al., 2003, A&A, 397, 557Brandt W.N., Laor A., & Wills B.J., 2000, 2005, A&A,433, 455
Brandt W.N., et al., 2001, AJ, 122, 2810Brinkman A.C., Kaastra J.S., van der Meer R.L.J.,Kinkhabwala A., Behar E., Kahn S.M., Paerels F.B.S.,Sako M., 2002, A&A, 396, 761
Caccianiga A., et al., 2004, A&A, 416, 901Carrera F.J., Page M.J., Mittaz J.P.D., 2004, A&A, 420,163
Comastri A., Setti, G., Zamorani, G., & Hasinger, G.,1995, A&A, 296, 1
Comastri A., et al., 2002, ApJ, 571, 771
c© 0000 RAS, MNRAS 000, 000–000
The XMM-SSC survey of hard-spectrum XMM-Newton sources 1: optically bright sources 23
Condon J.J., Cotton W.D., Greisen E.W., Yin Q.F., Per-ley R.A., Taylor G.B., Broderick J.J., 1998, AJ, 115,1693
Cowie L.L., et al., 2003, ApJ, 584, L57Della Ceca R., et al., 2004, A&A, 428, 383Dwelly T., Page M.J., Loaring N.S., Mason K.O.,McHardy I.M., Gunn K.F., Sasseen T., 2005, MNRAS,360, 1426.
Dwelly T. & Page M.J., 2006, MNRAS, 372, 1755Dickey J.M. & Lockman F.J., 1990, ARA&A, 28, 215Elitzur M. & Shlosman I., 2006, ApJ, 648, L101Elvis M., Schreier E.J., Tonry J., Davis M., Huchra J.P.,1981, ApJ, 246, 20
Elvis M., Fiore F., Wilkes B.J., McDowell J.C., BechtoldJ., 1994, ApJ, 422, 60
Elvis M., Marengo M., Karovska M., 2002, ApJ, 567,L107
Fabian A.C., 1999, MNRAS, 308, L39Fabian A.C. & Iwasawa K., 1999, MNRAS, 303, L34Fasano G. & Franceschini A., 1987, MNRAS, 225, 155Fiore F., et al., 2003, A&A, 409, 79Franceschini A., Braito V., Fadda D., 2002, MNRAS,335, L51
Franceschini et al., 2003, MNRAS, 343, 1181Gallagher S.C., Brandt W.N., Chartas G. & GarmireG.P., 2002, ApJ, 567, 37
Gehrels N., 1986, ApJ, 303, 336George I.M., Turner T.J., Netzer H., Nandra K.,Mushotzky R.F., Yaqoob T., 1998, ApJS, 114, 73
Gilli R., Salvati M., Hasinger G., 2001, A&A, 366, 407Giacconi R., et al., 2001, ApJ, 551, 624Griffiths R.E., Georgantopoulos I., Boyle B.J., StewartG.C., Shanks T., della Ceca R., 1995, MNRAS, 275, 77
Hasinger G., et al., 2001, A&A, 365, L45Holt S.S., Mushotzky R.F., Boldt E.A., Serlemitsos P.J.,Becker R.H., Szymkowiak A.E., White N.E., 1980, ApJ,241, L13
Kinkhabwala et al., 2002, ApJ, 575, 732Krongold Y., Nicastro F., Brickhouse N.S., Elvis M.,Liedahl D.A., Mathur S., 2003, ApJ, 597, 832
La Franca F., et al., 2005, ApJ, 635, 864Lawrence A. & Elvis M., 1982, ApJ, 256, 410Lehmann I., et al., 2001, A&A, 371, 833Loaring N.S., Page M.J., Ramsay G., 2003, MNRAS, 345,865
Maccacaro T., Gioia I.M., & Stocke J.T., 1984, ApJ, 283,486
Maccacaro T., Gioia I.M., Wolter A., Zamorani G.,Stocke J.T., 1988, ApJ, 326, 680
Maiolino R., & Rieke G.H., 1995, ApJ, 454, 95Maiolino R., Marconi A., Salvati M., Risaliti G., Sev-ergnini P., Oliva E., La Franca F. & Vanzi L., 2001,A&A, 365, 28
Mainieri V., Bergeron J., Hasinger G., Lehmann I.,Rosati P., Schmidt M., Szokoly G., Della Ceca R., 2002,A&A, 393, 425
Marshall F.E., et al., 1993, ApJ, 405, 168Mateos S., et al., 2005a, A&A, 433, 855Mateos S., Barcons X., Carrera F.J., Ceballos M.T.,Hasinger G., Lehmann I., Fabian A.C., Streblyanska A.,2005b, A&A, 444, 79
McHardy I.M., et al., 2003, MNRAS, 342, 802
Mittaz J.P.D., et al., 1999, MNRAS, 308, 233Moran E.C., Filippenko A.V., Chornock R., 2002, ApJ,579, L71
Mushotzky R.F., 1982, ApJ, 256, 92Netzer H., et al., 2003, ApJ, 599, 933Ogle P.M., Marshall H.L., Lee J.C., Canizares C.R., 2000,ApJ, 545, L81
Osterbrock D.E. & Pogge R.W., 1985, ApJ, 297, 166Page M.J., Mittaz J.P.D. & Carrera F.J., 2000, MNRAS,312, 207
Page M.J., Mittaz J.P.D. & Carrera F.J., 2001, MNRAS,325, 575
Page M.J., Davis S.W., Salvi N.J., 2003, MNRAS, 343,1241
Page M.J., et al., 2003, AN, 324, 101Page M.J., Stevens J.A., Ivison R.J., Carrera F.J., 2004,ApJ, 611, L85
Page M.J., Carrera F.J., Ebrero J., Stevens J.A., IvisionR.J., 2006, in proceedings of ‘The X-ray Universe 2005’,ESA SP-604, 647
Page M.J., et al., 2006, MNRAS, 369, 156Perola G.C., et al., 2004, A&A, 421, 491Piccinotti G., Mushotzky R.F., Boldt E.A., Holt S.S.,Marshall F.E., Serlemitsos P.J., Shafer R.A.,
Piconcelli E., Cappi M., Bassani L., Fiore F., Di CoccoG., Stephen J.B., 2002, A&A, 394, 835
Reichard T.A., et al., 2003, AJ, 126, 2594Reynolds C.S., 1997, MNRAS, 286, 513Rieke G.H. & Lebofsky M.J., 1985, ApJ, 288, 618Risaliti G., Maiolino R. & Salvati M., 1999, ApJ, 522,157
Rosati P., et al., 2002, ApJ, 566, 677Sako Masao., Kahn S.M., Paerels F., Liedahl D.A., 2000,ApJ, 543, L115
Sambruna R.M., Netzer H., Kaspi S., Brandt W.N.,Chartas G., Garmire G.P., Nousek J.A., Weaver K.A.,2001, ApJ, 546, L13
Sanders D.B., Soifer B.T., Elias J.H., Madore B.F.,Matthews K., Neugebauer G., Scoville N.Z., 1988, ApJ,325, 74
Schartel N., Rodrıguez-Pascual P.M., Santos-Lleo M.,Clavel J., Guainazzi M., Jimınez-Bailon E., PiconcelliE., 2005, A&A, 433, 455
Schurch N.J., Warwick R.S., Griffiths R.E., Kahn S.M.,2004, MNRAS, 350, 1
Severgnini P., et al., 2003, A&A, 406, 483Setti G., Woltjer L., 1989, A&A, 224, L21Shuder J.M. & Osterbrock D.E., 1981, ApJ, 250, 55Silverman J.D., et al., 2005, ApJ, 618, 123Steffen A.T., Barger A.J., Cowie L.L., Mushotzky R.F.& Yang Y., 2003, ApJ, 596, L23
Stocke J.T., Morris S.L., Gioia I.M., Maccacaro T.,Schild R., Wolter A., Fleming T.A., Henry J.P., 1991,ApJS, 76, 813
Szokoly G.P., et al., 2004, ApJS, 155, 271Tozzi P., et al., 2006, A&A, 451, 457Turner T.J., George I.M., Nandra K., Mushotzky R.F.,1997, ApJS, 113, 23
Treister E., et al., 2004, ApJ, 616, 123Ueda Y., et al., 2003, ApJ, 598, 886Ueno S., Mushotzky R.F., Koyama K., Iwasawa K.,Awaki H., Hayashi I., 1994, PASJ, 46, L71
c© 0000 RAS, MNRAS 000, 000–000

24 Page, et al.
Vignali C., Comastri A., Fiore F., La Franca F., 2001,A&A, 370, 900
Watson M.G., et al., 2003, AN, 324, 89Worsley M.A., Fabian A.C., Barcons X., Mateos S.,Hasinger G., Brunner H., 2004, MNRAS, 352, L28
c© 0000 RAS, MNRAS 000, 000–000
Recommended


