i
INSTITUTIONAL FACTORS INFLUENCING CUSTOMER SATISFACTION IN
WARID TELECOM VOICE SERVICES
BY
ARMELLA MUKORAKO
11/MMSPPM/25/044
A DISSERTATION SUBMITTED TO THE HIGHER DEGREE DEPARTMENT
IN PARTIAL FULFILLMENT OF THE REQUIREMENTS FOR THE AWARD
OF THE MASTERS DEGREE IN MANAGEMENT STUDIES (PROJECT
PLANNING AND MANAGEMENT) OF UGANDA MANAGEMENT INSTITUTE.
JULY, 2013

ii
DECLARATION
I, ARMELLA MUKORAKO declare that this dissertation is my own original work and has
never been submitted for academic award to any institution of learning or university.
Sign _________________________
Date_________________________

iii
APPROVAL
We hereby approve the dissertation of Ms Armella Mukorako done under our supervision and
submitted for the award of Masters in Management Studies of Uganda Management Institute.
Signed
__________________________________ Date____________________
MR. BEN MUGERWA
Signed
_________________________________ Date _____________________
DR. BENON BASHEKA

iv
DEDICATION
I dedicate this piece of work to my parents Mukorako Georges and Baranyizigiye Salomé who
deserve special thanks for being supportive throughout this project.

v
ACKNOWLEDGEMENT
I extend my sincere gratitude to my supervisors Mr Ben Mugerwa and Dr. Benon Basheka for
their motivation, encouragement and assistance all through the research process. I am grateful for
their guidance and support.
I also thank the entire staff of Warid Telecom and above all the Almighty God who has been
there in times of difficulty and joy. May He bless all those who have been of great help in my
academic carrier and most especially Annet Nsiimire.
vi
TABLE OF CONTENTS
DECLARATION............................................................................................................................II
APPROVAL .................................................................................................................................III
DEDICATION.............................................................................................................................. IV
ACKNOWLEDGEMENT............................................................................................................ V
TABLE OF CONTENTS............................................................................................................. VI
LIST OF FIGURES...................................................................................................................... XI
LIST OF TABLES...................................................................................................................... XII
LIST OF ABBREVIATIONS ....................................................................................................XIV
ABSTRACT.................................................................................................................................XV
CHAPTER ONE………………………………………………………………………………....1
INTRODUCTION ………………………………………………………………………………1
1.1.Introduction…............................................................................................................................1
1.2.Background ...............................................................................................................................1
1.2.1 Historical Background…………………………………………………………………..1
1.2.2 Theoretical Background ………………………………………………………………...3
1.2.3 Conceptual Background ………………………………………………………...............5
1.2.4 Contextual Background ………………………………………………………………...6
1.3.Problem statement .....................................................................................................................8
1.4.Purpose of the study…………………………………………………………………………...9
1.5.Objectives of the study ..............................................................................................................9
1.6.Research questions.....................................................................................................................9
vii
1.7.Hypotheses...............................................................................................................................10
1.8.Conceptual framework ............................................................................................................10
1.9.Significance of the study .........................................................................................................11
1.10. Justification of the study ...................................................................................................11
1.11. Scope of the study..............................................................................................................11
1.12. Operational definitions ......................................................................................................12
CHAPTER TWO…………………………………………………….…………………………12
LITERATURE REVIEW …………………………..…………………………………………12
2.1. Introduction ............................................................................................................................13
2.2. Theoretical Review ...............................................................................................................13
2.3. Customer satisfaction .............................................................................................................14
2.4. Reliability of the network and customer satisfaction .............................................................17
2.5. Billing and customer satisfaction ...........................................................................................18
2.6. Complaints resolution and customer satisfaction ..................................................................19
2.7. Summary of the literature ......................................................................................................20
CHAPTER THREE ……………………………………………………………………………21
METHODOLOGY …………………………………………………………………………….21
3.1. Introduction ............................................................................................................................22
3.2. Research Design ....................................................................................................................22
viii
3.3.Study Population.... .................................................................................................................22
3.4.Sample size and selection........................................................................................................22
3.5.Sampling techniques and procedure .......................................................................................22
3.6.Data collection methods..........................................................................................................23
3.7. Data collection instruments ...................................................................................................23
3.8. Quality control........................................................................................................................24
3.8.1 Validity...........................................................................................................................24
3.8.2 Reliability.......................................................................................................................25
3.9. Procedure for data collection..................................................................................................26
3.10. Data analysis .....................................................................................................................26
3.10.1. Qualitative data analysis……………………………………………...………….26
3.10.2. Quantitative data analysis…………………………………………….………….26
3.11. Measurement of variables ................................................................................................27
CHAPTER FOUR ……………………………………………………………………………..28
PRESENTATION, ANALYSIS & INTERPRETATION OF FINDINGS…………………28
4.1. Introduction ............................................................................................................................28
4.2. Response rate .........................................................................................................................28
4.3. Demographic characteristics…………... ...............................................................................28
4.3.1 Age composition…………………………………………………………………...29
4.3.2 Occupation ………………………………………………………………………...30
4.4. Empirical findings ..................................................................................................................31
ix
4.4.1 Reliability of the network and customer satisfaction……………………...............31
4.4.2 Billing and customer satisfaction…………………………………………………..36
4.4.3 Complaints resolution and customer satisfaction………………………………….41
4.4.4 Summary of Hypothesis results………………………………………………………..50
CHAPTER FIVE …………………………………………………………………………………...51
SUMMARY, DISCUSSION, CONCLUSION AND RECOMMENDATIONS ………………...51
5.1. Introduction.............................................................................................................................51
5.2. Summary of the findings ........................................................................................................51
5.2.1 Reliability of the network and customer satisfaction………………………………51
5.2.2 Billing and customer satisfaction…………………………………………………..52
5.2.3 Complaints resolution and customer satisfaction………………………………….52
5.3. Discussion .........................................................................................................................53
5.3.1 Reliability of the network and customer satisfaction………………………………53
5.3.2 Billing and customer satisfaction…………………………………………………..54
5.3.3 Complaints resolution and customer satisfaction………………………….………55
5.4. Conclusions ...........................................................................................................................55
5.4.1 Reliability of the network and customer satisfaction………………………………56
5.4.2 Billing and customer satisfaction…………………………………………………..56
5.4.3 Complaints resolution and customer satisfaction………………………………….56
x
5.5. Recommendations .................................................................................................................56
5.5.1 Reliability of the network and customer satisfaction………………………………56
5.5.2 Billing and customer satisfaction…………………………………………………..57
5.5.3 Complaints resolution and customer satisfaction……………………………….…57
5.6. Areas of further research........................................................................................................57
REFERENCES ............................................................................................................................58
APPENDIXES …………………………………………………………………………………64
Appendix I: Questionnaire for WTU users ..................................................................................64
Appendix II: Interview guide for WTU users ...............................................................................67
Appendix III: Interview guide for WTU managers ......................................................................69
Appendix IV: Field Research letter ………….………………………………………………….70

xi
LIST OF FIGURES
Figure1: American Customer Satisfaction Model...........................................................................4
Figure 2: Conceptual framework...................................................................................................10
xii
LIST OF TABLES
Table 1: Sample size and selection methods………………………………………………………………23
Table 2: Reliability of research instruments………………………………………………………………27
Table 3: Age of respondents (prepaid customers)………………………………………………………...29
Table 4: Age of respondents (postpaid customers)………………………………………………………..29
Table 5: Occupation of respondents (prepaid customers)…………………………………………………30
Table 6: Occupation of respondents (postpaid customers)………………………………………………..30
Table 7: Responses on network reliability (prepaid customers)………….…………….............................32
Table 8: Responses on network reliability (postpaid customers)……………….……………...................33
Table 9: Correlations between network and customer satisfaction (prepaid customers)……......………..34
Table 10: Correlations between network and customer satisfaction (postpaid customers)….................... 34
Table 11: Regression analysis between network and customer satisfaction (prepaid customers)……...…35
Table 12: Regression analysis between network and customer satisfaction (postpaid customers)……….35
Table 13: Responses on billing (prepaid customers)……….……………..................................................36
Table 14: Responses on billing (postpaid customers)……………….…………….....................................37
Table 15: Correlations between billing and customer satisfaction (prepaid customers)….........................38
Table 16: Correlations between billing and customer satisfaction (postpaid customers)….......................38
Table 17: Regression analysis between billing and customer satisfaction (prepaid customers)…………..39
Table 18: Regression analysis between billing and customer satisfaction (postpaid customers)…………39
Table 19: Responses on complaints resolution (prepaid customers)…..................................…………….40
Table 20: Responses on complaints resolution (postpaid customers)…......... …………............................41
Table 21: Correlations between complaints and customer satisfaction (prepaid customers)......................42
Table 22: Correlations between complaints and customer satisfaction (postpaid customers)…………….43
Table 23: Regression analysis between complaints and customer satisfaction (prepaid customers)……..44
Table 24: Regression analysis between complaints and customer satisfaction (postpaid customers)…….44
Table 25: Correlations matrix on all variables (prepaid customers)…...........................................……… 45

xiii
Table 26: Correlations matrix on all variables (postpaid customers)…………..........................................46
Table 27: Regression output on all variables (prepaid customers)….......... ……………………………...47
Table 28: Regression output on all variables (postpaid customers)…..........…………...............................49
xiv
LIST OF ABBREVIATIONS
ACSI: American Customer Satisfaction Index
GSM: Global System for Mobile Communications
MTN: Mobile Telephone Networks
PQ: Perceived Quantity
PV: Perceived Value
RDC: Resource Development Centre
UCC: Uganda Communications Commission
UPTC: Uganda Posts and Telecommunications Corporation
UTL: Uganda Telecommunications Limited
WTU: Warid Telecom Uganda
ITU: International Telecommunication Union
xv
ABSTRACT
The study investigated the institutional factors influencing customer satisfaction in Warid
Telecom Uganda Voice Services. It was guided by the following objectives; to examine to which
extent reliability of network affects customer satisfaction, to find out how billing affects
customer satisfaction and to examine how complaints resolution influences customer
satisfaction. The study used cross sectional survey design where both qualitative and quantitative
approaches were used. The sample size (N=384) consisted of subscribers of Warid telecom of
which 38 were postpaid while 346 were prepaid users. Data was collected through questionnaires
and interviews. Pearson’s correlation coefficient analysis was used for analyzing the hypotheses
and results obtained showed a statistically significant positive relationship between the
independent variables (the network reliability, billing, complaints resolution) and the dependent
variable (customer satisfaction). Network reliability was found lacking. Billing was revealed to
be reasonable due to the many promotions however it influences satisfaction of prepaid users to a
very small extent while postpaid users were found to be less concerned about billing. Complaints
resolution process was identified to be an area that satisfies mostly postpaid users. The study
concludes that the reliability of network, billing and complaints handling influence customer
satisfaction. It is recommended that further research be conducted to reveal more factors
influencing customer satisfaction because of the weak strength of relationships between the
independent and dependent variables. Also it is recommended that new capacity sites should be
acquired to improve on the network reliability and that the customer care helpline should be less
congested this can be done by offering multiple lines to callers or by recruiting more agents.
1
CHAPTER ONE
INTRODUCTION
1.1.Introduction
This study investigated the institutional factors influencing customer satisfaction in Warid
Telecom Uganda (WTU). The factors were conceived as the independent variable while
customer satisfaction was the dependent variable. This chapter presents the background of the
study, the problem statement, the purpose of the study, the objectives of the study, the research
questions, the research hypotheses, the scope of the study, the justification and significance of
the study and the definition of terms and concepts.
1.2.Background of the Study
1.2.1 Historical background
The history of telecommunication began with the use of smoke signals and drums in Africa,
America and parts of Asia. In the 1790s, the first fixed telegraph systems emerged in Europe;
however it was not until the 1830s that the first telephone appeared in America. In Africa before
independence, telecommunications networks were developed by the colonial masters mainly to
serve their administrative and economic purposes (ITU, 2003). Telegraphs were used to share
information between the capital and other major towns. In the 90’s, cellular communications
were introduced in Africa and subscriber connections grew rapidly. By 2000, Africa as a
continent had more mobile subscribers than fixed lines and Uganda became the first country in
Africa to have more cellular subscribers than fixed lines and a third in the world after Finland
and Cambodia (ITU, 2003). Until recently in East Africa, telecommunications services providers
2
were state owned, state operated and often monopolistic (Akkas, Ucar et al., 2010) telephone
services in East Africa were shared among Uganda, Kenya and Tanzania. In 1977, Uganda
established its own services namely the Uganda Posts and Telecommunications Corporation
(UPTC). It was a state owned company that had monopoly. The service quality was poor,
finances were not flourishing and there was little innovation (Econ One Research Inc, 2002).
In July 1993, Celtel Uganda was issued a license for provision of telecommunication services in
Uganda. The license was given for a period of 15 years by the Ministry of Works, Housing and
Communications. Celtel Uganda began providing services in 1995 using the Global System for
Mobile Communications (GSM) technology. Despites the start up problems, Celtel Uganda
attracted more than 5,000 customers within three years (www.ucc.co.ug). Aware of the lack of
performance of UPTC, in 1996 the Government decided to divide UPTC into Uganda Post
Limited (UPL) and Uganda Telecommunications Limited (UTL). In 1997, the Communications
Act was promulgated whereby UTL was to be privatized. The telecommunications industry was
open to competition and a regulatory agency; Uganda Communications Commission (UCC) was
established to regulate the sector.
It is in April 1998 that Mobile Telephone Networks (MTN) Limited Uganda was licensed as the
second national operator (www.ucc.co.ug). The parent company is MTN South Africa it’s also
present in Swaziland, Rwanda, and Nigeria. MTN Uganda started operating in October 1998
with fixed lines, mobile, payphone and data services. MTN became quickly popular as it offered
some of the services that were not yet on the market that is; access to information about prices,
weather and exchange rates. Besides voice and data services, MTN introduced Mobile Money
services for users to send and receive money.
3
Starting with 2000, UTL was fully privatized and presently offers voice services (fixed lines and
mobile telephony), data services and mobile money services.
In 2006, Warid Telecom International, an Abu Dhabi based mobile telecommunication firm
providing telephony services in Congo, Pakistan; joined the Ugandan Telecom industry. WARID
Telecom Uganda (WTU) Limited was awarded a Public Infrastructure Provider and Public
Service Provider license in November 2006. The License incorporated Fixed & Mobile
Telephone, Internet, email and International Communication Services. The company was
officially launched in Uganda on 9th January 2008. On 7th February 2008, the commercial
services were launched simultaneously in a number of towns and districts. According to the
Head of Resource Development Centre at WTU, Warid users are estimated to be more than 5
millions as per January 2012; the network covers the whole of Uganda except for the districts of
Kotido and Karamoja.
Warid Telecom as a company emphasises the need to offer the best customer services with the
help of franchises and customer care centres all over the country. These offices are an extension
of WTU. They insure the availability of the products, services and solve the customers’
complaints. The telecom industry in Uganda was later on expanded with more players that is
Orange and Smile.
1.2.2 Theoretical background
This study adopted and modified the American Customer Satisfaction Index (ACSI). The ACSI
model predicts that as both perceived value (PV) and perceived quality (PQ) increase, customer
satisfaction should also increase (Anderson et al., 1994). It is based on the assumptions that
customer satisfaction is caused by some factors such as perceived quality (PQ), perceived value
4
(PV) and expectations of customers. These factors are the antecedents of overall customer
satisfaction. The model also estimates the results when a customer is satisfied or not. These
results of customer satisfaction are consequences factors such as complaints or loyalty of
customer (Johnson et al., 2001). The American Customer Satisfaction Index (ACSI) measures
the customers’ perceptions of quality, value, satisfaction, expectations, complaints and future
loyalty (Zeithmal and Bitner 2003). This theory provides a basis to the research as it identifies
the factors influencing customer satisfaction. ACSI model measures the overall satisfaction and
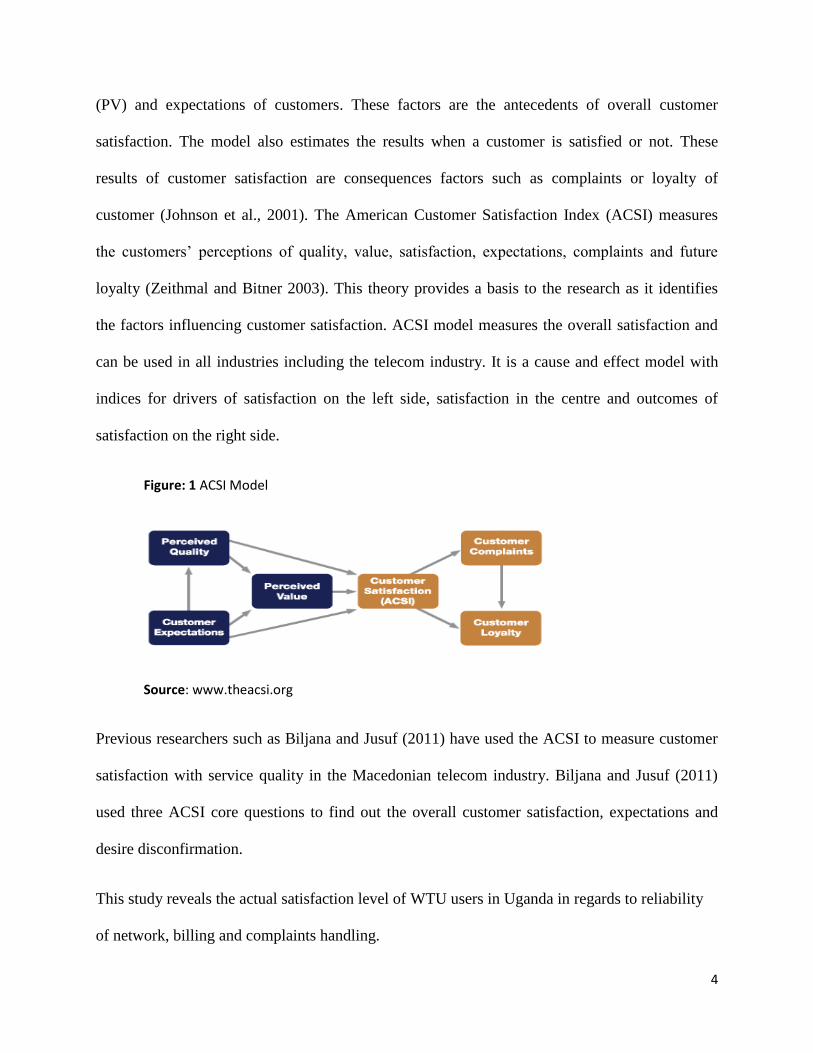
can be used in all industries including the telecom industry. It is a cause and effect model with
indices for drivers of satisfaction on the left side, satisfaction in the centre and outcomes of
satisfaction on the right side.
Figure: 1 ACSI Model
Source: www.theacsi.org
Previous researchers such as Biljana and Jusuf (2011) have used the ACSI to measure customer
satisfaction with service quality in the Macedonian telecom industry. Biljana and Jusuf (2011)
used three ACSI core questions to find out the overall customer satisfaction, expectations and
desire disconfirmation.
This study reveals the actual satisfaction level of WTU users in Uganda in regards to reliability
of network, billing and complaints handling.
5
1.2.3 Conceptual background
In the telecom industry, there are many determinants of customer satisfaction like price, call
quality, perceptions, values, network coverage and network availability (Iqbal et al. 2010). All
the mentioned determinants are secondary but the main factor determining customer satisfaction
is the customer’s own perceptions (Zeithamal & Bitner, 1996).
In this study, the key variables are the factors which are the independent variables and Customer
Satisfaction which is the dependent variable. Customer Satisfaction is the customer’s evaluation
of a product or service in terms of whether that product or service has met their needs and
expectations (Bitner and Zeithaml, 2003). The factors defining customer satisfaction are derived
from the American Customer Satisfaction Index (ACSI) which measures the customers’
perceptions of quality, value, satisfaction, expectations, complaints and future loyalty. However
this research will focus on three measure aspects of the ACSI that is; quality, value and
complaints. These three aspects were selected basing on the customers regular feedback to
Uganda Communications Commission (QoS Snapshot, UCC January 2012).
Quality will imply the reliability of the network and is a parameter of perceived quality. The
Uganda Communications Commission (UCC) defines reliability of the network as the
perceptions of users on network coverage, quality of calls and dropped calls (UCC QoS, April
2007). Therefore those are the indicators assessed under reliability of the network.
Perceived value is described as the customer’s opinion of a product’s worth to him or her. It may
have little or nothing to do with the product’s market price, and depends on the product’s ability
to satisfy his or her needs or requirements (Business Dictionary.com, 2012). In terms of value the
indicators to be evaluated in this study are timeliness and fairness in billing. These were
6
identified through Critical Incident Approach (Flanagan 1954) by UCC (2009), it was
determined that the dimensions of value are fairness and timeliness in billing.
According to JD Power and Associates (2011), expectations are the customers’ anticipations on
the services to be received in terms of reliability, quality and price. It is often influenced by the
customer services received before, during and after purchase of the goods or services (Fornell,
1996). Customer services include attracting the customers, selling to them, insuring maintenance
and technical support during usage. Customer service being a too wide area, this study will focus
on complaints resolution. Complaints resolution is measured in regards to the accessibility of the
help desk, time taken to resolve complaints and the correctness of the information given.
1.2.4 Contextual background
The context of the research is the factors influencing customer satisfaction of Warid Telecom
users, looking at the nature and impact on the satisfaction of customers. The study was
conducted in Uganda whereby the customers of WTU are more or less 3,000,000 (WTU
Resource Development Centre, 2012). WTU mission is to provide simple experiences that
remain attractive enough to keep customers purchasing more, while providing a fun environment
for all Warid employees. According to Akkas, Ucar et al., (2010) customers purchasing more
depend highly on the satisfaction they derive from the product or service. Customer satisfaction
always implies good quality services in fact “in communication services contexts, evaluation of
customer satisfaction is similar to overall evaluation of service quality: a good quality of service
gives better customer satisfaction and bad quality of service leads to dissatisfaction” (UCC June
2011).
7
Uganda Communications Commission (UCC) established parameters to evaluate the quality of
services provided by the different communication companies in the market. The parameters
touch all the aspects of customer satisfaction that is perceived value, perceived quality and
expectations and they include billing, complaints handling and reliability of network and services
(UCC, 2009). In terms of billing UCC looks at the level of accuracy and timeliness in issuing
bills. Warid Telecom has introduced revolutionary tariffs plans such as Pakalast that give a
chance to customers to make calls at lower rates, these new tariffs have contributed to the
popularity of the network. However, the researcher is also interested in establishing whether the
customers are satisfied with the parameters of accuracy and timeliness in billing.
Complaints handling involves quality and timeliness in handling complaints. In this context,
Warid has a set of service centers and a helpline to receive and solve complaints. This research
reveals the extent to which the customers are pleased with the way their complaints are being
attended to.
Reliability of network and services is about insuring network availability at all times, services
should not be interrupted or if they are, they should be restored very fast without
inconveniencing the users. UCC registers a number of complaints in regards to the poor signals
across all the network companies in Uganda, this study establishes the level of satisfaction of
Warid users in regards to the reliability of the network.
Despite the evident efforts of Warid to offer competitive tariffs and avail complaints desks all
over the country, there is still a knowledge gap as to what extent the customers are satisfied and
what elements drive their satisfaction.
8
1.3. Problem Statement
Ideally telecommunication companies are expected to provide satisfactory services to their users.
According to the Uganda Consumer Satisfaction Survey conducted on the overall quality of
services offered by telecommunication companies in Uganda (UCC, June 2009) and the Market
Review (UCC, 2011), voices services are mostly used in Uganda and more than 45% have at
least two simcards from different networks to avoid inconvenience and minimise cost. The
ownership of more than one simcard is a sign that customers are not fully satisfied and therefore
cannot rely on one network. The inconveniences experienced by users range from lack or poor
network causing dropped calls or failure to connect, unresolved complaints and wrong billing of
services (UCC, June 2009).
In 2009 when UCC conducted the survey, Warid Telecom Uganda was only one year old in the
market and was rated by 69% of users as having the best network coverage and 17.2% affirmed
to be satisfied with the voice quality. Four years later, Warid Telecom Uganda (WTU) has grown
in terms of market share though the level at which the users are presently satisfied is not clear. In
May 2012 in Nigeria, after evaluation of the customer satisfaction performance of Telecom
companies, penalties were imposed for poor services. A fine of 2 million dollars for MTN and 1
million dollars for Airtel were paid (BBC, May 2012). If customer satisfaction is not given
priority a similar scenario or worse is likely to occur to Warid Telecom and the Uganda telecom
industry in general. Thus this study evaluated the factors influencing customer satisfaction of
Warid Telecom Uganda voice services users using the parameters of billing, reliability and
complaints resolution and it also measured to what extent they affected the satisfaction of users.
9
1.4.Purpose of the Study
The purpose of the study was to investigate the institutional factors that influence customer
satisfaction in Warid Telecom Uganda Voice Services.
1.5. Objectives of the Study
The objectives included the following;
1 To examine to which extent reliability of network affects customer satisfaction in Warid
Telecom Uganda Voice Services
2 To find out to which extent customer satisfaction affects in Warid Telecom Uganda
Voice Services
3 To examine to which extent complaints resolution influences customer satisfaction in
Warid Telecom Uganda Voice Services
1.6.Research Questions
The following research questions guided the study;
1. To which extent does reliability of network affect customer satisfaction in Warid
Telecom Uganda Voice Services?
2. To which extent does billing affect customer satisfaction in Warid Telecom Uganda
Voice Services?
3. To which extent does complaint resolution influence customer satisfaction in Warid
Telecom Uganda Voice Services?
1.7. Hypotheses
The study was guided by the following hypotheses:
10
1. Reliability of network significantly affects customer satisfaction in Warid Telecom
Uganda Voice Services
2. Billing significantly affects customer satisfaction in Warid Telecom Uganda Voice
Services
3. Complaints resolution significantly influences customer satisfaction in Warid Telecom
Uganda Voice Services
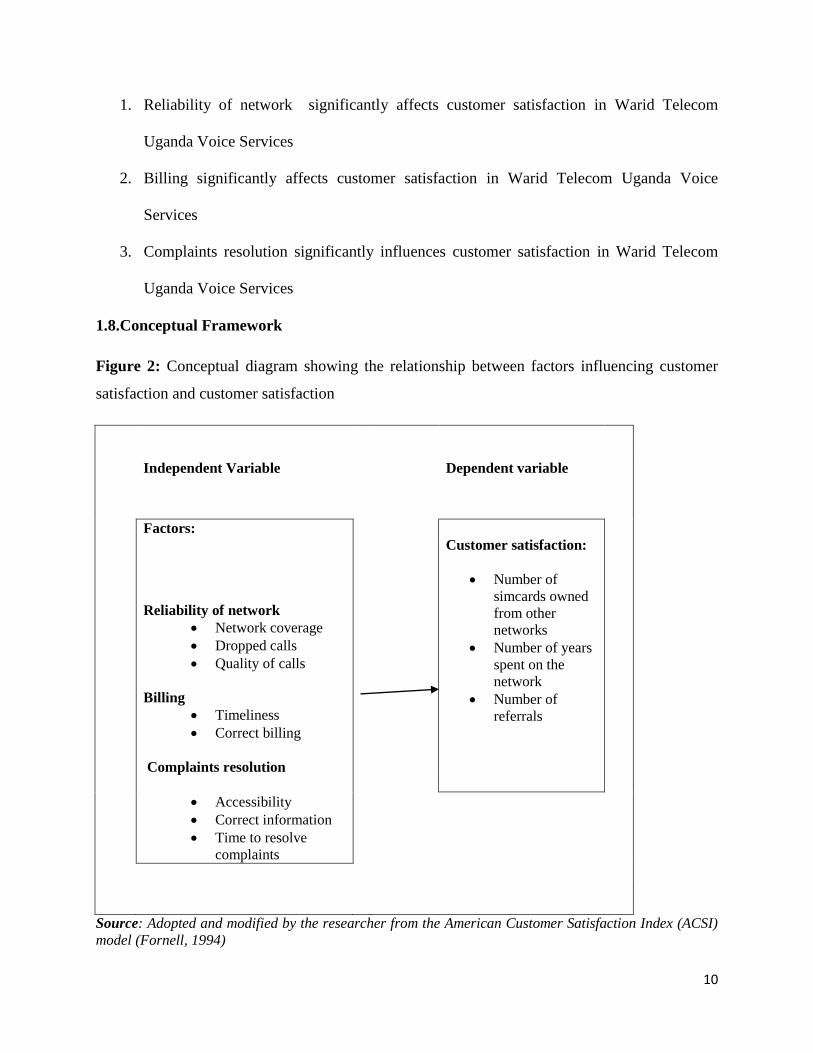
1.8.Conceptual Framework
Figure 2: Conceptual diagram showing the relationship between factors influencing customer
satisfaction and customer satisfaction
Independent Variable
Dependent variable
Factors:
Reliability of network
Network coverage
Dropped calls
Quality of calls
Billing
Timeliness
Correct billing
Complaints resolution
Customer satisfaction:
Number of
simcards owned
from other
networks
Number of years
spent on the
network
Number of
referrals
Accessibility
Correct information
Time to resolve
complaints
Source: Adopted and modified by the researcher from the American Customer Satisfaction Index (ACSI)
model (Fornell, 1994)
11
The above conceptual framework describes the relationship between the variables of the study.
The independent variable of the study is the Factors influencing customer satisfaction with its
variables of network reliability, billing and complaints resolutions. They are studied to establish
how they influence loyalty and referrals among Warid Telecom voice services users.
1.9 Significance of the Study
The study generates relevant information on the factors influencing customer satisfaction in
Warid Telecom Uganda. The findings of the study add to the existing knowledge regarding the
factors influencing customer satisfaction of Warid Telecom Uganda users. The study particularly
provides a valuable source of information on factors influencing customer satisfaction through
reliability of network, complaints resolution and billing. It also empirically verifies the influence
of customer satisfaction factors. This forms a basis for subsequence research to explore other
factors that could affect customer satisfaction in Warid Telecom Uganda.
1.10. Justification of the Study
Given the fact that no similar study has been carried out within Warid Telecom Uganda on voice
services, the study gives an in-depth understanding of the factors influencing Customer
satisfaction.
1.11. The Scope of the Study
1. Content scope
This study investigated the factors that influence customer satisfaction. The study specifically
was seeking to determine the effect billing, complaints resolution and reliability have on
customer satisfaction of Warid Telecom voice users. These variables were selected since they
cover the majority of complaints received by the Uganda Communication Commission (UCC,
12
December 2011). This method is called critical incidental approach (Flanagan 1954) and
involves customers in determining the dimensions to be studied.
2. Time scope
The study was seeking to examine the institutional factors affecting customer satisfaction at
Warid Telecom. It was conducted in 2012 from April to December 2012.
3. Geographical scope
In terms of geographical scope, the study covered the active customers of Warid Telecom
Uganda voice services. By April 2012, they were estimated to be 3,000,000 all over Uganda
(Warid Telecom Resource Development Centre, April 2012). The study targeted customers in
Kampala since it is the district with the highest percentage of subscribers i.e 27% of the total
Warid users.
1.12. Operational Definitions
Customer satisfaction is the degree of fulfillment of expectations, perceived quality and value
towards the services offered. It is also defined as an evaluation between what was received and
what was expected (Oliver, 1977, 1981; Olson and Dover, 1979; Tse and Wilton, 1988). In
simpler words customer satisfaction is the customers’ evaluation of a product or service in terms
of whether that product or service has met their needs and expectations. (Bitner&Zeithmal, 2003)
Pricing/Billing is attaching monetary value to a service or a product
Reliability is the level at which a service is consistent at all times to accomplish its role.
Complaints resolution involves the assistance offered to clients to solve their problems in
regards to the services or products before, during and after purchase.
13
CHAPTER TWO
LITERATURE REVIEW
2.1 Introduction
This chapter presents the review of the relevant literature about the factors that influence
customer satisfaction. Views from the studies carried out by other scholars are presented
providing understanding and insight on the problem of the study. While reviewing literature,
gaps and trends on factors affecting customer satisfaction are evaluated.
2.2 Theoretical Review
The theory underpinning this study is the American Customer Satisfaction Theory (ACSI). The
ACSI model predicts that as both perceived value (PV) and perceived quality (PQ) increase,
customer satisfaction should also increase (Anderson et al., 1994). It is based on the assumptions
that customer satisfaction is caused by some factors such as perceived quality (PQ), perceived
value (PV) and expectations of customers. These factors serve as a basis for this study. They are
the antecedents of overall customer satisfaction. The model also estimates the results when a
customer is satisfied or not. These results of customer satisfaction are consequences factors such
as complaints or loyalty of customer (Johnson et al., 2001). In the case of Warid Telecom
Uganda, this implies that once customers lack loyalty by being on more than one network or not
giving referrals, they are not satisfied. The American Customer Satisfaction Index (ACSI)
measures the customers’ perceptions of quality, value, satisfaction, expectations, complaints and
future loyalty (Zeithmal and Bitner 2003).
This theory points out important issues for the study, that there is need to investigate the factors
influencing customer satisfaction in Warid Telecom Uganda so as to improve on loyalty,
14
referrals and reduce complaints which are the current problems among WTU users. The
suggested variables to study while measuring customer satisfaction are value, quality and
expectations. More specifically this study focuses on the elements of billing, complaints
resolution and reliability of services. These were selected since they cover the majority of
complaints received by the Uganda Communication Commission (UCC, December 2011).
2.3. Customer Satisfaction
Customer satisfaction is one of the most important issue concerning organization of all types
which is justified by the customer oriented philosophy and principles of continued improvement
in modern enterprise. For that matter, customer satisfaction should be measured. Customer
satisfaction measurement may be considered as the most reliable feedback, providing client’s
preferences in a direct and objective way. Thus, customer satisfaction may be considered as a
baseline standard of performance and a possible standard of excellence for any business
organization (Gerson, 1993).
There are two main interpretations of satisfaction within the literature of satisfaction, the first
view satisfaction as a process while the second take it as an outcome (Parker and Mathews,
2001). Oliver 1980, Churchill and Suprenant, 1992; Bearden and Teel, 1983; Oliver and
DeSarbo 1988 share the view that satisfaction is a post evaluation of a purchase decision. Swan
and Comb (1988) consider satisfaction as a discrepancy between the observed and the desired.
This implies that consumers could be satisfied by aspects for which expectation never existed
(YI, 1990). Parker and Mathews (2001) go ahead to say that customers want a meeting between
their values (need and want) and the object of their evaluation. The recent literature on
satisfaction focuses on emotion, fulfillment and state (Parker and Mathews 2001). However
15
some traditional model recognises that customer satisfaction is the result of both effective and
cognitive process (Fornell and Warnerfelt1987; Westbrook 1987, Wesbrook and Oliver, 1991).
Also, satisfaction has to be viewed as a judgment base on the cumulative expectations made with
a certain product or service rather than a transaction-specific phenomenon (Wilton and Nicosia,
1986). Customer satisfaction is generally agreed to be a person’s feelings of pleasure or
disappointment resulting from comparing a product’s perceived performance (or outcome) in
relation to his or her expectations (Kotler, 2003, P.36). In the information industry, Lin and
Wang (2006) revealed that customer satisfaction is the consumer’s total response to the purchase
experiences in a mobile commerce environment.
Operationally, customer satisfaction is the degree of fulfillment of expectations, perceived
quality and value towards the services offered. As a process it is also defined as an evaluation
between what was received and what was expected (Oliver, 1977, 1981; Olson and Dover, 1979;
Tse and Wilton, 1988). In simpler words customer satisfaction is the customers’ evaluation of a
product or service in terms of whether that product or service has met their needs and
expectations. (Bitner and Zeithmal, 2003).
As seen earlier, the ACSI model identifies loyalty and complaints as results of customer
satisfaction. On the other hand, this study was prompted by the problem of poor loyalty among
voice users in Uganda. Ossel, Stremersh and Gemmel (2003) state that customer satisfaction
affect customer loyalty and as loyalty may eventually result in referrals, it is advised to measure
three aspects: overall satisfaction, customer loyalty and referrals.
16
Overall satisfaction
Looy, Gemmel and Drierdonck (2003) make a distinction between relationship satisfaction and
transaction satisfaction. Transaction satisfaction refers to satisfaction with respect to usually the
most recent interaction with sharp focus on the core part of the service. Relationship transaction
refers to a more general feeling of satisfaction with the organisation as a whole. For this study,
focus is on voice services and overall satisfaction is measured both at the transaction and
relationship levels.
Customer loyalty as a consequence of customer satisfaction
Oliver defines loyalty as “A deeply held commitment to re-buy or re-patronize a preferred
product or service in the future despite situational influences and marketing efforts having the
potential to cause switching behaviour” (cited by Kotler, 2000). Thus, a customer is loyal when
he is frequently repurchasing a product or service from a particular provider. In the case of this
research, a customer who is loyal only uses Warid Telecom Uganda voice services and this
implies that he is satisfied.
The significance of customer loyalty is that it is closely related to the company’s continued
survival and to strong future growth (Fornell, 1992). Customers that are very satisfied with a
company are very likely to remain with that company which leads to future revenue for the
company.
However there are instances where customers continue to stay loyal because there is no better
alternative. This could be regarded as apathetic loyalty; other researchers like Jones and Sasser
(1995) have called such customers hostages (cited by Little and Marandi, 2003). While loyal
customer advocates may spread good words about the company’s services and make excellent
17
referrals, apathetic customers often take the opportunity to complain and criticise. This increases
the cost of complaints handling and damages the corporate image (Little and Marandi 2003).
Customer referrals as a consequence of customer satisfaction
Delighted customers may refer others to your services. It is therefore intriguing to link
satisfaction and loyalty measurements to these referrals. However, since it is very difficult, if not
impossible, to link these measures to actual referrals, it is common to measure the intent to refer
instead (Looy,Gemmel and Drierdonck 2003). Consequently this study considered the intent to
refer when measuring the satisfaction of Warid Telecom users.
2.4. Reliability of Services and Customer Satisfaction
According to Parasuraman, Zeithmal and Berry (1998, 1990) model, reliability of services is a
dimension of service quality. As quoted by Ojo (2010), service quality vary in wording but
typically involves determining whether perceived service delivery meets, exceeds or fails to meet
customer expectations (Cronin and Taylor, 1992; Oliver,1993; Zeithaml, Berry and Parasuraman,
1993). Spreng and Machoy (1996) found out that service quality is an important indicator of
customer satisfaction. In particular, consumers prefer the reliability of services when the price
and other cost elements are held constant (Turban, 2002). Reliability involves the ability to
perform the promised service dependably and accurately (Parasuraman, Zeithmal and Berry
1988, 1990).
There is a difference between actual quality of services and customers perceived service quality.
According to Palkar (2004) perceived quality is the factor that has greater influence on the
customer satisfaction. In this study, focus is on the consumers’ perceptions of reliability of voice
services. Reliability of services as perceived by the customers depends on past experience, word
18
of mouth and the future anticipation of quality of the cellular service (Iqbal et al., 2010). Cellular
users require the best quality. Accordingly, companies need continuous improvement in quality
through latest technology, installing costly equipments, trying to improve call clarity and
coverage (Kim et al., 2004).
Basing on the above views, the researcher assesses the dimensions mentioned by Kim et al.,
(2004) that is; the network coverage, dropped calls and the quality of calls as perceived by
customers.
2.5. Billing and Customer Satisfaction
Billing is the monetary value attached to a service. For a customer to be satisfied the actual
billing of the voice services has to match the perceived billing (Iqbal et al. 2010). The customer’s
perceived value is the difference between the highest price that consumers are willing to pay for
a product or a service and the amount practically paid. The Monetary perspective indicates that
value is generated when less is paid for goods or services (Bishop, 1984).
Fornell (1992) attests that there are many benefits for a company from a high customer
satisfaction level since it captures a high market share and is able to maintain and sustain it: a
basic and core policy of every business that heightens customer loyalty and prevents customer
switching behaviour, increases customer price tolerance while reducing marketing cost.
Under this variable, the study analyses the timeliness and accuracy of billing as perceived by
customers.
19
2.6. Complaints Resolution and Customer Satisfaction
Complaints resolution is concerned with service recovery which is the practice of rectifying
mistakes, either by restoring the service, compensating the customer or merely apologising for
the failure (Little and Marandi, 2003).
Complaints largely influence customer satisfaction. Ossel, Stremersch and Gemmel (2003) insist
on the importance of complaints since they are the expression of dissatisfaction, the way the
organisation deals with the complaints will determine whether it will lose or retain the customer.
Besides, complaints give an opportunity for continuous improvement of services as they provide
information on what products are essential for the customers.
As a rule; customers dislike complaining because it costs them time, effort and emotional stress.
Little and Marandi (2003) propose four principles for effective service recovery:
Make it easy to complain by setting clear and flexible channels for customers’ complaints.
Complaints handling staff should be skilled and be able to put the customers at ease.
Establish the grounds for complaint. Customers are more willing to complain if they are
confident they will be successful. The publication of a simple guarantee of acceptable service
levels will provide such confidence.
Offer immediate redress where possible to avoid grievance of customers. For purpose of
being prompt, it’s advisable to empower customer- facing staff to handle the problems as
they arise.
Communicate: Seiders and Beery (1998) note that customers negative perceptions of a
service failure are intensified if they feel that the failure could have been prevented. Often
20
all that is needed is an apology with an explanation of why the failure occurred and the steps
that have been taken to ensure that it does not occur again.
In summary Little and Marandi (2003) highlight the key elements that characterise effective
complaints handling. Basing on the above principles, this research looks at the following aspects:
accessibility of the complaints desk, the time taken to resolve complaints and the correctness of
the information received by a customer. The correctness/accuracy of the information or help
given is measured according to whether the complaint was resolved or not.
2.7. Summary of the Literature
The literature review covers the concepts of the study that is; the factors influencing satisfaction
as an independent variable and customer satisfaction as the dependent variable. The review is
based on the conceptual framework development for the study which is shown in Figure 1 in
chapter one. Also the review covers theories that are related to the study. The discussion
identified gaps in the previous researches that gives the basis for carrying out this study.
Reviewed literature shows that without identifying and measuring factors affecting customer
satisfaction it can greatly affect loyalty, increase complaints and bad referrals hence failing the
company. Although this seems to apply to all kinds of industries, not much research has been
conducted on the Ugandan Telecom Industry and most especially Warid Telecom Uganda hence
the need to carry out this study.
21
CHAPTER THREE
METHODOLOGY
3.1. Introduction
This chapter presents the methodology that the researcher used in the study. It includes the
research design, study population, sample size and selection, sampling techniques, study
instruments and analysis, reliability and validity.
3.2. Research Design
A cross sectional design was used for both quantitative and qualitative data collection methods.
This was used because of its capacity to rely on set items, oral or written, through personal
interviews in soliciting responses basing on a representative sample to obtain people’s feelings
and views on issues (Burns, 2000). To access and document adequate data and information on
the topic, the researcher selected Warid Telecom Uganda and applied different methods to
acquire the required information. Qualitative research was applied in order to describe current
conditions, or investigate relationships (Creswell et al, 2003). On the other hand quantitative
approaches were used as they have the merits of eliminating or minimising subjective of
judgement and achieving higher levels of reliability of gathered data (Schwartz, 2008).
Quantitative methods were used to establish presence of relationships between factors
influencing customer satisfaction and customer satisfaction while qualitative research was also
applied in order to describe current conditions, or to investigate relationships (Creswell et al,
2003).
22
3.3. Study Population
The study population comprised of customers of Warid Telecom Uganda as well as the
management of the company. The study population was comprised of both female and male
customers in Kampala. The access population was 800,000 and the sample size was 384. This
was determined by using Krejcie and Morgan table obtained from Amin (2005), which states
that, a population of 800,000 the appropriate size would be 384 respondents. The inclusion of all
these categories of respondents was to ensure that all the different viewpoints about the various
aspects of customer satisfaction are tapped.
3.4 Sample Size and Selection
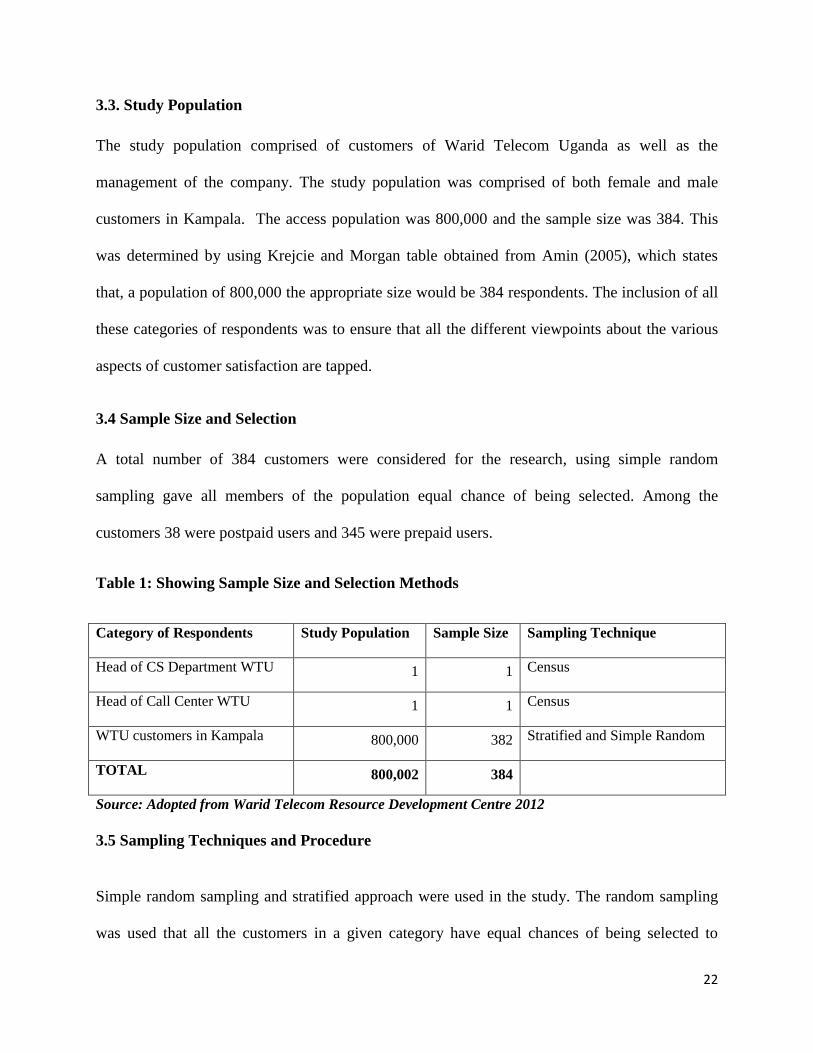
A total number of 384 customers were considered for the research, using simple random
sampling gave all members of the population equal chance of being selected. Among the
customers 38 were postpaid users and 345 were prepaid users.
Table 1: Showing Sample Size and Selection Methods
Category of Respondents Study Population Sample Size Sampling Technique
Head of CS Department WTU 1 1 Census
Head of Call Center WTU 1 1 Census
WTU customers in Kampala 800,000 382 Stratified and Simple Random
TOTAL 800,002 384
Source: Adopted from Warid Telecom Resource Development Centre 2012
3.5 Sampling Techniques and Procedure
Simple random sampling and stratified approach were used in the study. The random sampling
was used that all the customers in a given category have equal chances of being selected to
23
participate in the study. The population was divided into strata basing on postpaid and prepaid
users. The researcher then sampled from each strata to get an appropriate sample size using
random sampling techniques.
3.6 Data Collection Methods
The Researcher used different methods to collect qualitative and quantitative data. Qualitative
data was collected through semi – structured interview for key informants using interview guide.
The key informants were selected from the sample and these were staff that held key positions
such as heads of departments. Semi – structured interviews were more flexible and they allowed
for additional comments and avenues to be explored. These interviews provided in depth data
guarded against confusion caused by unclear questions and enabled the researcher to collect
more information. Quantitative data was collected through a structured (closed ended), four –
Likert scale questionnaire. This method was easy to administer, simple to code and analyze.
3.7. Data Collection Instruments
The questionnaires were administered to customers. The questionnaire was preferred as an
instrument of research because it has identical set of items for all respondents, produce fewer
errors, ensure confidentiality, respondents feel free from the influence of the researcher and
respondents had the chance to answer in their convenient time (Burns, 2000). Most of the items
in the questionnaire were short requiring direct answers. The questionnaire was designed and
sectioned according to the themes of the study. In the initial stage the respondents were asked
and replies to them informed the researcher of the perspective of the customers.
24
Interviews were also conducted; they can be structured or unstructured and conducted either face
to face or by telephone. Face to face and telephone interviews were conducted targeting heads of
departments and customers. The researcher recorded responses to the questions asked using an
interview guide. The reason for using the interview was because some respondents have tight
schedules and so cannot get time to fill the questionnaire (Amin, 2005) .The method enabled the
researcher to get intimate feelings of the customers, which the questionnaires could not elicit.
3.8.Quality Control
The developed data collection instruments were tried on selected respondents who are considered
to be in situation similar to the actual study sample. An assessment of the data obtained helped
the researcher to revise, refine and improve the instruments before they were used to collect the
actual data.
3.8.1 Validity of Instruments
The researcher looked at content related validity. This was through consultations with colleagues
to cross check and see if they were appropriate. For the instrument to be accepted as valid the
CVI (Content Validity Index) should be greater or equal to 0.7. CVI = No of items rated valid
divided by the total No. of items in the questionnaire. The computation of CVI was done by
summing up the two judges rating and dividing by two to get the average.
Judge 1 CVI = (n)/N = 17/20= 0.85
Judge 2 CVI = (n)/N = 15/20= 0.75
Where; n= Number of items declared valid, N= Total number of items in the instrument
Overall content validity index = (0.85+0.75)/2= 0.80
CVI obtained (0.80) is greater than 0.7 which makes the questionnaire valid for use.
25
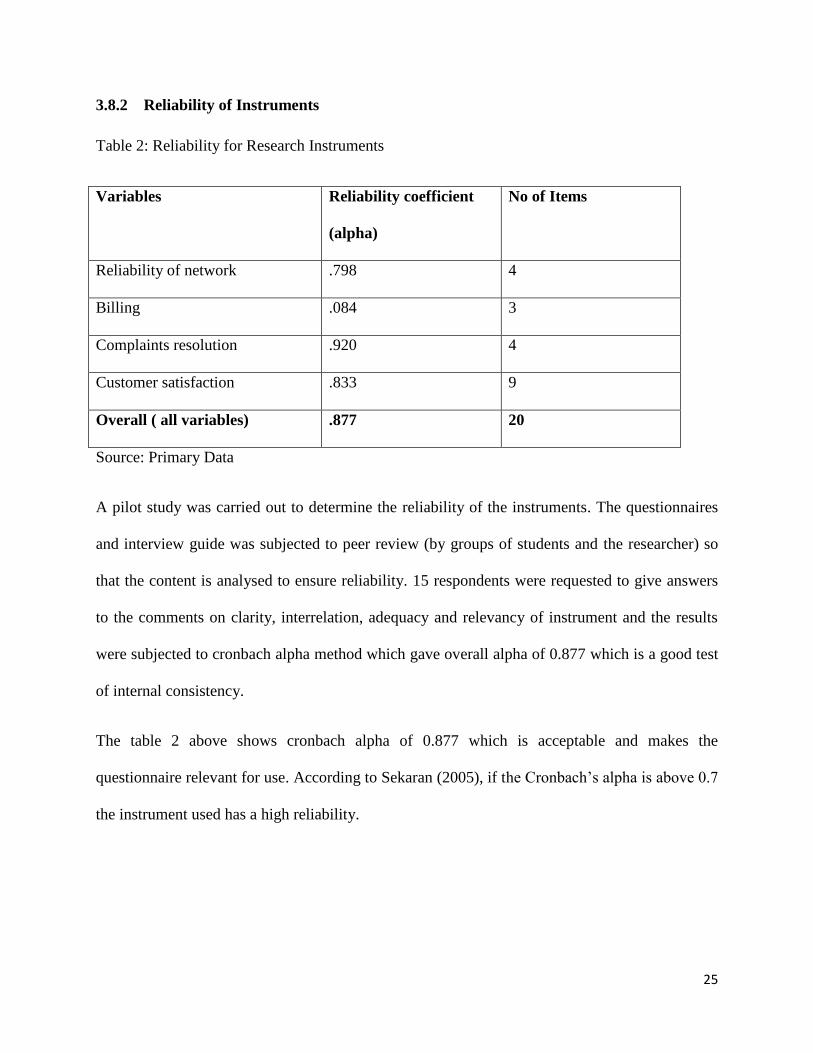
3.8.2 Reliability of Instruments
Table 2: Reliability for Research Instruments
Variables Reliability coefficient
(alpha)
No of Items
Reliability of network .798 4
Billing .084 3
Complaints resolution .920 4
Customer satisfaction .833 9
Overall ( all variables) .877 20
Source: Primary Data
A pilot study was carried out to determine the reliability of the instruments. The questionnaires
and interview guide was subjected to peer review (by groups of students and the researcher) so
that the content is analysed to ensure reliability. 15 respondents were requested to give answers
to the comments on clarity, interrelation, adequacy and relevancy of instrument and the results
were subjected to cronbach alpha method which gave overall alpha of 0.877 which is a good test
of internal consistency.
The table 2 above shows cronbach alpha of 0.877 which is acceptable and makes the
questionnaire relevant for use. According to Sekaran (2005), if the Cronbach’s alpha is above 0.7
the instrument used has a high reliability.
26
3.9 Procedure of Data Collection
After a successful proposal defense before a Committee and approval of the research proposal,
the research was given an introductory letter to go to the field work (See Appendix IV). The
researcher then tested the instruments and proceeded to make appointment with the management
of Warid for interviews. Thereafter the researcher started administering the questionnaires and
interviews to both postpaid and prepaid users. The researcher requested the addresses of the
postpaid users based in Kampala and was able to administer the questionnaires and interviews.
3.10 Data Analysis
3.10.1 Qualitative Data Analysis
After data collection, the data was sorted by checking for any errors, grouped into themes and
analyzed as postulated in the conceptual framework and research objectives. Patterns and
connections within and between categories were identified. Data was interpreted by drawing
averages, percentages, explanations and substantiating them using the respondents open
responses. Qualitative data analysis helped to determine useful conclusions and
recommendations of the study.
3.10.2 Quantitative Data Analysis
Quantitative data was processed and analysed using three processes namely; editing, coding and
tabulation. Quantitative data generated from questionnaires was edited to ensure completeness. It
was then coded using SPPSS, cleaned and analysis was done. The analysis was done using
Pearson’s Rank Correlation to establish relationships between the independent variables and
27
dependent variables. The magnitude of the relationships between the variables was also
measured using regression analysis.
3.11 Measurement of variables
The variables of the study were rated on a 4 point likert scale. The four categories of response
are strongly agree, agree, disagree and strongly disagree. These were used in the questionnaire so
as to investigate the relationship between the independent and dependent variables. In the study
three levels of measures were used that is; the nominal scale, the ordinal scale and the interval
scale. The nominal scale was used for categorizing the variables in the questionnaire, the ordinal
scale was used to measure responses to the statements and the interval scale was used to measure
the age bracket. Interviews with open ended questions were conducted to measure opinions and
perceptions. The statements used in the questionnaire were all adopted from previous studies
done on customer satisfaction (see references). The statements to measure the reliability of the
network were adopted from Kim et al (2004), the statements to measure billing were adopted
from Wang and Shiesh (2005) and the statements to measure complaints resolution were adopted
from Biljana and Jusuf (2011).
28
CHAPTER FOUR
DATA PRESENTATION, ANALYSIS, AND INTREPRETATION OF FINDINGS
4.1 Introduction
This chapter is a presentation and discussion of the findings of this study. The purpose of the
study was to establish the institutional factors influencing customer satisfaction of Warid
Telecom users. The findings were derived from responses obtained by use of questionnaires and
interviews to the respondents.
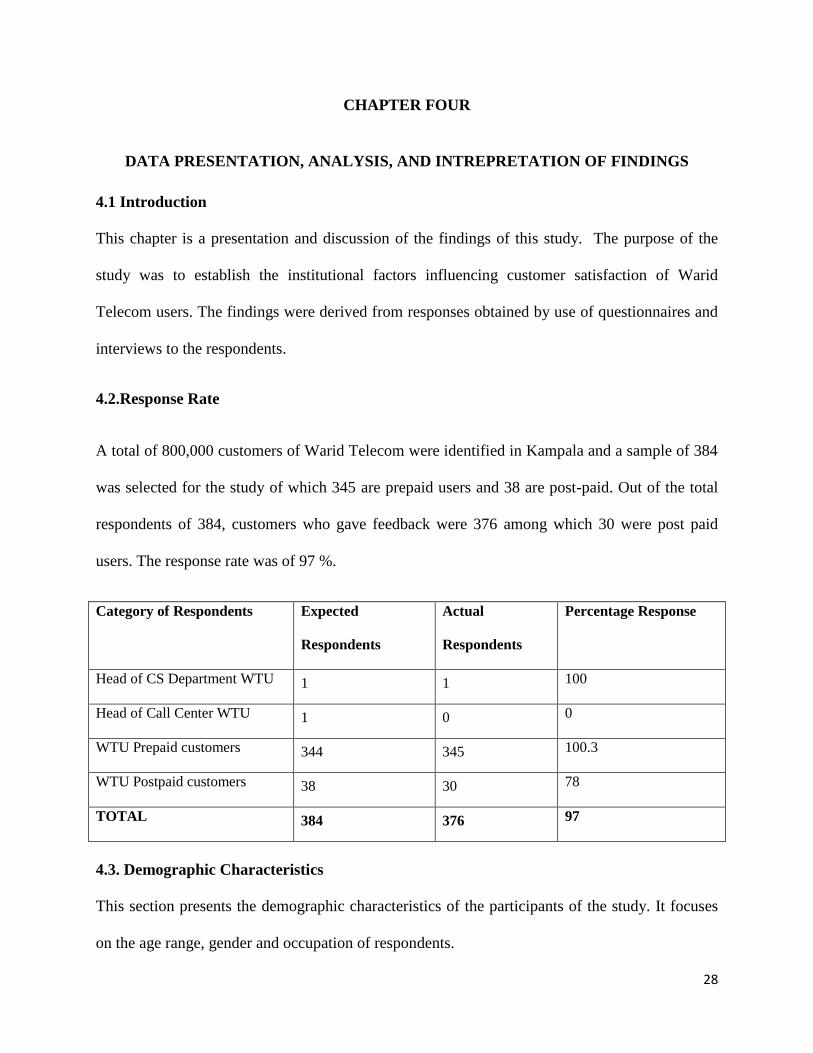
4.2.Response Rate
A total of 800,000 customers of Warid Telecom were identified in Kampala and a sample of 384
was selected for the study of which 345 are prepaid users and 38 are post-paid. Out of the total
respondents of 384, customers who gave feedback were 376 among which 30 were post paid
users. The response rate was of 97 %.
Category of Respondents Expected
Respondents
Actual
Respondents
Percentage Response
Head of CS Department WTU 1 1 100
Head of Call Center WTU 1 0 0
WTU Prepaid customers 344 345 100.3
WTU Postpaid customers 38 30 78
TOTAL 384 376 97
4.3. Demographic Characteristics
This section presents the demographic characteristics of the participants of the study. It focuses
on the age range, gender and occupation of respondents.
29
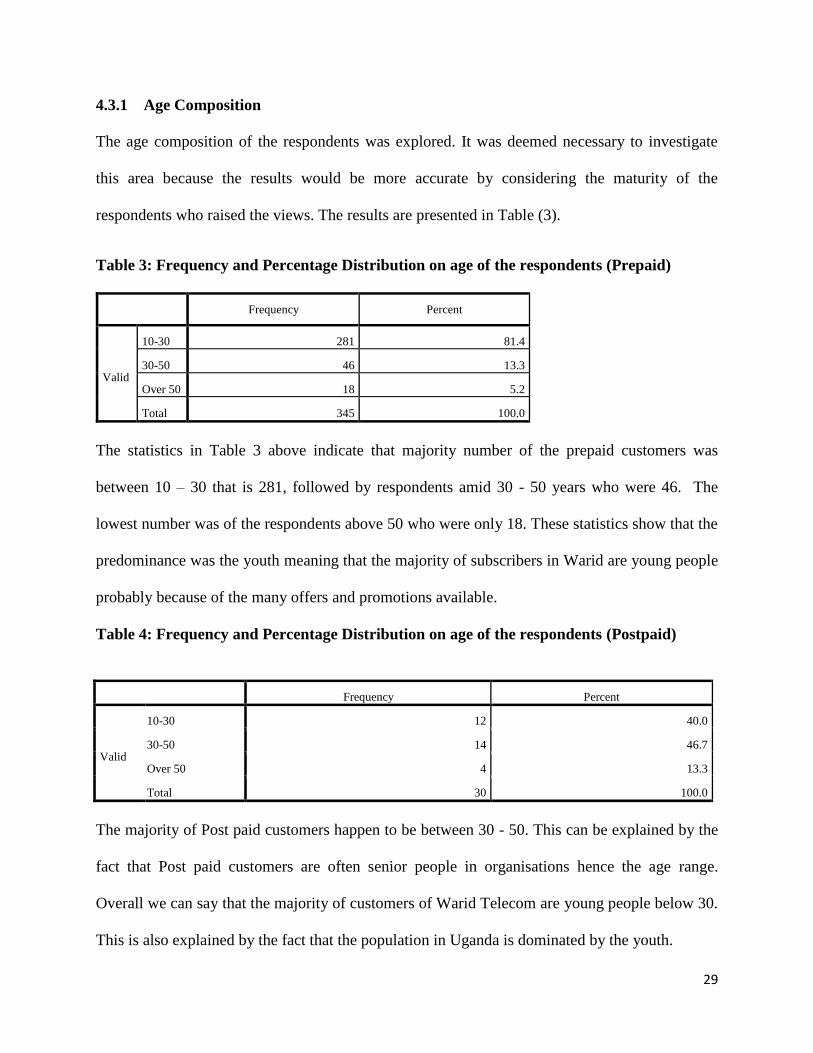
4.3.1 Age Composition
The age composition of the respondents was explored. It was deemed necessary to investigate
this area because the results would be more accurate by considering the maturity of the
respondents who raised the views. The results are presented in Table (3).
Table 3: Frequency and Percentage Distribution on age of the respondents (Prepaid)
Frequency Percent
Valid
10-30 281 81.4
30-50 46 13.3
Over 50 18 5.2
Total 345 100.0
The statistics in Table 3 above indicate that majority number of the prepaid customers was
between 10 – 30 that is 281, followed by respondents amid 30 - 50 years who were 46. The
lowest number was of the respondents above 50 who were only 18. These statistics show that the
predominance was the youth meaning that the majority of subscribers in Warid are young people
probably because of the many offers and promotions available.
Table 4: Frequency and Percentage Distribution on age of the respondents (Postpaid)
Frequency Percent
Valid
10-30 12 40.0
30-50 14 46.7
Over 50 4 13.3
Total 30 100.0
The majority of Post paid customers happen to be between 30 - 50. This can be explained by the
fact that Post paid customers are often senior people in organisations hence the age range.
Overall we can say that the majority of customers of Warid Telecom are young people below 30.
This is also explained by the fact that the population in Uganda is dominated by the youth.
30
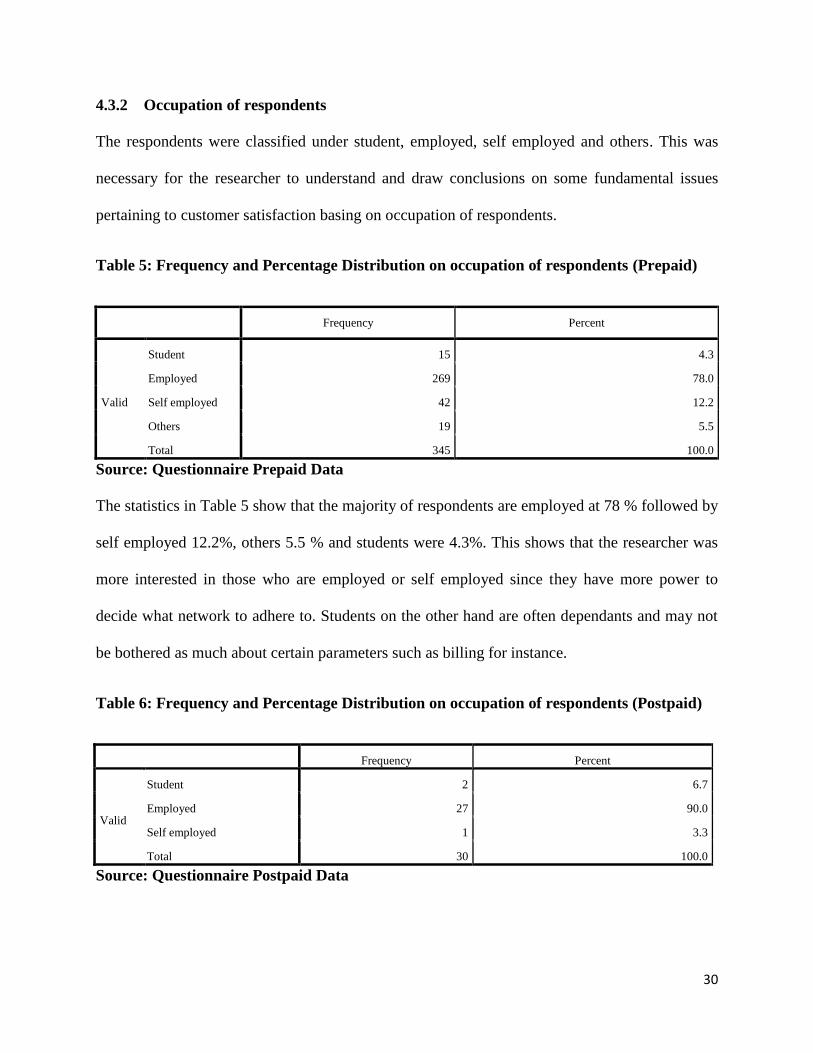
4.3.2 Occupation of respondents
The respondents were classified under student, employed, self employed and others. This was
necessary for the researcher to understand and draw conclusions on some fundamental issues
pertaining to customer satisfaction basing on occupation of respondents.
Table 5: Frequency and Percentage Distribution on occupation of respondents (Prepaid)
Frequency Percent
Valid
Student 15 4.3
Employed 269 78.0
Self employed 42 12.2
Others 19 5.5
Total 345 100.0
Source: Questionnaire Prepaid Data
The statistics in Table 5 show that the majority of respondents are employed at 78 % followed by
self employed 12.2%, others 5.5 % and students were 4.3%. This shows that the researcher was
more interested in those who are employed or self employed since they have more power to
decide what network to adhere to. Students on the other hand are often dependants and may not
be bothered as much about certain parameters such as billing for instance.
Table 6: Frequency and Percentage Distribution on occupation of respondents (Postpaid)
Frequency Percent
Valid
Student 2 6.7
Employed 27 90.0
Self employed 1 3.3
Total 30 100.0
Source: Questionnaire Postpaid Data
31
90% Post paid users are employed this because Postpaid services are mostly requested by
companies for their staff.
4.4.Empirical Findings
The study was to investigate the factors influencing customer satisfaction of Warid Telecom
Uganda Voice Services. Factors were operationalized into reliability of network, billing and
complaints resolution while customer satisfaction was operationalised into number of simcards
owned from other networks, number of years spent on the network, number of referrals and
overall satisfaction. The researcher used descriptive statistics and made comparisons of the
frequencies and percentages.
In this section data collected from questionnaires, interview guides is presented, analyzed and
interpreted objective by objective.
4.4.1 Reliability of Network and Customer Satisfaction in Warid Telecom Voice services
This item of the study sought to establish the effect of the reliability of network on customer
satisfaction. The researcher administered questionnaires to see if the reliability of network
influences customer satisfaction. The relationship was explained by both qualitative and
quantitative analyses. The qualitative analysis involved the use of descriptive statistics in which
frequencies and percentages were applied to examine the behaviour of the variables. The results
were then tested with the Pearson product moment correlation coefficient and the regression
analysis to generate the strength of the relationships established.
32
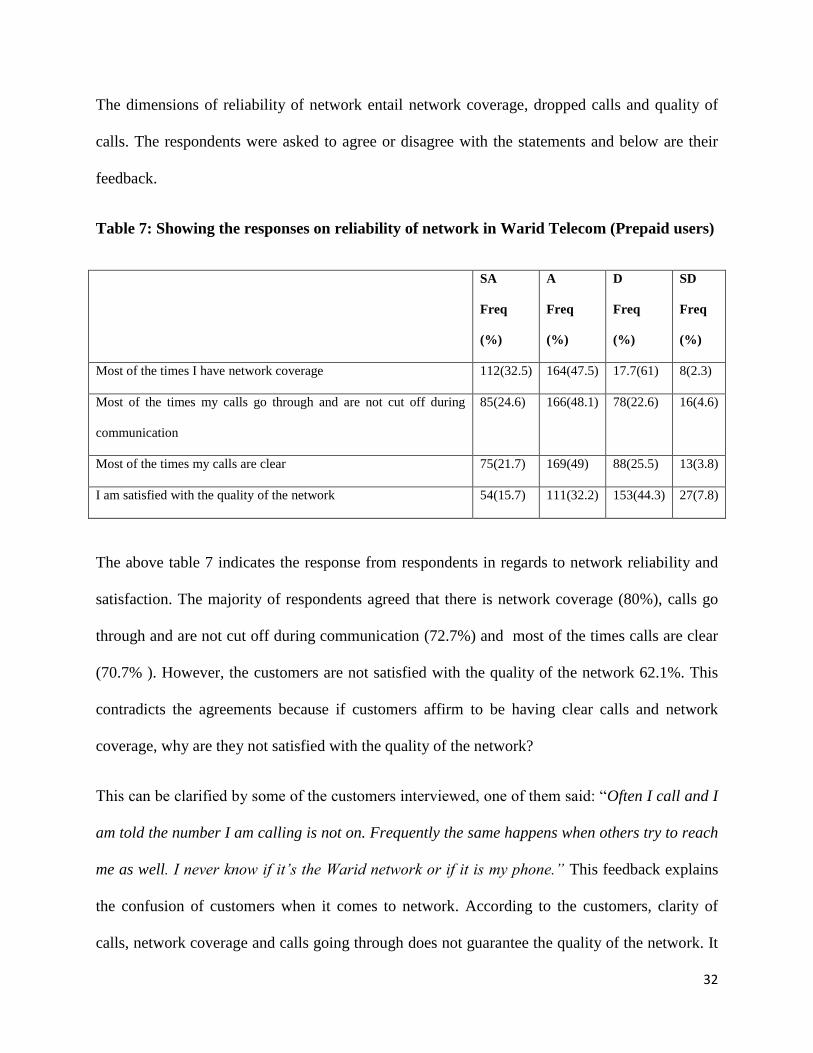
The dimensions of reliability of network entail network coverage, dropped calls and quality of
calls. The respondents were asked to agree or disagree with the statements and below are their
feedback.
Table 7: Showing the responses on reliability of network in Warid Telecom (Prepaid users)
SA
Freq
(%)
A
Freq
(%)
D
Freq
(%)
SD
Freq
(%)
Most of the times I have network coverage 112(32.5) 164(47.5) 17.7(61) 8(2.3)
Most of the times my calls go through and are not cut off during
communication
85(24.6) 166(48.1) 78(22.6) 16(4.6)
Most of the times my calls are clear 75(21.7) 169(49) 88(25.5) 13(3.8)
I am satisfied with the quality of the network 54(15.7) 111(32.2) 153(44.3) 27(7.8)
The above table 7 indicates the response from respondents in regards to network reliability and
satisfaction. The majority of respondents agreed that there is network coverage (80%), calls go
through and are not cut off during communication (72.7%) and most of the times calls are clear
(70.7% ). However, the customers are not satisfied with the quality of the network 62.1%. This
contradicts the agreements because if customers affirm to be having clear calls and network
coverage, why are they not satisfied with the quality of the network?
This can be clarified by some of the customers interviewed, one of them said: “Often I call and I
am told the number I am calling is not on. Frequently the same happens when others try to reach
me as well. I never know if it’s the Warid network or if it is my phone.” This feedback explains
the confusion of customers when it comes to network. According to the customers, clarity of
calls, network coverage and calls going through does not guarantee the quality of the network. It
33
means that users have other expectations as per the reliability of the network. They compare
Warid to other networks they use in order to determine the quality of the network. This was aired
out by some users, one of them said: “Warid is not having the best network compared to other
telecoms that is why I maintained my UTL line, when the network fails, I am able to switch.”
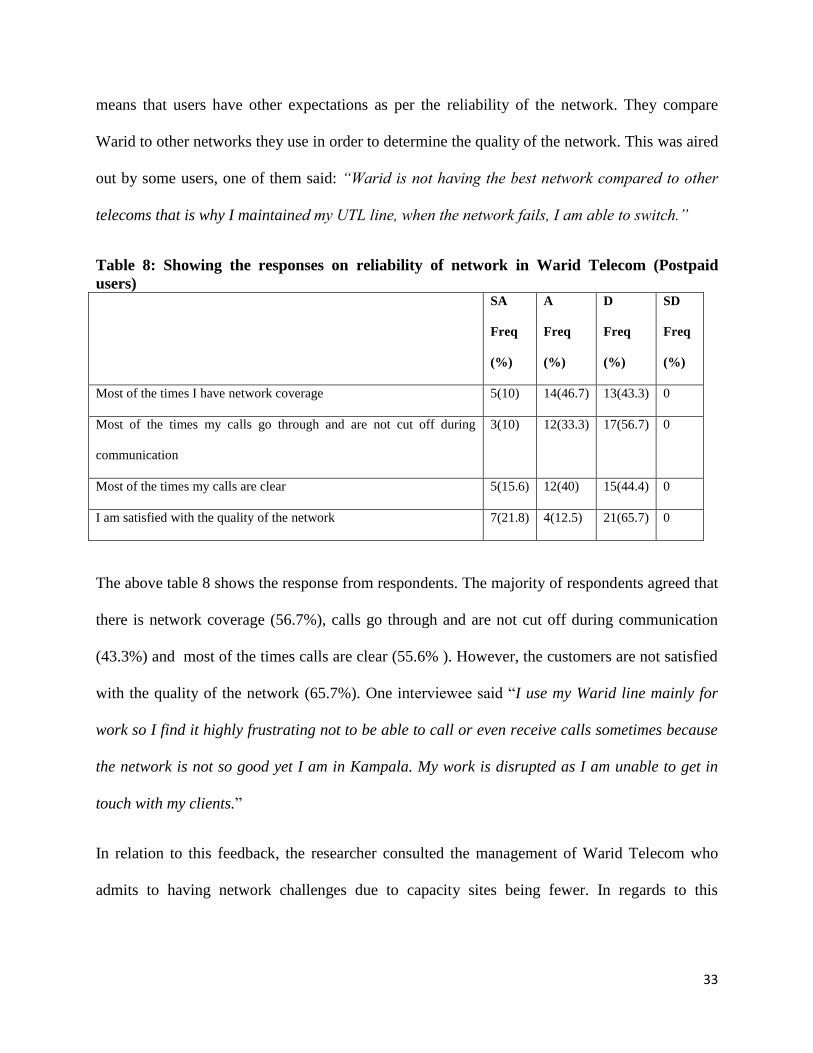
Table 8: Showing the responses on reliability of network in Warid Telecom (Postpaid
users) SA
Freq
(%)
A
Freq
(%)
D
Freq
(%)
SD
Freq
(%)
Most of the times I have network coverage 5(10) 14(46.7) 13(43.3) 0
Most of the times my calls go through and are not cut off during
communication
3(10) 12(33.3) 17(56.7) 0
Most of the times my calls are clear 5(15.6) 12(40) 15(44.4) 0
I am satisfied with the quality of the network 7(21.8) 4(12.5) 21(65.7) 0
The above table 8 shows the response from respondents. The majority of respondents agreed that
there is network coverage (56.7%), calls go through and are not cut off during communication
(43.3%) and most of the times calls are clear (55.6% ). However, the customers are not satisfied
with the quality of the network (65.7%). One interviewee said “I use my Warid line mainly for
work so I find it highly frustrating not to be able to call or even receive calls sometimes because
the network is not so good yet I am in Kampala. My work is disrupted as I am unable to get in
touch with my clients.”
In relation to this feedback, the researcher consulted the management of Warid Telecom who
admits to having network challenges due to capacity sites being fewer. In regards to this
34
problem, upgrades of the network are run every now and then often disrupting the quality of the
network even in Kampala where network is expected to be at its best.
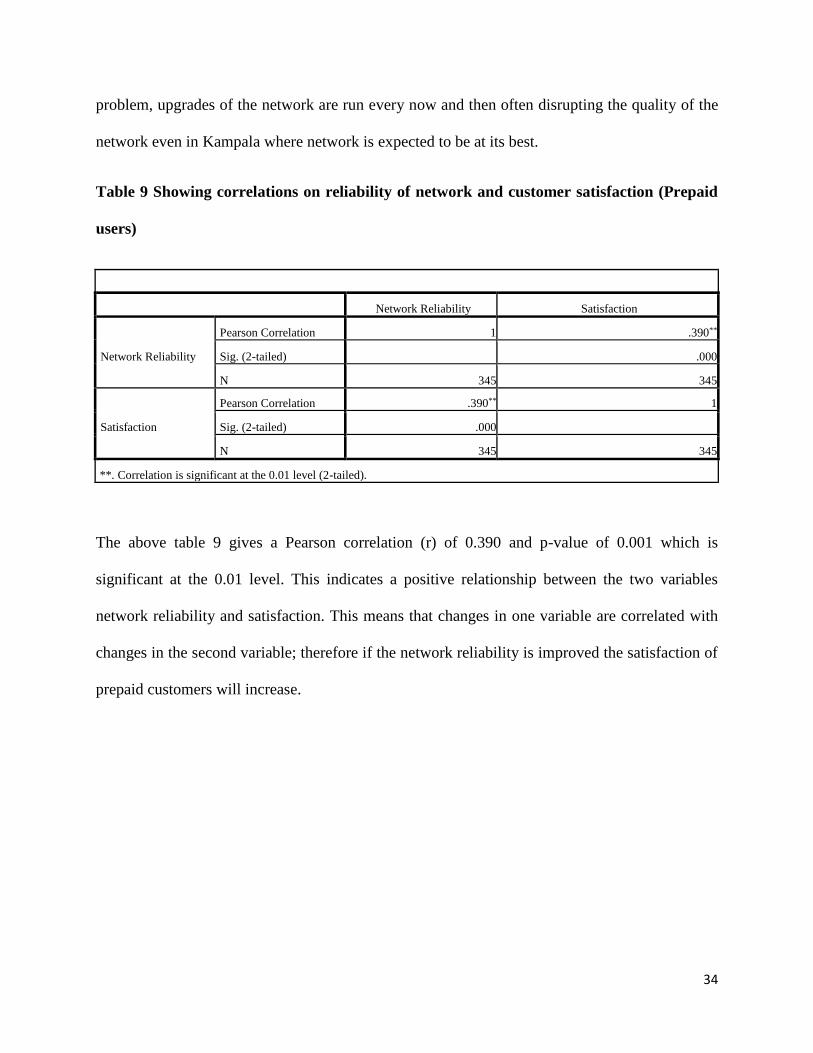
Table 9 Showing correlations on reliability of network and customer satisfaction (Prepaid
users)
Network Reliability Satisfaction
Network Reliability
Pearson Correlation 1 .390**
Sig. (2-tailed)
.000
N 345 345
Satisfaction
Pearson Correlation .390** 1
Sig. (2-tailed) .000
N 345 345
**. Correlation is significant at the 0.01 level (2-tailed).
The above table 9 gives a Pearson correlation (r) of 0.390 and p-value of 0.001 which is
significant at the 0.01 level. This indicates a positive relationship between the two variables
network reliability and satisfaction. This means that changes in one variable are correlated with
changes in the second variable; therefore if the network reliability is improved the satisfaction of
prepaid customers will increase.
35
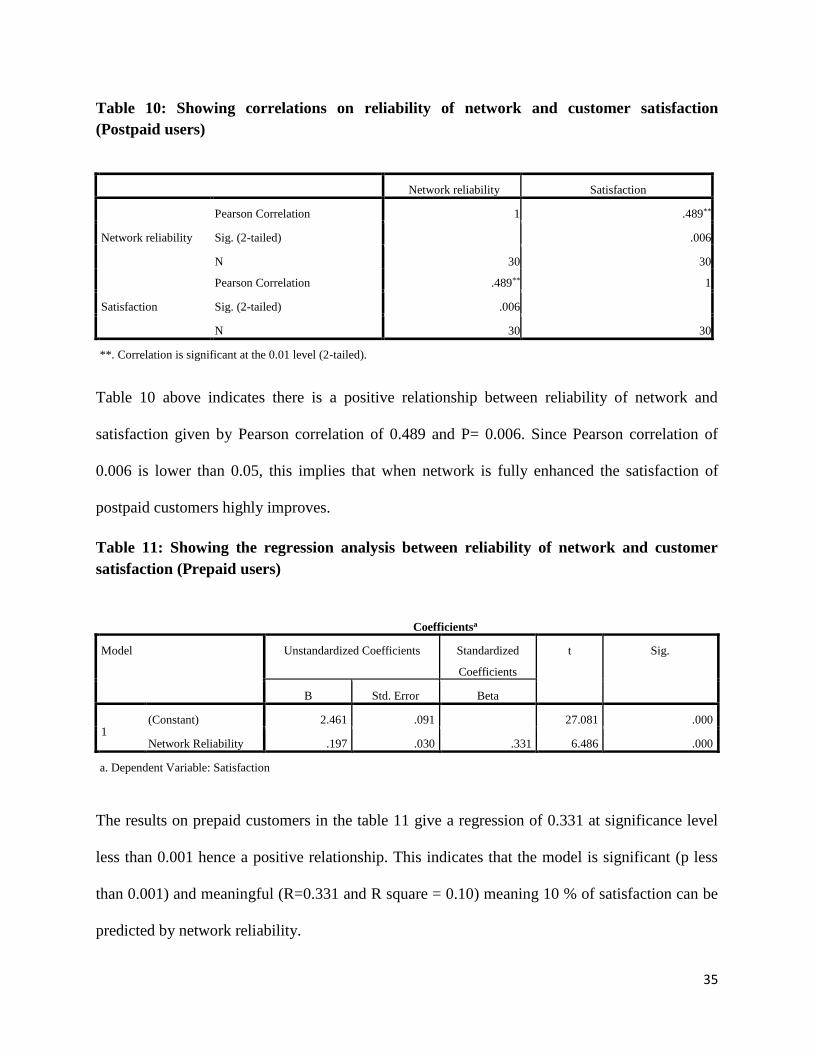
Table 10: Showing correlations on reliability of network and customer satisfaction
(Postpaid users)
Network reliability Satisfaction
Network reliability
Pearson Correlation 1 .489**
Sig. (2-tailed)
.006
N 30 30
Satisfaction
Pearson Correlation .489** 1
Sig. (2-tailed) .006
N 30 30
**. Correlation is significant at the 0.01 level (2-tailed).
Table 10 above indicates there is a positive relationship between reliability of network and
satisfaction given by Pearson correlation of 0.489 and P= 0.006. Since Pearson correlation of
0.006 is lower than 0.05, this implies that when network is fully enhanced the satisfaction of
postpaid customers highly improves.
Table 11: Showing the regression analysis between reliability of network and customer
satisfaction (Prepaid users)
Coefficientsa
Model Unstandardized Coefficients Standardized
Coefficients
t Sig.
B Std. Error Beta
1 (Constant) 2.461 .091
27.081 .000
Network Reliability .197 .030 .331 6.486 .000
a. Dependent Variable: Satisfaction
The results on prepaid customers in the table 11 give a regression of 0.331 at significance level
less than 0.001 hence a positive relationship. This indicates that the model is significant (p less
than 0.001) and meaningful (R=0.331 and R square = 0.10) meaning 10 % of satisfaction can be
predicted by network reliability.
36
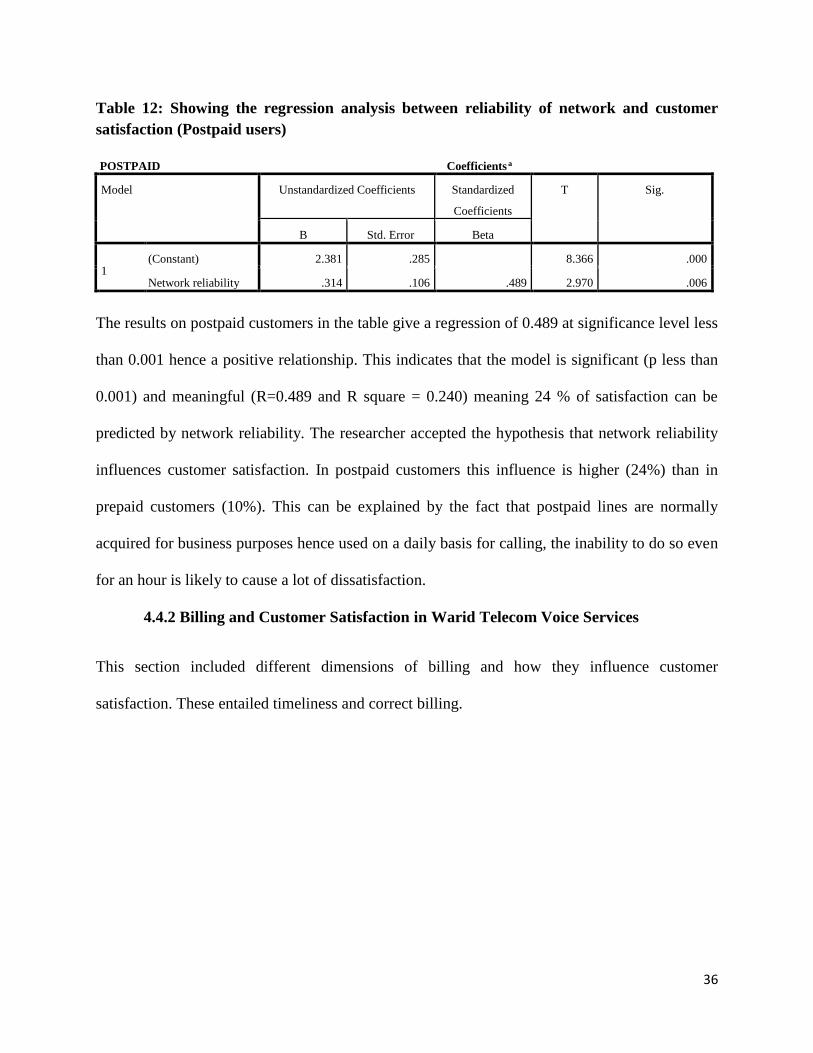
Table 12: Showing the regression analysis between reliability of network and customer
satisfaction (Postpaid users)
POSTPAID Coefficientsa
Model Unstandardized Coefficients Standardized
Coefficients
T Sig.
B Std. Error Beta
1 (Constant) 2.381 .285
8.366 .000
Network reliability .314 .106 .489 2.970 .006
The results on postpaid customers in the table give a regression of 0.489 at significance level less
than 0.001 hence a positive relationship. This indicates that the model is significant (p less than
0.001) and meaningful (R=0.489 and R square = 0.240) meaning 24 % of satisfaction can be
predicted by network reliability. The researcher accepted the hypothesis that network reliability
influences customer satisfaction. In postpaid customers this influence is higher (24%) than in
prepaid customers (10%). This can be explained by the fact that postpaid lines are normally
acquired for business purposes hence used on a daily basis for calling, the inability to do so even
for an hour is likely to cause a lot of dissatisfaction.
4.4.2 Billing and Customer Satisfaction in Warid Telecom Voice Services
This section included different dimensions of billing and how they influence customer
satisfaction. These entailed timeliness and correct billing.
37
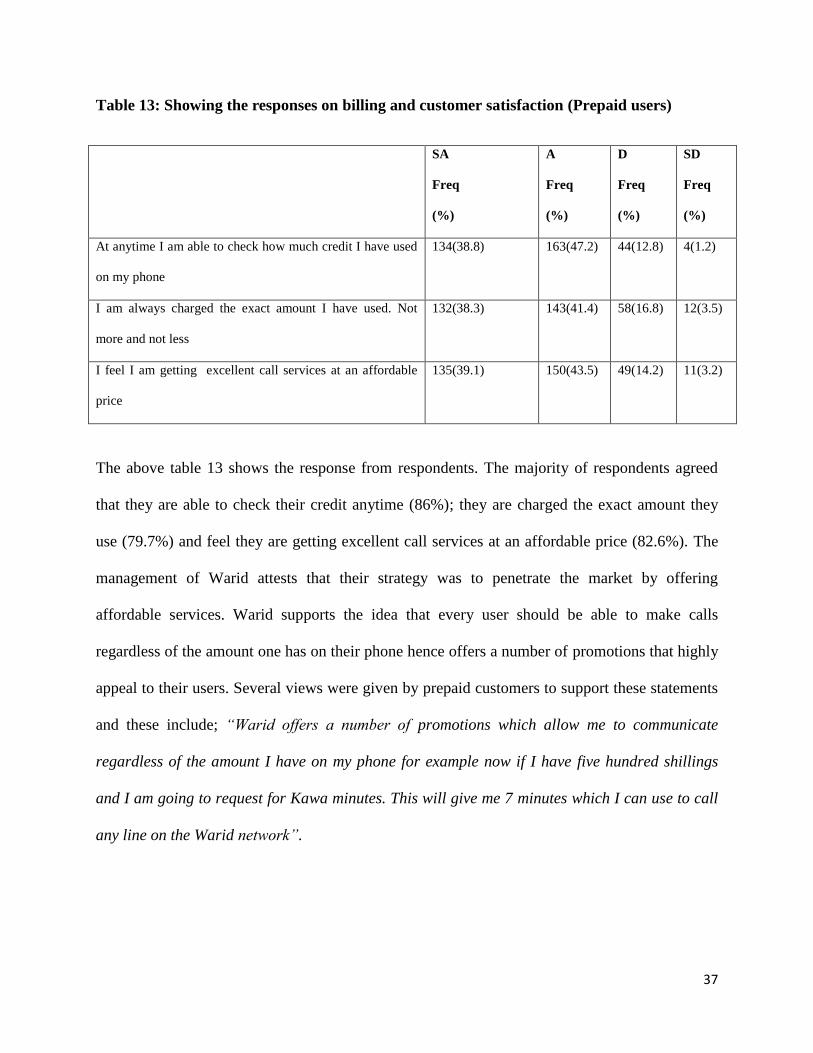
Table 13: Showing the responses on billing and customer satisfaction (Prepaid users)
SA
Freq
(%)
A
Freq
(%)
D
Freq
(%)
SD
Freq
(%)
At anytime I am able to check how much credit I have used
on my phone
134(38.8) 163(47.2) 44(12.8) 4(1.2)
I am always charged the exact amount I have used. Not
more and not less
132(38.3) 143(41.4) 58(16.8) 12(3.5)
I feel I am getting excellent call services at an affordable
price
135(39.1) 150(43.5) 49(14.2) 11(3.2)
The above table 13 shows the response from respondents. The majority of respondents agreed
that they are able to check their credit anytime (86%); they are charged the exact amount they
use (79.7%) and feel they are getting excellent call services at an affordable price (82.6%). The
management of Warid attests that their strategy was to penetrate the market by offering
affordable services. Warid supports the idea that every user should be able to make calls
regardless of the amount one has on their phone hence offers a number of promotions that highly
appeal to their users. Several views were given by prepaid customers to support these statements
and these include; “Warid offers a number of promotions which allow me to communicate
regardless of the amount I have on my phone for example now if I have five hundred shillings
and I am going to request for Kawa minutes. This will give me 7 minutes which I can use to call
any line on the Warid network”.
38
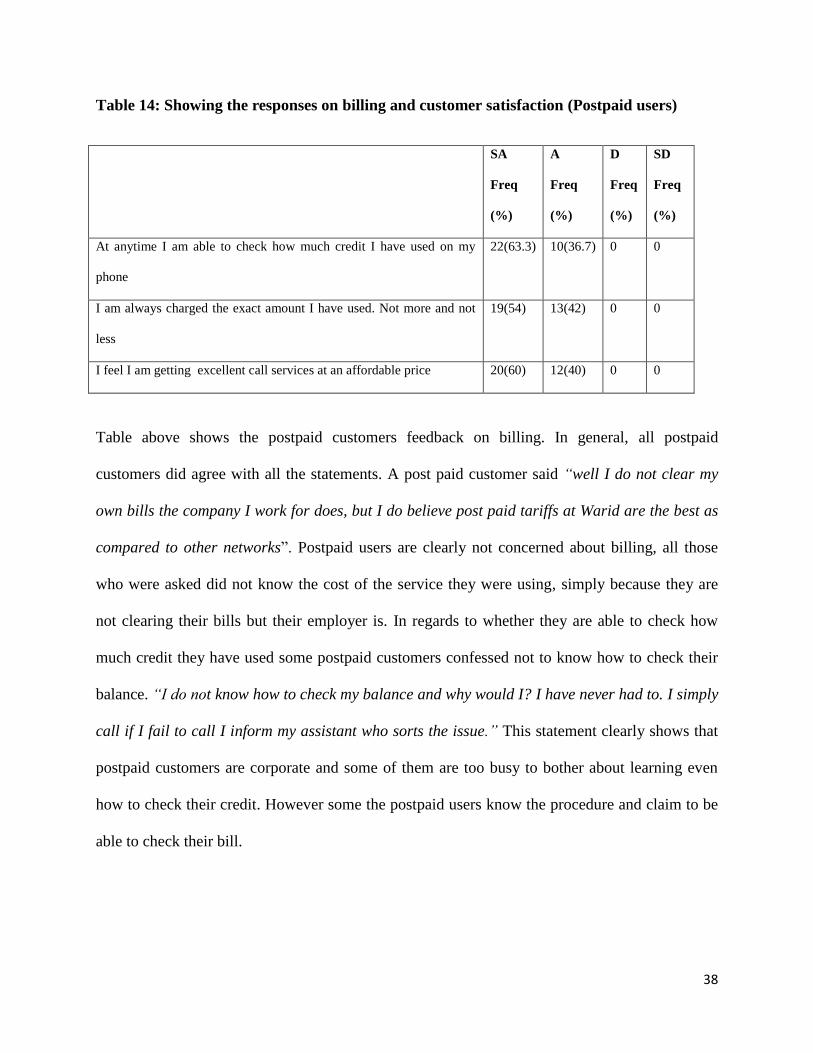
Table 14: Showing the responses on billing and customer satisfaction (Postpaid users)
SA
Freq
(%)
A
Freq
(%)
D
Freq
(%)
SD
Freq
(%)
At anytime I am able to check how much credit I have used on my
phone
22(63.3) 10(36.7) 0 0
I am always charged the exact amount I have used. Not more and not
less
19(54) 13(42) 0 0
I feel I am getting excellent call services at an affordable price 20(60) 12(40) 0 0
Table above shows the postpaid customers feedback on billing. In general, all postpaid
customers did agree with all the statements. A post paid customer said “well I do not clear my
own bills the company I work for does, but I do believe post paid tariffs at Warid are the best as
compared to other networks”. Postpaid users are clearly not concerned about billing, all those
who were asked did not know the cost of the service they were using, simply because they are
not clearing their bills but their employer is. In regards to whether they are able to check how
much credit they have used some postpaid customers confessed not to know how to check their
balance. “I do not know how to check my balance and why would I? I have never had to. I simply
call if I fail to call I inform my assistant who sorts the issue.” This statement clearly shows that
postpaid customers are corporate and some of them are too busy to bother about learning even
how to check their credit. However some the postpaid users know the procedure and claim to be
able to check their bill.
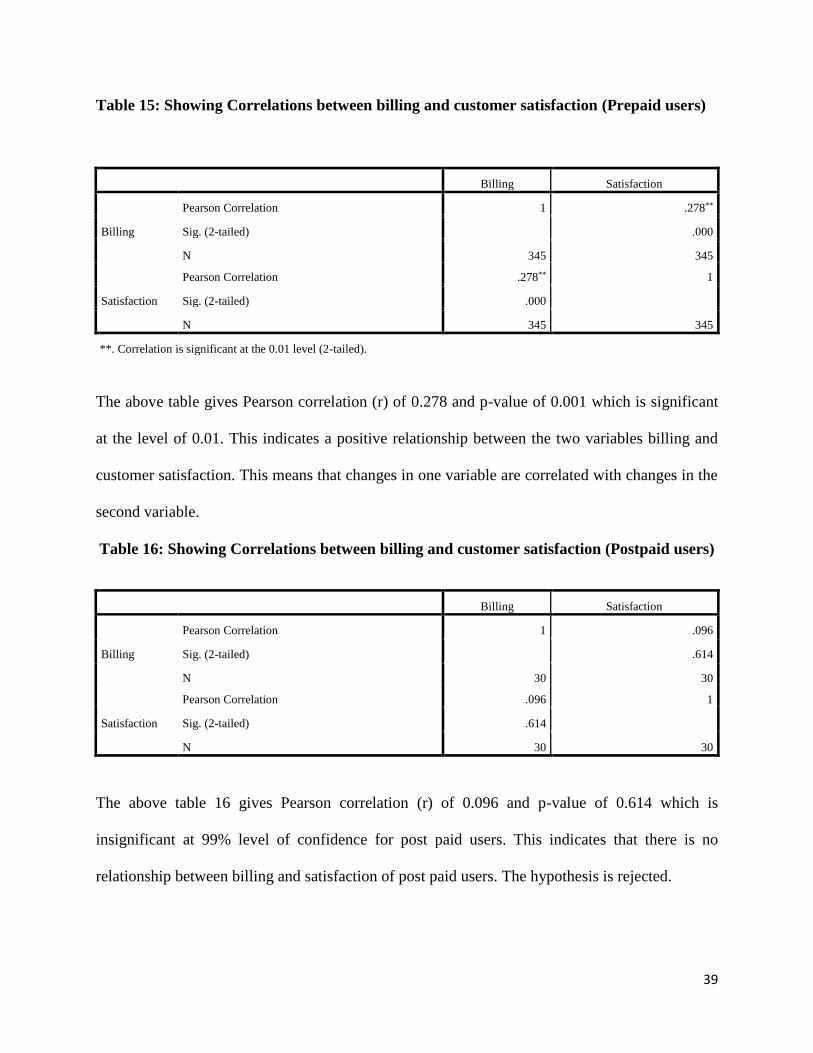
39
Table 15: Showing Correlations between billing and customer satisfaction (Prepaid users)
Billing Satisfaction
Billing
Pearson Correlation 1 .278**
Sig. (2-tailed)
.000
N 345 345
Satisfaction
Pearson Correlation .278** 1
Sig. (2-tailed) .000
N 345 345
**. Correlation is significant at the 0.01 level (2-tailed).
The above table gives Pearson correlation (r) of 0.278 and p-value of 0.001 which is significant
at the level of 0.01. This indicates a positive relationship between the two variables billing and
customer satisfaction. This means that changes in one variable are correlated with changes in the
second variable.
Table 16: Showing Correlations between billing and customer satisfaction (Postpaid users)
Billing Satisfaction
Billing
Pearson Correlation 1 .096
Sig. (2-tailed)
.614
N 30 30
Satisfaction
Pearson Correlation .096 1
Sig. (2-tailed) .614
N 30 30
The above table 16 gives Pearson correlation (r) of 0.096 and p-value of 0.614 which is
insignificant at 99% level of confidence for post paid users. This indicates that there is no
relationship between billing and satisfaction of post paid users. The hypothesis is rejected.
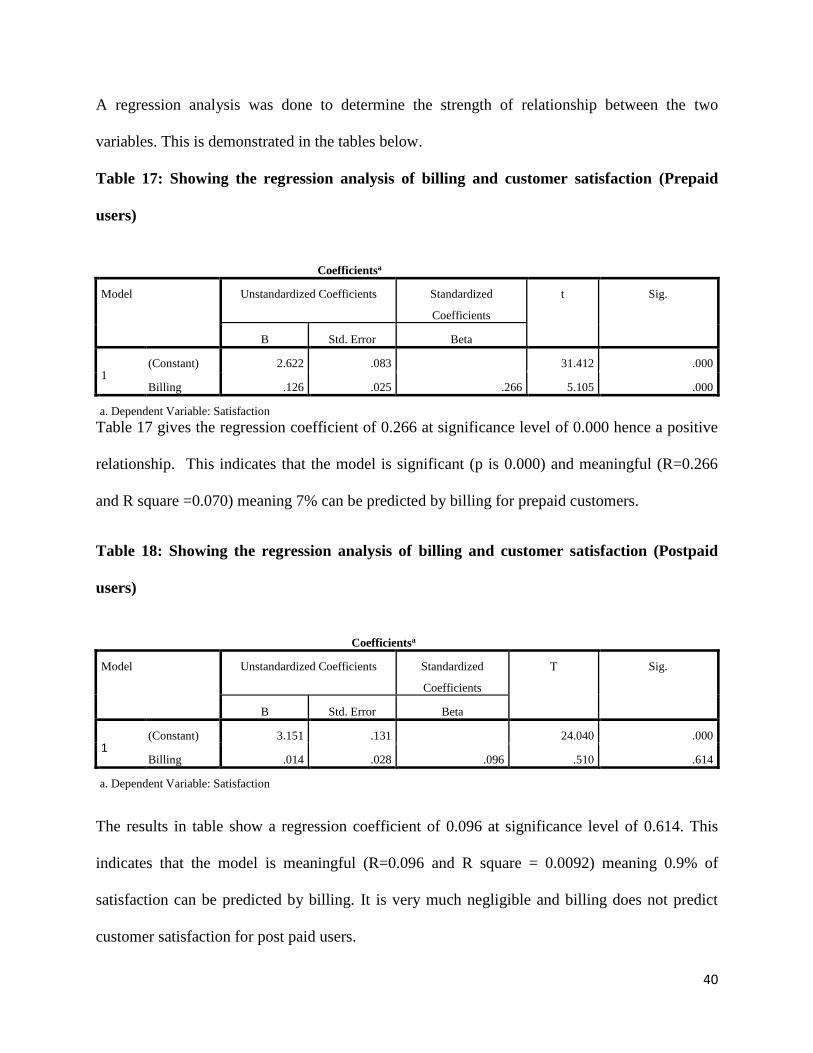
40
A regression analysis was done to determine the strength of relationship between the two
variables. This is demonstrated in the tables below.
Table 17: Showing the regression analysis of billing and customer satisfaction (Prepaid
users)
Coefficientsa
Model Unstandardized Coefficients Standardized
Coefficients
t Sig.
B Std. Error Beta
1 (Constant) 2.622 .083
31.412 .000
Billing .126 .025 .266 5.105 .000
a. Dependent Variable: Satisfaction
Table 17 gives the regression coefficient of 0.266 at significance level of 0.000 hence a positive
relationship. This indicates that the model is significant (p is 0.000) and meaningful (R=0.266
and R square =0.070) meaning 7% can be predicted by billing for prepaid customers.
Table 18: Showing the regression analysis of billing and customer satisfaction (Postpaid
users)
Coefficientsa
Model Unstandardized Coefficients Standardized
Coefficients
T Sig.
B Std. Error Beta
1 (Constant) 3.151 .131
24.040 .000
Billing .014 .028 .096 .510 .614
a. Dependent Variable: Satisfaction
The results in table show a regression coefficient of 0.096 at significance level of 0.614. This
indicates that the model is meaningful (R=0.096 and R square = 0.0092) meaning 0.9% of
satisfaction can be predicted by billing. It is very much negligible and billing does not predict
customer satisfaction for post paid users.
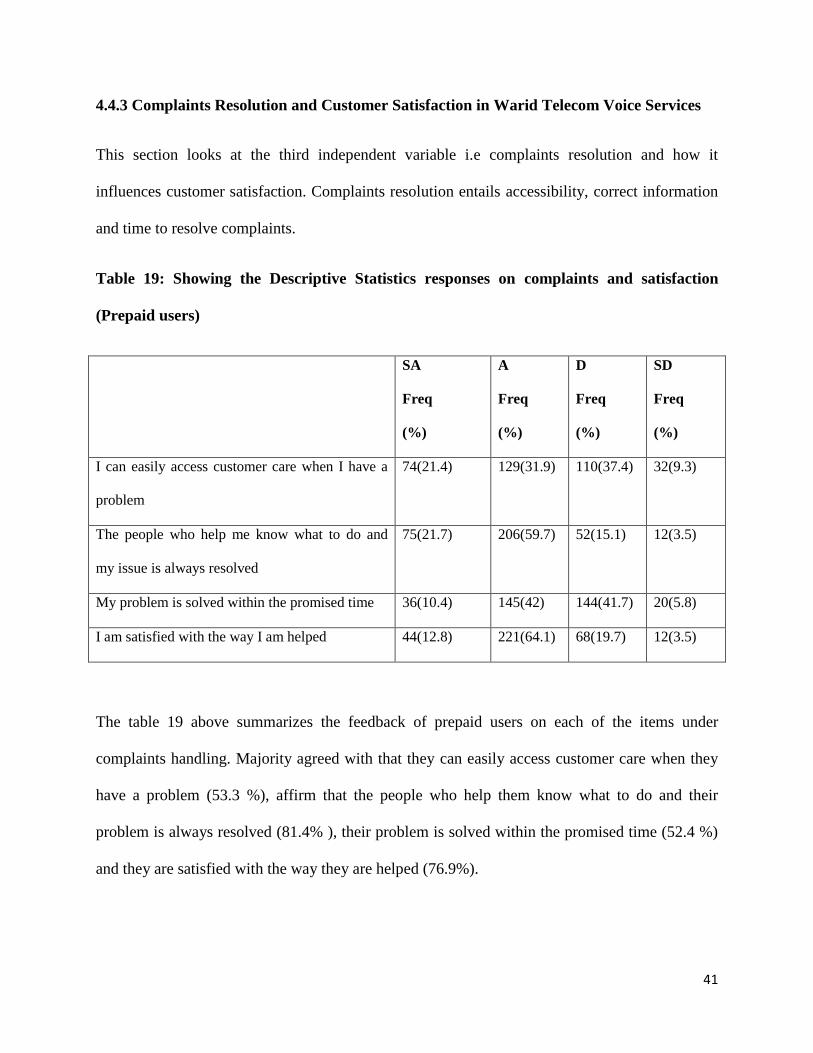
41
4.4.3 Complaints Resolution and Customer Satisfaction in Warid Telecom Voice Services
This section looks at the third independent variable i.e complaints resolution and how it
influences customer satisfaction. Complaints resolution entails accessibility, correct information
and time to resolve complaints.
Table 19: Showing the Descriptive Statistics responses on complaints and satisfaction
(Prepaid users)
SA
Freq
(%)
A
Freq
(%)
D
Freq
(%)
SD
Freq
(%)
I can easily access customer care when I have a
problem
74(21.4) 129(31.9) 110(37.4) 32(9.3)
The people who help me know what to do and
my issue is always resolved
75(21.7) 206(59.7) 52(15.1) 12(3.5)
My problem is solved within the promised time 36(10.4) 145(42) 144(41.7) 20(5.8)
I am satisfied with the way I am helped 44(12.8) 221(64.1) 68(19.7) 12(3.5)
The table 19 above summarizes the feedback of prepaid users on each of the items under
complaints handling. Majority agreed with that they can easily access customer care when they
have a problem (53.3 %), affirm that the people who help them know what to do and their
problem is always resolved (81.4% ), their problem is solved within the promised time (52.4 %)
and they are satisfied with the way they are helped (76.9%).
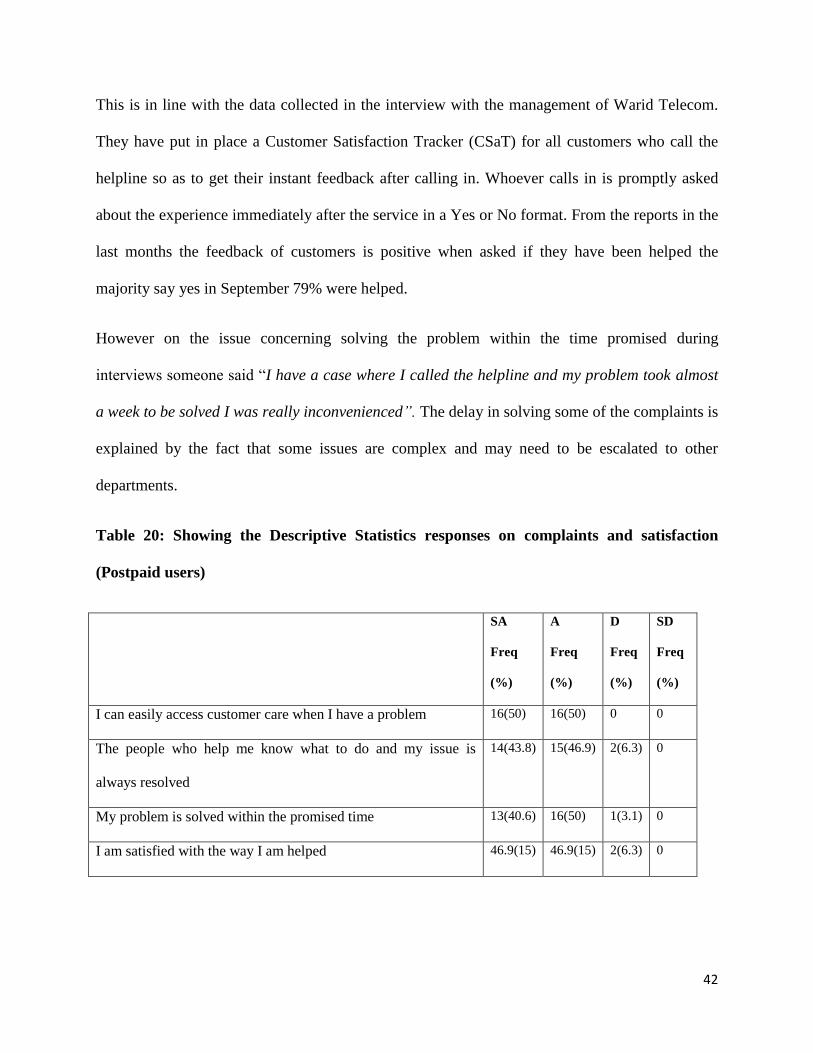
42
This is in line with the data collected in the interview with the management of Warid Telecom.
They have put in place a Customer Satisfaction Tracker (CSaT) for all customers who call the
helpline so as to get their instant feedback after calling in. Whoever calls in is promptly asked
about the experience immediately after the service in a Yes or No format. From the reports in the
last months the feedback of customers is positive when asked if they have been helped the
majority say yes in September 79% were helped.
However on the issue concerning solving the problem within the time promised during
interviews someone said “I have a case where I called the helpline and my problem took almost
a week to be solved I was really inconvenienced”. The delay in solving some of the complaints is
explained by the fact that some issues are complex and may need to be escalated to other
departments.
Table 20: Showing the Descriptive Statistics responses on complaints and satisfaction
(Postpaid users)
SA
Freq
(%)
A
Freq
(%)
D
Freq
(%)
SD
Freq
(%)
I can easily access customer care when I have a problem 16(50) 16(50) 0 0
The people who help me know what to do and my issue is
always resolved
14(43.8) 15(46.9) 2(6.3) 0
My problem is solved within the promised time 13(40.6) 16(50) 1(3.1) 0
I am satisfied with the way I am helped 46.9(15) 46.9(15) 2(6.3) 0
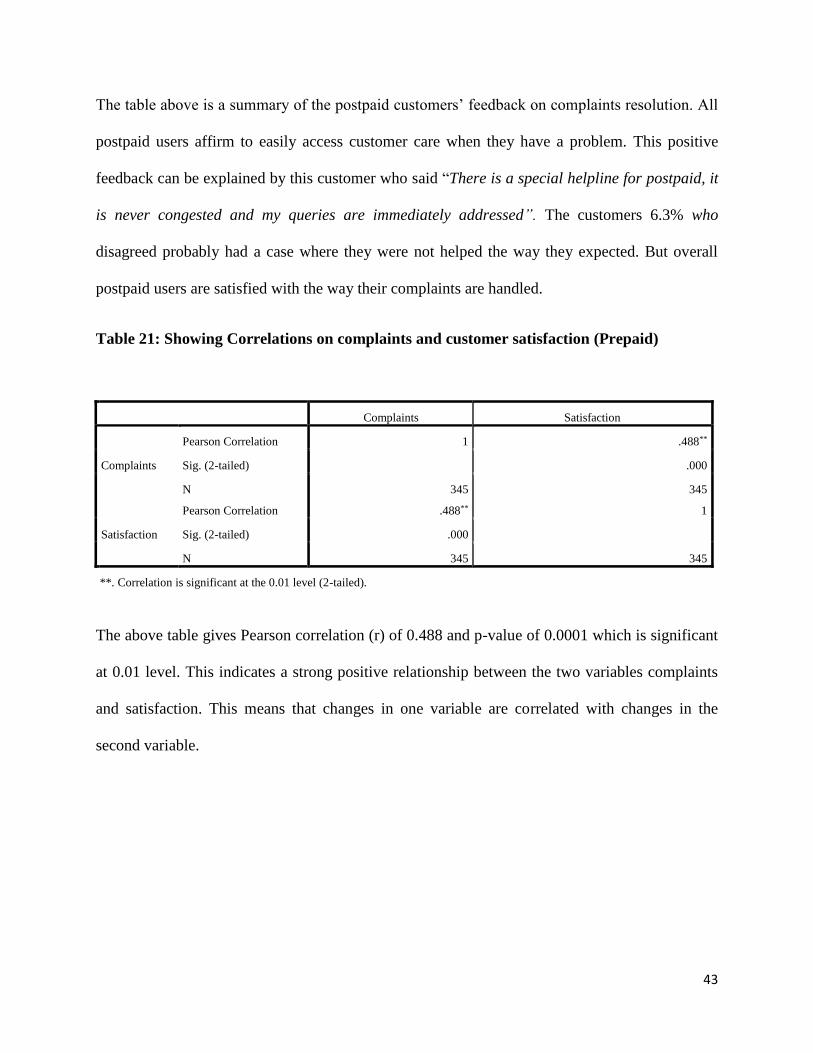
43
The table above is a summary of the postpaid customers’ feedback on complaints resolution. All
postpaid users affirm to easily access customer care when they have a problem. This positive
feedback can be explained by this customer who said “There is a special helpline for postpaid, it
is never congested and my queries are immediately addressed”. The customers 6.3% who
disagreed probably had a case where they were not helped the way they expected. But overall
postpaid users are satisfied with the way their complaints are handled.
Table 21: Showing Correlations on complaints and customer satisfaction (Prepaid)
Complaints Satisfaction
Complaints
Pearson Correlation 1 .488**
Sig. (2-tailed)
.000
N 345 345
Satisfaction
Pearson Correlation .488** 1
Sig. (2-tailed) .000
N 345 345
**. Correlation is significant at the 0.01 level (2-tailed).
The above table gives Pearson correlation (r) of 0.488 and p-value of 0.0001 which is significant
at 0.01 level. This indicates a strong positive relationship between the two variables complaints
and satisfaction. This means that changes in one variable are correlated with changes in the
second variable.
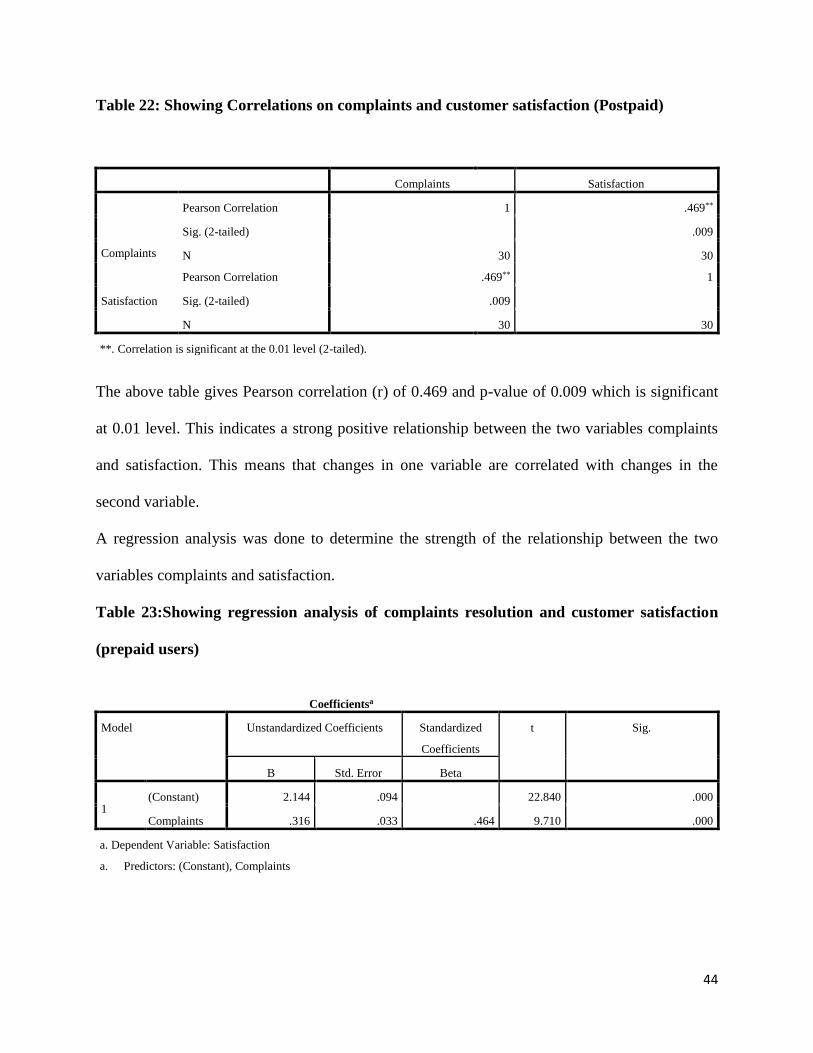
44
Table 22: Showing Correlations on complaints and customer satisfaction (Postpaid)
Complaints Satisfaction
Complaints
Pearson Correlation 1 .469**
Sig. (2-tailed)
.009
N 30 30
Satisfaction
Pearson Correlation .469** 1
Sig. (2-tailed) .009
N 30 30
**. Correlation is significant at the 0.01 level (2-tailed).
The above table gives Pearson correlation (r) of 0.469 and p-value of 0.009 which is significant
at 0.01 level. This indicates a strong positive relationship between the two variables complaints
and satisfaction. This means that changes in one variable are correlated with changes in the
second variable.
A regression analysis was done to determine the strength of the relationship between the two
variables complaints and satisfaction.
Table 23:Showing regression analysis of complaints resolution and customer satisfaction
(prepaid users)
Coefficientsa
Model Unstandardized Coefficients Standardized
Coefficients
t Sig.
B Std. Error Beta
1 (Constant) 2.144 .094
22.840 .000
Complaints .316 .033 .464 9.710 .000
a. Dependent Variable: Satisfaction
a. Predictors: (Constant), Complaints
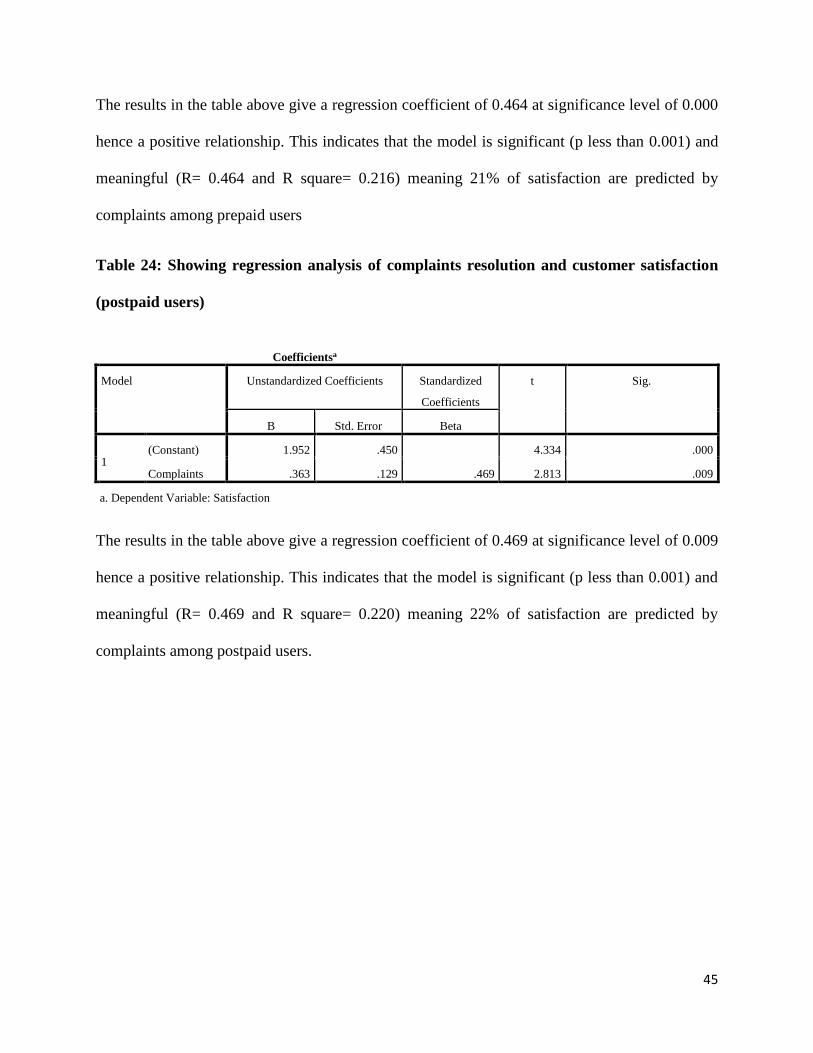
45
The results in the table above give a regression coefficient of 0.464 at significance level of 0.000
hence a positive relationship. This indicates that the model is significant (p less than 0.001) and
meaningful (R= 0.464 and R square= 0.216) meaning 21% of satisfaction are predicted by
complaints among prepaid users
Table 24: Showing regression analysis of complaints resolution and customer satisfaction
(postpaid users)
Coefficientsa
Model Unstandardized Coefficients Standardized
Coefficients
t Sig.
B Std. Error Beta
1 (Constant) 1.952 .450
4.334 .000
Complaints .363 .129 .469 2.813 .009
a. Dependent Variable: Satisfaction
The results in the table above give a regression coefficient of 0.469 at significance level of 0.009
hence a positive relationship. This indicates that the model is significant (p less than 0.001) and
meaningful (R= 0.469 and R square= 0.220) meaning 22% of satisfaction are predicted by
complaints among postpaid users.
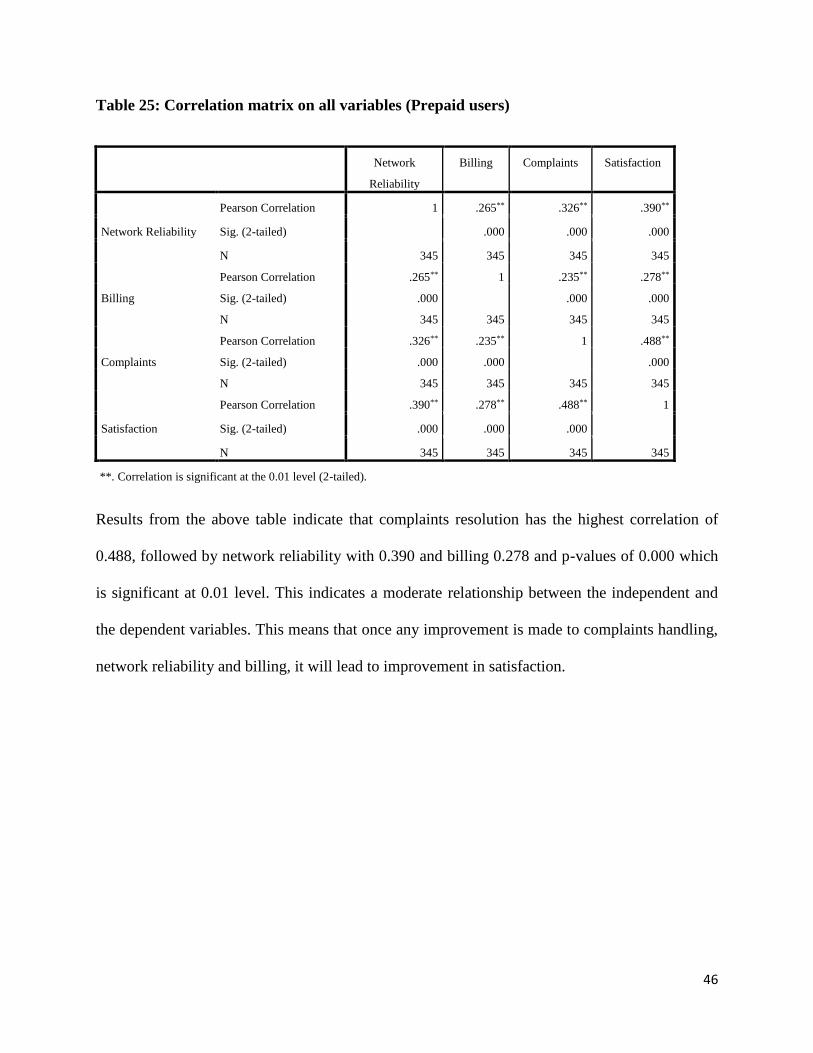
46
Table 25: Correlation matrix on all variables (Prepaid users)
Network
Reliability
Billing Complaints Satisfaction
Network Reliability
Pearson Correlation 1 .265** .326** .390**
Sig. (2-tailed)
.000 .000 .000
N 345 345 345 345
Billing
Pearson Correlation .265** 1 .235** .278**
Sig. (2-tailed) .000
.000 .000
N 345 345 345 345
Complaints
Pearson Correlation .326** .235** 1 .488**
Sig. (2-tailed) .000 .000
.000
N 345 345 345 345
Satisfaction
Pearson Correlation .390** .278** .488** 1
Sig. (2-tailed) .000 .000 .000
N 345 345 345 345
**. Correlation is significant at the 0.01 level (2-tailed).
Results from the above table indicate that complaints resolution has the highest correlation of
0.488, followed by network reliability with 0.390 and billing 0.278 and p-values of 0.000 which
is significant at 0.01 level. This indicates a moderate relationship between the independent and
the dependent variables. This means that once any improvement is made to complaints handling,
network reliability and billing, it will lead to improvement in satisfaction.
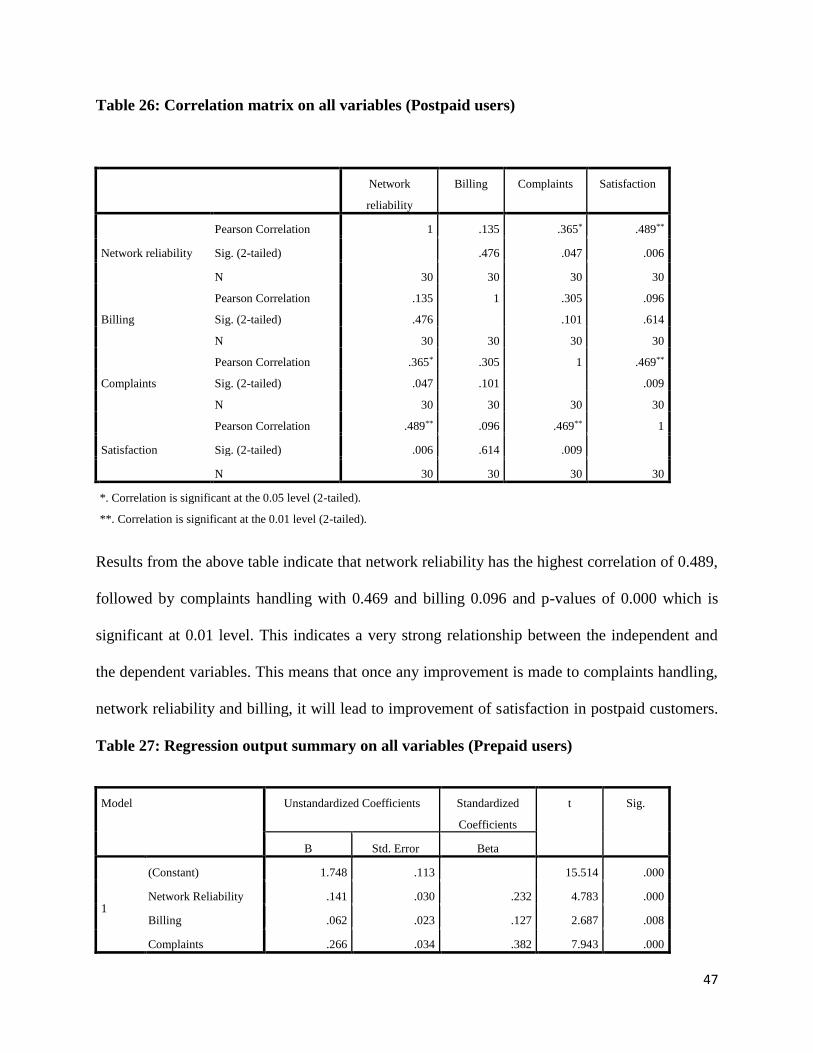
47
Table 26: Correlation matrix on all variables (Postpaid users)
Network
reliability
Billing Complaints Satisfaction
Network reliability
Pearson Correlation 1 .135 .365* .489**
Sig. (2-tailed)
.476 .047 .006
N 30 30 30 30
Billing
Pearson Correlation .135 1 .305 .096
Sig. (2-tailed) .476
.101 .614
N 30 30 30 30
Complaints
Pearson Correlation .365* .305 1 .469**
Sig. (2-tailed) .047 .101
.009
N 30 30 30 30
Satisfaction
Pearson Correlation .489** .096 .469** 1
Sig. (2-tailed) .006 .614 .009
N 30 30 30 30
*. Correlation is significant at the 0.05 level (2-tailed).
**. Correlation is significant at the 0.01 level (2-tailed).
Results from the above table indicate that network reliability has the highest correlation of 0.489,
followed by complaints handling with 0.469 and billing 0.096 and p-values of 0.000 which is
significant at 0.01 level. This indicates a very strong relationship between the independent and
the dependent variables. This means that once any improvement is made to complaints handling,
network reliability and billing, it will lead to improvement of satisfaction in postpaid customers.
Table 27: Regression output summary on all variables (Prepaid users)
Model Unstandardized Coefficients Standardized
Coefficients
t Sig.
B Std. Error Beta
1
(Constant) 1.748 .113
15.514 .000
Network Reliability .141 .030 .232 4.783 .000
Billing .062 .023 .127 2.687 .008
Complaints .266 .034 .382 7.943 .000
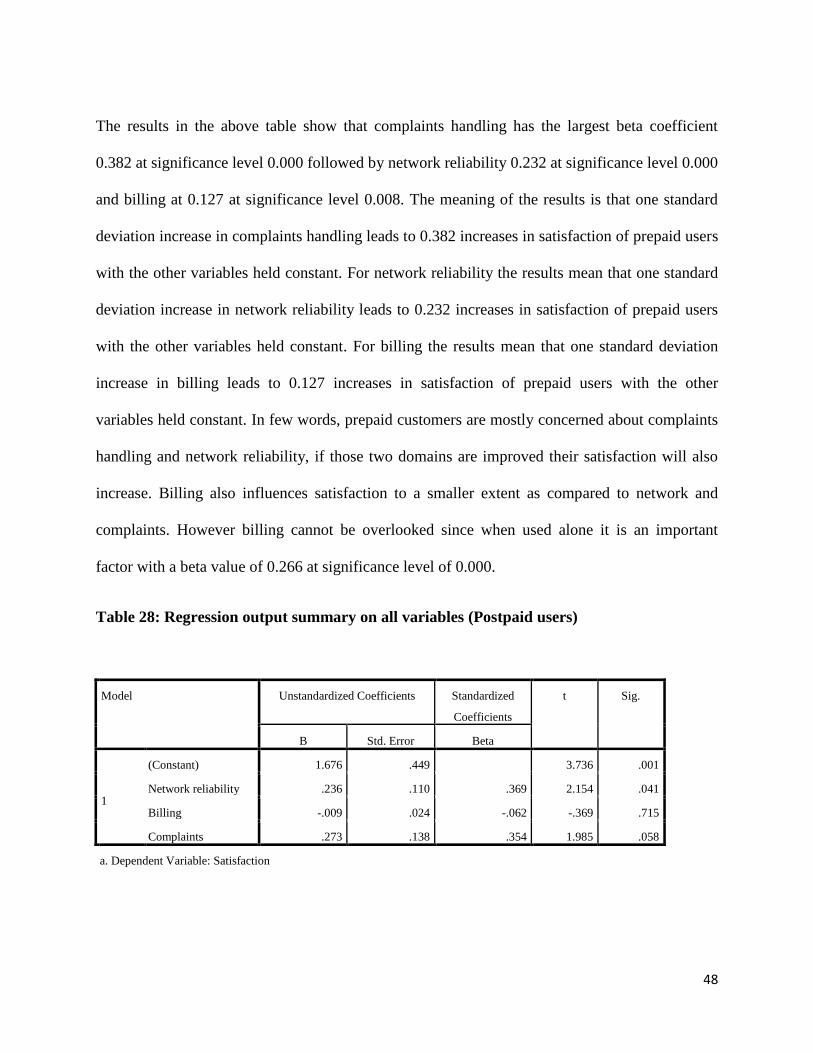
48
The results in the above table show that complaints handling has the largest beta coefficient
0.382 at significance level 0.000 followed by network reliability 0.232 at significance level 0.000
and billing at 0.127 at significance level 0.008. The meaning of the results is that one standard
deviation increase in complaints handling leads to 0.382 increases in satisfaction of prepaid users
with the other variables held constant. For network reliability the results mean that one standard
deviation increase in network reliability leads to 0.232 increases in satisfaction of prepaid users
with the other variables held constant. For billing the results mean that one standard deviation
increase in billing leads to 0.127 increases in satisfaction of prepaid users with the other
variables held constant. In few words, prepaid customers are mostly concerned about complaints
handling and network reliability, if those two domains are improved their satisfaction will also
increase. Billing also influences satisfaction to a smaller extent as compared to network and
complaints. However billing cannot be overlooked since when used alone it is an important
factor with a beta value of 0.266 at significance level of 0.000.
Table 28: Regression output summary on all variables (Postpaid users)
Model Unstandardized Coefficients Standardized
Coefficients
t Sig.
B Std. Error Beta
1
(Constant) 1.676 .449
3.736 .001
Network reliability .236 .110 .369 2.154 .041
Billing -.009 .024 -.062 -.369 .715
Complaints .273 .138 .354 1.985 .058
a. Dependent Variable: Satisfaction
49
The results in the above table shows that network reliability has the largest beta coefficient 0.369
at significance level 0.041 followed by complaints handling 0.354 at significance level 0.058 and
billing at - 0.62 at significance level 0.715. The meaning of the results is that one standard
deviation increase in network reliability leads to 0.369 increase in satisfaction of postpaid users
with the other variables held constant. In regards to complaints resolution the results mean that
one standard deviation increase in complaints resolution leads to 0.354 increases in satisfaction
of postpaid users with the other variables held constant. For billing the beta coefficient is
negative – 0.062. This means that one standard deviation increase in billing leads to 0.062
decreases in satisfaction of postpaid customers with the other variables held constant. This means
that network reliability and complaints at significance level of 0.041 and 0.058 respectively are
important factors in predicting customer satisfaction while billing at significance level of 0.715
seems to indicate that billing is not an important factor in predicting customer satisfaction when
all three variables are used in combination. This indicates that if customer satisfaction is to
improve network and complaints should be given very high attention. However billing should
not be neglected since when used alone it is an important factor with a beta value of 0.096 at
significance level of 0.000.
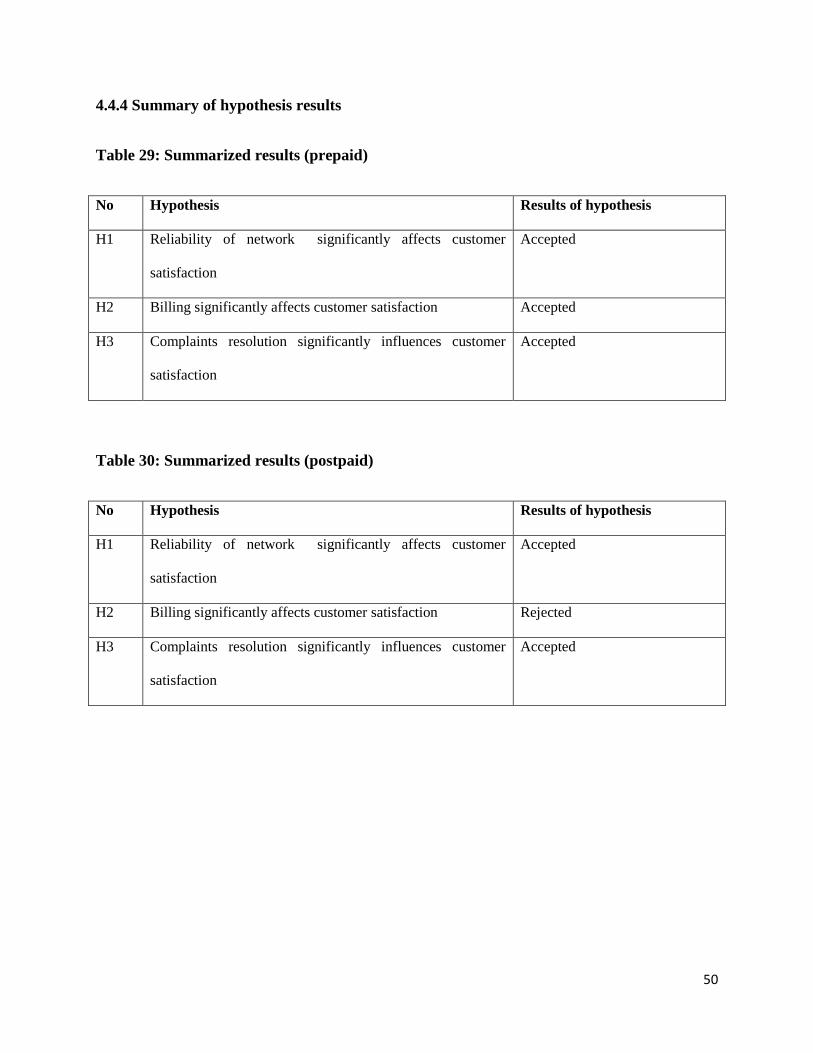
50
4.4.4 Summary of hypothesis results
Table 29: Summarized results (prepaid)
No Hypothesis Results of hypothesis
H1 Reliability of network significantly affects customer
satisfaction
Accepted
H2 Billing significantly affects customer satisfaction Accepted
H3 Complaints resolution significantly influences customer
satisfaction
Accepted
Table 30: Summarized results (postpaid)
No Hypothesis Results of hypothesis
H1 Reliability of network significantly affects customer
satisfaction
Accepted
H2 Billing significantly affects customer satisfaction Rejected
H3 Complaints resolution significantly influences customer
satisfaction
Accepted
51
CHAPTER FIVE
SUMMARY, DISCUSSION, CONCLUSIONS AND RECOMMENDATIONS
5.1 Introduction
This chapter presents the summary of findings as well as the discussion, conclusion and
recommendations based on the study objectives. It also presents the areas that require further
research.
5.2 Summary of findings
5.2.1 Network reliability and customer satisfaction
The analysis of the research results indicated that network reliability has a statistically significant
effect on customer satisfaction with a correlation coefficient of 0.390 (prepaid) and 0.489
(postpaid) and significance levels respectively of 0.000 and 0.006. The R/beta and R 2 values
indicated that network reliability is an important factor in predicting customer satisfaction.
The descriptive results from prepaid customers show that the majority of respondents agreed to
have network coverage and that their calls go through and are not cut off during communication.
Majority also agreed to have calls clarity. However, more than 50% disagreed to be satisfied
with the quality of the network. This contradiction could mean that there is another element of
network reliability that is being under looked. It was confirmed with the interview comments
whereby respondents expressed their incomprehension when trying to make calls and being
answered that the lines they are calling are off some customers wondered whether this was to do
with their telephones or poor network. This high rate of disagreement could also mean that users
are not satisfied because they compare Warid Telecom network to other networks present in
Uganda. This means that the competitors of Warid could have set the standards very high hence
52
raising the expectations of customers in terms of network quality. On the other side the
management of Warid Telecom recognises having challenges with the network this because
capacity sites are few and upgrades are being run on a regular basis hence disrupting the quality
of network.
5.2.2 Billing and customer satisfaction
The analysis of the research results indicated that billing has a statistically significant effect on
customer satisfaction with a correlation coefficient of 0.278 (prepaid) and 0.096 (postpaid) and
significance levels respectively of 0.000 and 0.614. The R/beta and R 2 values indicated that
billing is an important factor in predicting customer satisfaction.
The descriptive results from prepaid customers show that the majority of respondents agreed to
be able to check the credit they have used, they also agreed to being charged the correct amount
and confirm getting excellent call services at an affordable price. This is justified by the many
promotions on calls availed to the public. Postpaid users also agreed at more than 90% to all the
statements and said to be satisfied. The high percentage is simply explained by the fact that
postpaid users do not clear their bills since the postpaid services are contracted by employers.
During interviews it was also noticed that most of the postpaid customers do not even know the
cost of the service they are using. Overall, billing satisfies the majority of Warid Telecom users.
5.2.2 Complaints resolution and customer satisfaction
The analysis of the research results indicated that complaints resolution has a statistically
significant effect on customer satisfaction with a correlation coefficient of 0.488 (prepaid) and
0.469 (postpaid) and significance levels respectively of 0.000 and 0.009. The R/beta and R 2
values indicated that complaints resolution is an important factor in predicting customer
satisfaction.
53
The descriptive results from prepaid customers show that the majority of respondents agreed to
be able to access customer care help desk, to be helped and their problem is solved within the
promised time. The majority also agreed to be satisfied with the way they are helped. The
postpaid users agreed at more than 90% to all the statements and said to be satisfied with the
process of complaints resolution. The high percentage of agreement is simply explained through
the fact that postpaid users have a dedicated help line which is never congested unlike prepaid
users and their queries are given priority. Also this can be explained by the fact that postpaid
users are very few.
5.3 Discussion
5.3.1 Reliability of network and customer satisfaction
The objective was to establish the effect of network reliability on customer satisfaction of Warid
Telecom voice services. The findings showed a significant positive relationship and that network
reliability is an important factor in customer satisfaction. This implies that if network is
improved, satisfaction of prepaid customers increases. Also postpaid customers feel strongly that
network reliability should be improved so as to increase their satisfaction.
These findings place network reliability as a priority area that needs to be urgently improved for
all users. This is in line with a number of scholars who state that network reliability is an element
of service quality and has to meet and exceed the customers’ expectations (Cronin and Taylor,
1992; Zeithaml, Berry and Parasuraman, 1993) and that it is an important indicator of customer
satisfaction (Spreng and Machoy, 1996). The results of the findings agree with Chau and Kao
(2009) who found a positive relationship between service quality and the satisfaction of the
54
customers. The service quality includes the system reliability which here refers to network
reliability.
The current findings are opposed to the findings of Turban (2002) that the price of the service is
more important than the quality of the service. This is not the case for this particular study
considering the quality of network was ranked as number one in influencing satisfaction. Even
prepaid users who clear their bills on a daily basis are more concerned with the stability and
quality of the network more than anything else. However it’s the postpaid users who feel more
strongly about the quality of the network which was not a surprise considering most of them are
corporate users with fewer constraints as compared to prepaid. Indeed Iqbal et al (2009) state that
postpaid customers are even more satisfied with their services as compared to prepaid
considering they do not face challenges for example while loading credit cards. But still the
study findings align with that of Fornell, Johnson, Anderson, Cha and Bryant (1996) who found
out that customer satisfaction is more quality driven than value or price driven.
5.3.2 Billing and customer satisfaction
In regards to billing, the scholars who researched on the relationship between billing and user’s
satisfaction claim a positive relationship between the two variables as found in this study. That is
the case of Parvez (2005) who identified a strong relationship and even recommended that in
order to increase the share; the call rate and connection fee should be reduced. Sindhu (2002)
adds to the same saying that billing is a great factor of satisfaction and customers can switch if
price is high or deemed unfair.
The view of the prepaid respondents suggested that billing was an important driver of their
satisfaction. There is a significant and positive relationship between the two variables. On the
55
other hand postpaid users proved not to be concerned by billing. This contradicts the findings of
Sindhu (2002) since for postpaid users increase of price may not necessarily result in switching
to another provider. Considering the current findings, we can say that although billing is one of
the elements that influence satisfaction there are other factors that have deeper impact on
satisfaction of users.
5.3.3 Complaints resolution and customer satisfaction
The findings of this study revealed that improved complaints resolution is the second most
important cause to satisfaction. The better the complaints are handled the more the users are
satisfied. The response rate in regards to the state of complaints resolution shows that most
respondents agree to be satisfied with the way their complaints are handled hence increase in
overall satisfaction. Palkar’s (2004) findings fall in line with the findings of this research. In fact
Palkar determined that the service support or complaints handling appeared to be an important
element of cellular service if we are to improve customer satisfaction.
5.4 Conclusions
5.4.1 Network reliability and customer satisfaction
The results of this study suggest that the network of Warid Telecom is not often reliable even in
the vicinity of Kampala where this study was conducted. The significant positive relationship
between network reliability and customer satisfaction for both prepaid and postpaid proves that
the reliability of the network has a lot of influence on customer satisfaction. Network should be
given uttermost urgency if customer satisfaction is to be achieved. There is need for improved
technology so as to meet the customers’ expectations this will create a sense of loyalty
considering users will be able to entirely rely on the Warid network to make their calls.
56
5.4.2 Billing and customer satisfaction
The significant positive relationship between billing and customer satisfaction for both prepaid
and postpaid proves that billing has weak influence on customer satisfaction and the users are
satisfied with the affordability of the voice calls thanks to the many promotions offered.
Although postpaid users are not bothered with the element of billing their employers are
definitely careful hence need to maintain competitive charges.
5.4.3 Complaints resolution and customer satisfaction
The significant positive relationship between complaints resolution and customer satisfaction for
both prepaid and postpaid proves that complaints resolution has a moderate influence on
customer satisfaction. The study established that the complaints handling system seems to be
highly appreciated by both prepaid and postpaid users although the congestion of the helpline at
times makes it challenging for prepaid callers as well as the time taken to solve the issue.
5.5. Recommendations
Based on the findings of this survey, the following are recommended.
5.5.1 Network reliability and customer satisfaction
Management should invest in the latest technology and if possible acquire new capacity sites all
over the country to cover and retain the ever growing number of subscribers. In addition
management should give clear communication to customers whenever there is a network outage
to avoid confusion.
57
5.5.2 Billing and customer satisfaction
Warid is known for having the most affordable on net (Warid to warid) tariffs coupled with a
variety of innovative promotions. It is therefore recommended that more research be conducted
to evaluate how the many offers influence the satisfaction of users.
5.5.3 Complaints handling and customer satisfaction
The complaints handling system should be given even more attention considering its one way the
company interacts with the subscribers. The management should ensure that the helpline is not
congested by offering multiple lines to callers or recruit more agents if this can make the traffic
less busy.
5.6. AREAS OF FURTHER RESEARCH
There is need to research on other factors affecting customer satisfaction of WTU other than
network reliability, complaints and billing.
It would be interesting to also conduct a comparative study on customer satisfaction of all
telecom companies of Uganda and see how they can benefit from each other.
58
REFERENCE LIST
Amin, M. E. (2005). Social Science Research: Conception, Methodology and Analysis. Kampala:
Makerere University Press.
Akkas, O., Ucar, B., et al (2010). Measuring Customer satisfaction in Turk Telekom using
structural equation modeling technique. Journal of Global Strategic Management, 89
Bell, J. (1999). Doing your research project: a guide for first time researchers in education and
social science (3rd ed.). Buckingham, Philadelphia: Open University Press.
Hayes, B.E. (1998). Measuring Customer Satisfaction. Survey Design, Use and Statistical
Analysis Methods, 2nd Edition.
Burns, R. (2000). Introduction to Research Methods. Sage, London
Bishop, W.R.Jr. (1984). Competitive intelligence. Progressive Grocer, 63(3), 19-20.
Churchill,G., and Suprenant, C. (1982).An investigation into the determinants of customer
satisfaction, Journal of Marketing Research
Communications Act 1997 (Ug.)
Creswell, W J. Et al. (2004) Designing a Mixed Methods Study in Primary care. Department of
Educational Psychology, University of Nebraska- Lincoln, Lincoln, Neb
Econ One Research, Inc. In association with ESG International (July 2002), Uganda
59
Telecommunications a case study in the Private Provision of Rural Infrastructure
Fornell,C. (1996). American Customer Satisfaction Index Model. Retrieved June, 2012, from
www.theacsi.org
Fornell, C., Johnson, W.Anderson, Cha &Bryant (1996). The American Customer Satisfaction
Index: Nature, Purpose and Findings. Journal of Marketing 60,4 pg.7
Fornell, C. and Warnerfelt, B. (1987). Defensive marketing strategy by customer compliant
management; a theoretical analysis. Journal of Marketing Research, 24 pp.337-346
Gerpott, T., Rams, W., & Schindler, A. (2001). Customer retention, loyalty, and satisfaction in
the German mobile cellular telecommunications market. Telecommunication Policy,
25(4), 249–269.
Gerson, R.F. (1993). Measuring customer satisfaction: A guide to managing quality service,
Crisp Publications, Menlo Park.
Lee, J., Lee, J., & Freick, L. (2001). The impact of switching costs on the customer satisfaction
loyalty link: Mobile phone service in France. Journal of Services Marketing, 15(1),35-48.
Lee, M., & Cunningham, L. F. (2001). A cost/benefit approach to understanding service loyalty.
Journal of Services Marketing, 15(2), 113–130.
Lool. B.V, Gemmel. P and Dierdonk R.V (2003), Services Management: An integrated
Approach , 2nd Edition
60
Lin, H.H., &Wang, Y.S. (2006). An examination of the determinants of customer loyalty in
mobile commerce contexts. Information& Management, 43(3), 271- 282
Mugenda, O.M.&Mugenda,A.G (1999). Research methods: Quantitative and Qualitative
Approaches. Nairobi:African Centre of Technology Studies.
Moon-Koo, K, Myeong-Cheol, P. & Dong-Heon,J (2004) The effects of customer
satisfaction and switching barrier on customer loyalty in Korean mobile
telecommunication services
Nitecki, D. A. and Hernon,P (2000), Measuring service quality at Yale University’s libraries,
Journal of Academic Librarianship, Vol. 26 (4), pp.259-273
OJo, O. (2010), The Relationship Between Service Quality and Customer Satisfaction in the
Telecommunication Industry: Evidence from Nigeria
Oyeniyi, T. Omatayo, S. & Abiodun, A. (2008), Customer Service in the Retention of Mobile
Phone users in Nigeria.
Oliver, R.L. (1980) A cognitive model of antecedents and consequences of satisfaction decisions.
Journal of Marketing Research, 17(4 November), 469-9
Oliver R.L. & DeSabro, W.S.(1988). Response determinant in satisfaction judgement. Journal of
consumer research 14 149-507
61
Parasuraman, A., Zeithamal, V. A., & Berry, L. L. (1988). SERVQUAL: A multiple-item scale
for measuring consumer perceptions of service quality. Journal of Retailing, Vol
64(1),pp.12-40
Punch, K F. (1998). Introduction to Social Research. Sage, London
Iqbal et al. (2010), Antecedents and Outcomes of customer satisfaction in using prepaid cellular
service in Pakistan.
ITU (2003), Assessment of Telecommunication and ICT Infrastructure in Africa, ITU
Symposium, Doc 7-E. Arusha
Kotler, P. (1997). Marketing Management. Prentice-Hall, Englewood Cliffs, NJ.
Kotler, P. (1991). Marketing Management. Analysis, Planning, Implementation and Prentice-
Hall, Englewood Cliffs, NJ
Kotler, P &Clarke, T. (1987) Marketing Management. Analysis and practices, Prentice-Hall,
Englewood Cliffs, NJ
Kim, M.K.,Park, M.C.,and Jeong, D.H (2004)“ The effects of customer satisfaction and the
switching barrier on customer loyalty in Korean mobile telecommunication services.”
Telecommunication Policy.
Palkar A. (2004) “Determinants of Customer Satisfaction for Cellular Service Providers”
UDYOG PRAGATI Vol. 28, No.1
62
Parker, C. and Mathews, B. P (2001) Customer satisfaction: contrasting academic and consumers
interpretations, Marketing Intelligence &Planning, volume19, number 1,pp.38-44
Rust, R. and Zahorik, A. (1993), Customer Satisfaction, Customer Retention and Market share.
Journal of Retailing 69(2): 193-215
Sekaran, U. (2003). Research Methods for Business. A skill building approach. Southern Illinois
University at Carbondale, 4th edition.
Spreng, R.A., & Mackoy, R.D. (1996). An Empirical Examination of a Model of Perceived
Service Quality and Satisfaction. Journal of Retailing, 72(2), 201-214
Uganda Telecommunication Policy 1997 (Ug.)
UCC, (December 2011). Public Notice Report on Mobile Voice quality and consumer complaints
reports.
UCC, (2011). Post and Telecommunications Market Review 2010/2011
Wang I-M & Shiesh. C.J(April 2005), The relationship between service quality and customer
satisfaction the example of CJCU library
Westbrook, R.A. (1987). Product/ Consumption-Based Affective Responses and Post Purchase
process. Journal of Marketing Research, 24
Wesbrook, R. A. and Oliver, R.L. (1991). The dimensionality of consumption emotion pattern

63
and customer satisfaction. Journal of consumer research,18(June), pp.84-91
Zeithaml V. A and Bitner. M (2003), Services Marketing: Integrating customer focus across the
firm, 3rd Edition
64
APPENDIX 1: QUESTIONNAIRE FOR CUSTOMERS OF WTU
Dear respondent,
My name is Armella Mukorako, a student pursuing a Masters degree in management studies
(Project Planning and Management) at Uganda Management Institute. My study topic is: Factors
influencing customer satisfaction in the telecom industry in Uganda with special focus on Warid
Telecom voice services’. Your views as customers of WTU are essential for this study. Kindly
provide accurate information on the following issues to the best of your ability following the
instructions given. All the information given will be confidential and shall be used strictly for
this study. Thank you.
Section A: Background information
Circle what you feel is the most appropriate answer for you
1. Age: (1) 0 - 30
(2) 30 - 50
(3) Over 50
2. Gender: (1) Female (2) Male
3. Occupation: (1) Student (2) Employed (3) Self employed (4) Others
4. Do you use any other simcards apart from Warid?
5. If yes, from which networks?
6. How many years have you spent on the Warid network?
Section B: Kindly indicate the extent to which you agree with the following statements in every
section. Indicate your answers by ticking in the appropriate box. Key: 4-Strongly Agree (SA), 3-
Agree (A), 2-Disagree (D), 1-Strongly Disagree (SD)
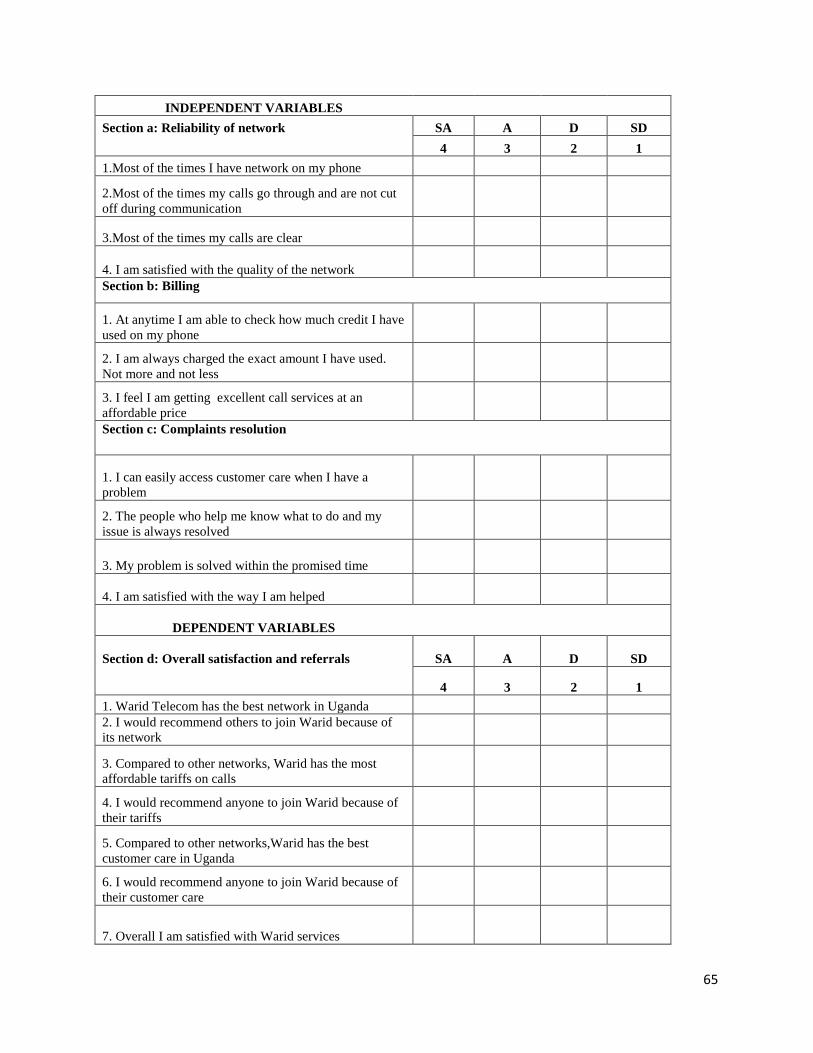
65
INDEPENDENT VARIABLES
Section a: Reliability of network SA A D SD
4 3 2 1
1.Most of the times I have network on my phone
2.Most of the times my calls go through and are not cut
off during communication
3.Most of the times my calls are clear
4. I am satisfied with the quality of the network
Section b: Billing
1. At anytime I am able to check how much credit I have
used on my phone
2. I am always charged the exact amount I have used.
Not more and not less
3. I feel I am getting excellent call services at an
affordable price
Section c: Complaints resolution
1. I can easily access customer care when I have a
problem
2. The people who help me know what to do and my
issue is always resolved
3. My problem is solved within the promised time
4. I am satisfied with the way I am helped
DEPENDENT VARIABLES
Section d: Overall satisfaction and referrals SA A D SD
4 3 2 1
1. Warid Telecom has the best network in Uganda
2. I would recommend others to join Warid because of
its network
3. Compared to other networks, Warid has the most
affordable tariffs on calls
4. I would recommend anyone to join Warid because of
their tariffs
5. Compared to other networks,Warid has the best
customer care in Uganda
6. I would recommend anyone to join Warid because of
their customer care
7. Overall I am satisfied with Warid services

66
8.I have spent more than 2 years on Warid
9.Besides Warid I use other simcards from other
networks
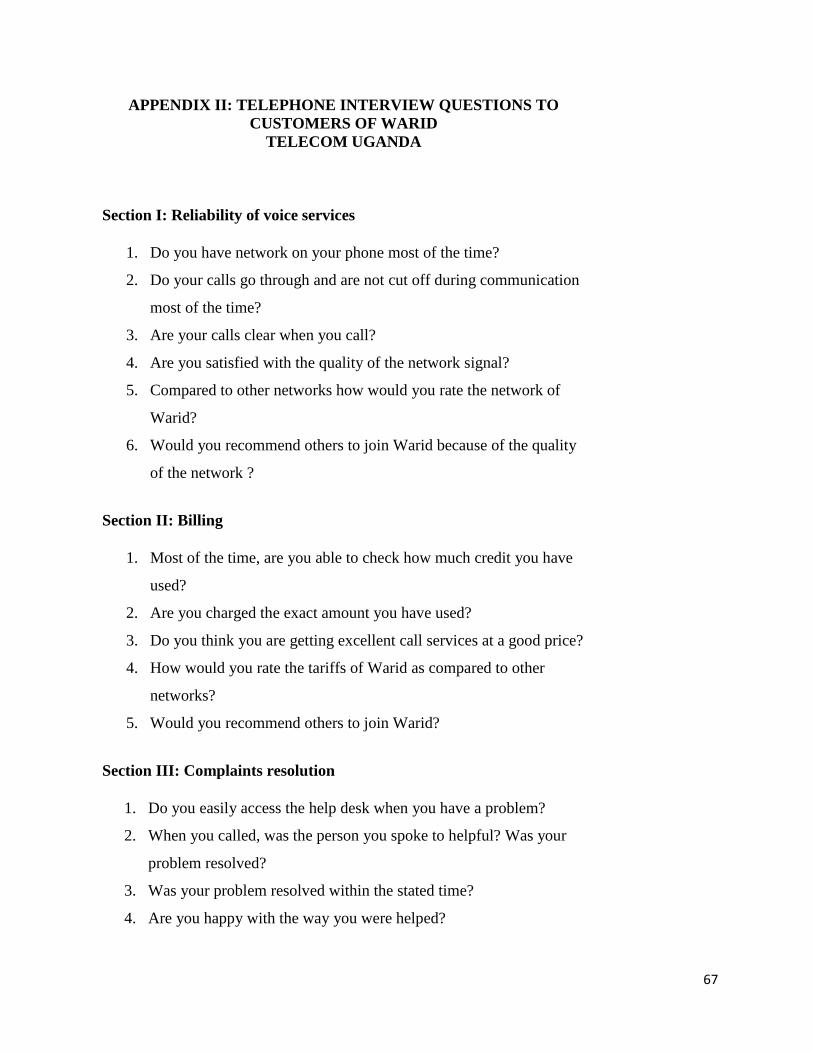
67
APPENDIX II: TELEPHONE INTERVIEW QUESTIONS TO
CUSTOMERS OF WARID
TELECOM UGANDA
Section I: Reliability of voice services
1. Do you have network on your phone most of the time?
2. Do your calls go through and are not cut off during communication
most of the time?
3. Are your calls clear when you call?
4. Are you satisfied with the quality of the network signal?
5. Compared to other networks how would you rate the network of
Warid?
6. Would you recommend others to join Warid because of the quality
of the network ?
Section II: Billing
1. Most of the time, are you able to check how much credit you have
used?
2. Are you charged the exact amount you have used?
3. Do you think you are getting excellent call services at a good price?
4. How would you rate the tariffs of Warid as compared to other
networks?
5. Would you recommend others to join Warid?
Section III: Complaints resolution
1. Do you easily access the help desk when you have a problem?
2. When you called, was the person you spoke to helpful? Was your
problem resolved?
3. Was your problem resolved within the stated time?
4. Are you happy with the way you were helped?

68
5. How would you rate the Warid help desk as compared to other
networks?
6. Would you recommend anyone to join Warid because of its
helpdesk?
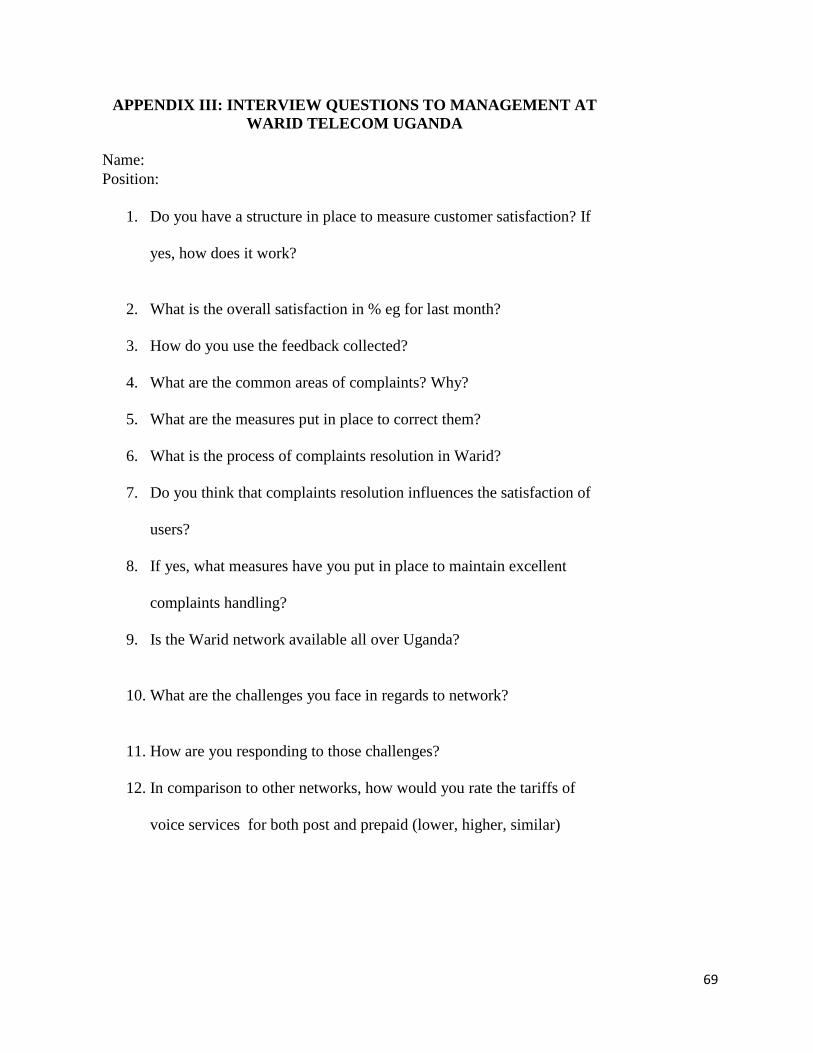
69
APPENDIX III: INTERVIEW QUESTIONS TO MANAGEMENT AT
WARID TELECOM UGANDA
Name:
Position:
1. Do you have a structure in place to measure customer satisfaction? If
yes, how does it work?
2. What is the overall satisfaction in % eg for last month?
3. How do you use the feedback collected?
4. What are the common areas of complaints? Why?
5. What are the measures put in place to correct them?
6. What is the process of complaints resolution in Warid?
7. Do you think that complaints resolution influences the satisfaction of
users?
8. If yes, what measures have you put in place to maintain excellent
complaints handling?
9. Is the Warid network available all over Uganda?
10. What are the challenges you face in regards to network?
11. How are you responding to those challenges?
12. In comparison to other networks, how would you rate the tariffs of
voice services for both post and prepaid (lower, higher, similar)
Recommended


