
1
3
5
7
9
11
13
15
17
19
21
23
25
27
29
31
33
35
37
39
41
43
45
47
49
51
53
55
57
59
61
63
65
ARTICLE IN PRESSYEESA : 3861
Ecotoxicology and Environmental Safety ] (]]]]) ]]]–]]]
Contents lists available at ScienceDirect
Ecotoxicology and Environmental Safety
0147-65
doi:10.1
� Corr
E-m
Pleasin th
journal homepage: www.elsevier.com/locate/ecoenv
Identification of toxigenic Microcystis strains after incidents of wild animalmortalities in the Kruger National Park, South Africa
Paul J. Oberholster a,�, Jan G. Myburgh b, Danny Govender c, Roy Bengis d, Anna-Maria Botha e
a CSIR Natural Resources and the Environment, P.O. Box 395, Pretoria 0001, South Africab Department of Paraclinical Sciences, Faculty of Veterinary Science, University of Pretoria, P/Bag X04, Onderstepoort 0110, South Africac South African National Parks, Veterinary Wildlife Services, P/Bag X402, Skukuza 1350, South Africad State Veterinary Investigation Center, P.O. Box 12, Skukuza 1350, Kruger National Park, South Africae Department of Genetics, University of Pretoria, Hillcrest, Pretoria ZA0002, South Africa
a r t i c l e i n f o
Article history:
Received 6 June 2008
Received in revised form
22 December 2008
Accepted 24 December 2008
Keywords:
Eutrophication
Wild animal bio-intoxication
Megaherbivores
mcy Gene cluster
Conservation areas
67
13/$ - see front matter & 2009 Elsevier Inc. A
016/j.ecoenv.2008.12.014
esponding author. Fax: +27124202954.
ail address: [email protected] (P.J. Oberh
e cite this article as: Oberholster, P.J.e Kruger.... Ecotoxicol. Environ. Saf. (
PROOF
a b s t r a c t
The eutrophic process potentially caused by a high urine and faecal load resulting from an unusually
high hippopotamus (Hippopotamus amphibious) density in the Nhlanganzwane Dam, Kruger National
Park, South Africa, triggered a chain of events characterised by an increase in the growth of primary
producers (Microcystis aeruginosa). This increase in M. aeruginosa biomass was followed by bio-
intoxication incidents in wild animals. In this study, we determine if a M. aeruginosa bloom with a total
microcystin level of 23,718mg l�1 have been responsible for mortalities of megaherbivores in the
Nhlanganzwane Dam. We further use microcystin molecular markers derived from the mcy gene cluster
to identify potentially toxigenic environmental Microcystis strains in the dam during the occurrence of
animal intoxications. The estimated total microcystin-LR daily intake by an adult male white rhinoceros
(Ceratotherium simum) from cyanobacterial-contaminated water of the dam during the toxic event was
an order of magnitude higher (754.29mg kg�1 bw) in comparison with the lowest observed adverse
effecting level (LOAEL) value measured for pigs in a previous study by other authors. In this study the
presence of toxic cyanobacterial strains was confirmed with the use of molecular markers that detected
the presence of the mcy gene cluster responsible for the production of toxin by M. aeruginosa.
& 2009 Elsevier Inc. All rights reserved.
D E 6971
73
75
77
79
81
83
85
87
89
UNCORRECT1. Introduction
Eutrophication is the natural ageing process of lakes. It ischaracterized by a geologically slow shift from in-lake biologicalproduction driven by allochthonous loading of nutrients, toproduction driven by autochthonous processes. This typicallyslow process over centuries can be greatly accelerated to withindecades by human intervention in the natural biogeochemicalcycling of nutrients within a watershed (Rast and Thornton, 1996).This eutrophication is mainly caused by the addition of nutrientsfrom human activities, called in this context, anthropogeniceutrophication. The phenomenon is generally a consequence ofintensive agricultural and industrial activities and the develop-ment of large sewage systems associated with large metropolitanareas (Pitois et al., 2001). Although there are a few previousstudies that indicate eutrophication (over-enrichment) as a directconsequence of resident animals, fish and birds in freshwaterbodies (Bomchul et al., 2001; Oberholster and Botha, 2007), littleis known about eutrophication as a result of megaherbivores on
91
ll rights reserved.
olster).
, et al., Identification of toxig2009), doi:10.1016/j.ecoenv
lake ecosystems. In many cases the direct consequences ofeutrophication are the excessive growth of autotrophic organisms.In standing waters this manifests in blooms of generallyundesirable cyanobacteria. Some species of cyanobacteria mayproduce substances that are highly toxic. The identification of acyanobacterial genus by microscopic morphology does notindicate its potential for toxin production. Different strains ofone species can be morphologically identical but differ intoxigenicity. For example, Microcystis aeruginosa which is themost abundant toxic cyanobacterial genus in South Africa maycontain both toxic and non-toxic strains (Meissner et al., 1996;Bolch et al., 1997).
The Kruger National Park is one of the largest conservationareas in Africa and covers 19,485 km2 on South Africa’s easternborders with Mozambique (Fig. 1). Its perimeters were entirelyfenced from 1974 to 1993, when sections of the western fencebordering private wildlife reserves were removed. Megaherbi-vores are an important component of the fauna and include theelephant (Loxodonta africana), white rhinoceros (Ceratotherium
simum) and hippopotamus (Hippopotamus amphibius). Annualrainfall varies from 750 mm in the south-west to 450 mm in the
93
enic Microcystis strains after incidents of wild animal mortalities.2008.12.014

1
3
5
7
9
11
13
15
17
19
21
23
25
27
29
31
33
35
37
39
41
43
45
47
49
51
53
55
57
59
61
63
65
67
69
71
73
75
77
79
81
83
85
87
89
91
93
95
97
99
101
103
105
107
109
111
112
113
114
115
116
117
118
119
120
ARTICLE IN PRESSYEESA : 3861
Lower Sabie
Makholhlolo Dam Nhlanganzwane Dam
Fig. 1. Map of the Kruger National Park with cluster of two point source incidents
of wildlife mortalities.
P.J. Oberholster et al. / Ecotoxicology and Environmental Safety ] (]]]]) ]]]–]]]2
UNCORRECTED
north-east, with 80% received during the summer months ofOctober to March (Eckhardt et al., 2000).
With the establishment of the Kruger National Park in 1898,animals concentrated during the dry season around five perennialrivers (Pienaar, 1970). Between these rivers only a few naturalperennial water sources existed and most of the water sourceswere unreliable and depended on seasonal rainfall events(Pienaar, 1970). In the early 1930s, the Kruger National Park waterstabilisation programme started, but gained particular momen-tum in the 1960s after fencing of the western boundary of thepark, which blocked the migration routes of certain herbivores tothis area that previously acted as dry season grazing. Until the1980s more than 300 boreholes were drilled, 50 earth dams wereconstructed and various seasonal and perennial rivers dammed aspart of the water provision programme to ensure all year roundreliable surface water throughout the park (Gaylard et al., 2003).
During the autumn and early winter of 2005 rangers of theKruger National Park found several carcasses in the region of oneof these artificial water points, namely the Nhlanganzwane Damthat is situated in the extreme south eastern corner of the KrugerNational Park, to the south of Lower Sabie restcamp (Fig. 1). Bloodsmears sent to the State Veterinary laboratory at Skukuza werenegative for anthrax. Due to the decomposed state of thecarcasses, it was not possible to perform necropsies, and thecause of death could not be determined. After discovery of a freshzebra carcass in May 2005, a detailed necropsy was performedand a full range of laboratory tests were conducted by the StateVeterinary Services and the Onderstepoort Veterinary Institute.The microscopic lesions in the liver as well as formation ofintracytoplasmic eosinophilic globules in some hepatocytes andproliferation and accumulation of a lipofuscinous pigment inKuffer cells especially in the centrilobular areas were compatiblewith a diagnosis of Microcystis intoxication (Bengis et al., 2008).Mouse toxicity tests were also strongly positive. During the timeof the discovery of the carcasses, water levels at all the dams inthe region were unusually low and approximately 100 hippopo-tami inhabited the Nhlanganzwane Dam. The large density ofhippopotamus in the dam may have resulted in eutrophicationwhich most probably has given rise to the visible cyanobacterialbloom. A total of 52 carcasses were detected from February to July2005 consisting of 7 white rhinoceros, 2 lions, 2 cheetahs, 9
Please cite this article as: Oberholster, P.J., et al., Identification of toxigin the Kruger.... Ecotoxicol. Environ. Saf. (2009), doi:10.1016/j.ecoenv
zebras, 23 wildebeest, 1 hippopotamus, 1 giraffe, 5 buffalo, 1warthog and 1 kudu. Mortalities decreased to zero after July 2005when the overgrazed area surrounding Nhlanganzwane Dam wassubject to a low intensity accidental veldt fire. This resourcedepletion resulted in the dispersal of herbivores from the area,including the hippopotamus population, which dispersed to theSabie and Crocodile Rivers. Two years later, in June 2007,mortalities of white rhinoceros, zebras and wildebeest whereagain reported from the area of the Nhlanganzwane Dam.Microscopic lesions in the livers of these dead animals werecompatible with a diagnosis of Microcystis intoxication (Bengis etal., 2008). Once again there was a visible cyanobacterial bloom aswell as a large resident hippopotamus population in the dam.
The objectives of this study were (1) to use PCR assays to assessthe presence of possible toxigenic strains of M. aeruginosa Kutzingex Lemmermann in Nhlanganzwane Dam in the Kruger NationalPark, around which two mortality clusters in wild animals,associated with cyanobacterial intoxication, occurred in the dryseasons of 2005 and 2007. (2) To unravel the animal mortalities inthe region of this dam, we investigate some limnologicalconditions of the dam at the time of the intoxication event, aswell as the role played by megaherbivores associated with thedam.
PROOF
2. Materials and methods
2.1. Sampling protocol and enumeration of phytoplankton species
One sampling trip was undertaken in July 2007 during the occurrence of the
cyanobacterial intoxication event. Sampling was performed in triplicate with
200 ml polyethylene bottles at three different sampling sites by scooping up
surface water (710 cm depth) within the littoral zone of the Nhlanganzwane Dam.
Sampling were conducted in areas where cyanobacteria cells accumulated (surface
film 74 cm thick) as well as in the littoral zone of the Makhohlolo Dam that was
uninhabited by hippopotami and contained very low concentrations of cyano-
bacterial cells (2.3�102 cells ml�1) and a low water level that was not suitable for
hippopotami. The latter served as a control for this study and was within the
region of the Nhlanganzwane Dam. Water samples were transferred from the field
to the laboratory in a dark coolbox. Phytoplankton species composition and
community structure were assessed from 10-ml aliquots sampled from 200-ml
water samples after it was fixed with lugol’s solution. Colonies of Microcystis were
disintegrated by ultrasonication prior to counting (40 impulses/s over 4 min for a
10-ml sample) (Kurmayer et al., 2003). Phytoplankton cells were identified and
counted from transects in a Sedgewick–Rafter sedimentation chamber with an
inverted microscope. Identification and counting of phytoplankton were carried
out according to procedures outlined by Lund et al. (1958) and Padisak (1993).
While general algal species identification was carried out using Wehr and Sheath
(2003).
2.2. Pigment and physical/chemical determination
Physical/chemical analyses were conducted from subsamples of the triplicate
200 ml polyethylene bottles. These 200 ml surface water samples were taken at a
depth of 10 cm at the same three sampling sites in the littoral zone of both dams.
Chlorophyll-a was assessed from a 50-ml aliquots sampled from 200-ml surface
water samples. Chlorophyll-a was .extracted from lyophilized GF filters (20mm)
and kept in N,N-dimethylformamide for 2 h at room temperature. Chlorophyll-a
was then measured photospectrometrically at 647 and 664 nm according to the
calculations of Porra et al. (1989). Nutrient concentrations were analyzed from
100-ml aliquots sampled from 200-ml surface water samples using the American
Public Health Association, American Water Work Association, and Water Pollution
Control Federation (1998) classical spectophotometric methods. Temperature,
dissolved oxygen (DO) and conductivity of the water column were measured at a
depth of 10 cm at all three sampling sites in both dams with a HachTM sension 156
portable multiparameter (Loveland, CO, USA). To determine the trophic state of the
Nhlanganzwane and Makhohlolo Dams during the poisoning incidence in 2007,
inorganic nitrogen (IN), total nitrogen (TN), total phosphorus (TP), chlorophyll-a as
well as the TN:TP ratio were used following the trophic state index of Vollenweider
(1968) and Forsberg and Ryding (1980).
We obtained mean monthly air temperatures and rainfall patterns of 2005 and
2007, from stations within or near the Southern region of the Kruger National Park
from the South African Weather Bureau, and amalgamated these to derive the
mean annual temperature regime for the region.
enic Microcystis strains after incidents of wild animal mortalities.2008.12.014

PQ1
1
3
5
7
9
11
13
15
17
19
21
23
25
27
29
31
33
35
37
39
41
43
45
47
49
51
53
55
57
59
61
63
65
67
69
71
73
75
77
79
81
83
85
87
89
91
93
95
97
99
101
103
105
107
109
111
112
113
114
ARTICLE IN PRESSYEESA : 3861
Table 1Physicochemical measurements of raw surface water of the Nhanganzwane and
Makhohlolo Dams in July 2007 (n ¼ 1).
Physicochemical variables: Nhanganzwane Dam Makhohlolo Dam
Total Nitrogen 13,600mg l�1 660mg l�1
Inorganic nitrogen 2171mg l�1 183mg l�1
Total phosphorus 1210mg l�1 22mg l�1
Soluble reactive phosphorus 129mg l�1 6.2mg l�1
Total microcystin 23,718mg l�1 0.317mg l�1
Chlorophyll-a 580mg l�1 3.8mg l�1
Dissolved oxygen 2.79 4.38
Dissolved organic carbon 6.1 mg l�1 1.3 mg l�1
The Nhanganzwane Dam was occupied by a large resident of hippopotamus
population during this time.
P.J. Oberholster et al. / Ecotoxicology and Environmental Safety ] (]]]]) ]]]–]]] 3
ORRECTED
2.3. Cyanobacterial reference strain culturing
The toxic, axenic M. aeruginosa strain PCC 7806, obtained from the Institute
Pasteur (PCC; Paris, France) was used in this study as reference strain. The
Microcystis field strain was cultured in liquid BG-11 medium at 24 1C under
continuous illumination of approximately 60mmol photons (PAR) m�2 s�1. Light
intensity was measured with a Cole Parmer Model DLM2 light meter (Vernon Hills,
Illinois, USA) at a pH of 8.0 on a daily basis. All cultures were routinely screened for
contamination by streaking samples on TYG agar and in TYG broth. Cells were
harvested at late-exponential growth phase.
2.4. Microcystin analysis
For cyanotoxin analysis, a volume representing 50 mg dry weight of the
environmental strains biomass was filtered through glass fiber filters, air dried and
stored in the dark at room temperature. Cyanotoxicity was determined with an
enzyme-linked immunosorbent assay (ELISA), using a QuantiTM Kit for micro-
cystins (EnviroLogix, USA). Results were obtained by reading the absorbance using
a microtitre plate reader set (Thermo Labsystems, USA) at 450 nm within 30 min
after the addition of the stop solution. It has been estimated that the average
cellular microcystin-LR content for Microcystin aeruginosa in laboratory cultures is
approximately 0.2 pg/cell (range, 0.07–0.3 pg; Mole et al., 1997). On this basis, the
total intracellular microcystin (Tcm) of the bloom was determined for the period of
intoxication by animals using the following equations:
Tcm ¼ Ic � Ca (1)
where Ic is the average intracellular microcystin-LR (pg/cell) and Ca the
cyanobacterial cell abundance (cells ml�1) of the bloom.
The daily total microcystin-LR intake (Dm) by different wild animals during the
occurrence of intoxication event was determined by the following equations:
Dm ¼Tm �Wr þ Em
Mbw(2)
where Tm is the total intracellular microcystin-LR (mg l�1), Em the total
extracellular microcystin-LR (mg l�1), Wr the daily water requirements of a animal
(litres) and Mbw the average mean body weight (kilogram).
2.5. Assessing toxigenicity by PCR
DNA was extracted from the environmental strains as well as from the
reference strain PCC 7806 using DNAzols-Genomic DNA Isolation reagent
following the manufacturers’ procedures (Molecular Research Center, Inc., USA).
PCR amplification was performed in a GeneAmp2400 thermocycler (Perkin-Elmer
Cetus, Emeryville, California, USA). The thermal cycling protocol included an initial
denaturation phase at 94 1C for 2 min, followed by 35 cycles. Each cycle began with
30 s at 96 1C followed by 30 s at the annealing temperature at TM 1C for the specific
primer pairs (Ouahid et al., 2004, 2005; Oberholster et al., 2006), and 30 s at 72 1C
for the elongation step. The PCR reaction was terminated by maintaining samples
at 72 1C for 7 min. The amplification reaction contained a 10� amplification buffer
with 1.5 mM MgCl2, 0.2 mM dNTPs, 20 pmol of each primer and 1 U Taq DNA
polymerase, and 3–5 ng purified DNA in a final volume of 20ml. Electrophoresis of
the PCR products was carried out in 2% agarose gels in TAE buffer (0.04 M
Tris–acetate–0.001 M EDTA [pH 8.0]), and the DNA was stained with ethidium
bromide and visualized and photographed under UV transillumination.
2.6. Data analysis
In this study, results were recorded on standard Excel spreadsheets for data
processing, and statistical analysis was performed using SYSTATs 7.0.1 (1997).
Statistical differences were analyzed calculating Pearson correlation and a t test
using the Sigma Plot (Jandel Scientific) program. Values of pp0.05 were regarded
as significant.
C 115116
117
118
119
120
Table 2Estimated average daily intake of cellular microcystins by different herbivores at
Nhlanganzwane Dam, July 2007.
Herbivores Mean
weight at
maturity in
kg
Water
requirement
in litres per
day
Average daily
microcystin-LR
intake
(mg kg�1 d)
White rhinoceros male 2100 72 754.29
White rhinoceros female 1600 72 990
Zebra: Burchells 240 12 1100
Warthog 30 3.5 2566.6
Wildebeest: black 160 7 962.5
UN3. Results
3.1. Species composition
The surface water samples at the three sampling sites collectedin July 2007 revealed a cyanobacterial abundance of 1.1�108 cellsml�1 with the occurrence of one cyanobacterial morphospecies M.
aeruginosa (Wehr and Sheath, 2003) in the Nhlanganzwane Dam.In terms of abundance, the phytoplankton community in theNhlanganzwane Dam was dominated by the cyanobacteria M.
aeruginosa, followed by Chlorophyceae (most abundant species:
Please cite this article as: Oberholster, P.J., et al., Identification of toxigin the Kruger.... Ecotoxicol. Environ. Saf. (2009), doi:10.1016/j.ecoenv
Scenedesmus armatus). Euglenophyceae (e.g. Phacus longicauda)occurred in very low numbers. The total number of phytoplanktonspecies encounter in all samples combined were 16 species ofwhich 9 species occurred in the Makhohlolo Dam.
ROOF
3.2. Physicochemical measurements
The physicochemical conditions measured in the Nhanganz-wane Dam in July 2007 were total nitrogen, inorganic nitrogen,total phosphorus, total microcystin, chlorophyll-a, dissolvedoxygen and water temperature. Data measured in the Nhanganz-wane Dam in July 2007 were the following: total nitrogen,13,600mg l�1; inorganic nitrogen, 2171mg l�1; total phosphorus,1210mg l�1; soluble reactive phosphorus, 129mg l�1; total micro-cystin level, 23,718mg l�1, chlorophyll-a, 580mg l�1, dissolvedorganic carbon, 6.1 mg l�1, dissolved oxygen, 2.13 mg l�1 andsurface water temperature 22 1C. According to the near surfacewater average nutrient concentration index of Vollenweider(1968) and Forsberg and Ryding (1980) for classification of thetrophic states of the dam during the time of the animalmortalities, the dam was hypertrophic in July 2007. A significantpositive relationship (r ¼ 0.98229; pp0.02) between the highcyanobacterial cell abundance and high soluble reactive phos-phorus concentration (129mg l�1) was observed. The solublereactive phosphorus concentration in Nhlanganzwane Damexceeded the level of 50mg l�1 considered conducive to cyano-bacterial blooms (Wasson et al., 1996). The Makhohlolo Dam, onthe other hand, had low total nitrogen (660mg l�1) and totalphosphorus (21mg l�1) concentrations, indicating a mesotrophicsystem (Table 1). The average temperature range of the surfacewater in July 2007 was 20–22 1C. Rainfall data revealed a dryerwinter season in 2005 than in 2007 with high air temperatures inboth cases.
enic Microcystis strains after incidents of wild animal mortalities.2008.12.014
Q2
1
3
5
7
9
11
13
15
17
19
21
23
25
27
29
31
33
35
37
39
41
43
45
47
49
51
53
55
57
59
61
63
65
67
69
71
73
75
77
79
81
83
85
87
89
91
93
95
97
99
101
103
105
107
109
111
112
ARTICLE IN PRESSYEESA : 3861
←
←
M
bp
← 859
← 425
mcyB mcyD2 mcyE
1 2 3 4 5 6 7 8 9 10 11 12 13 14 15 16 17 18 19
mcyC mcyD1 mcyG 16S RNA
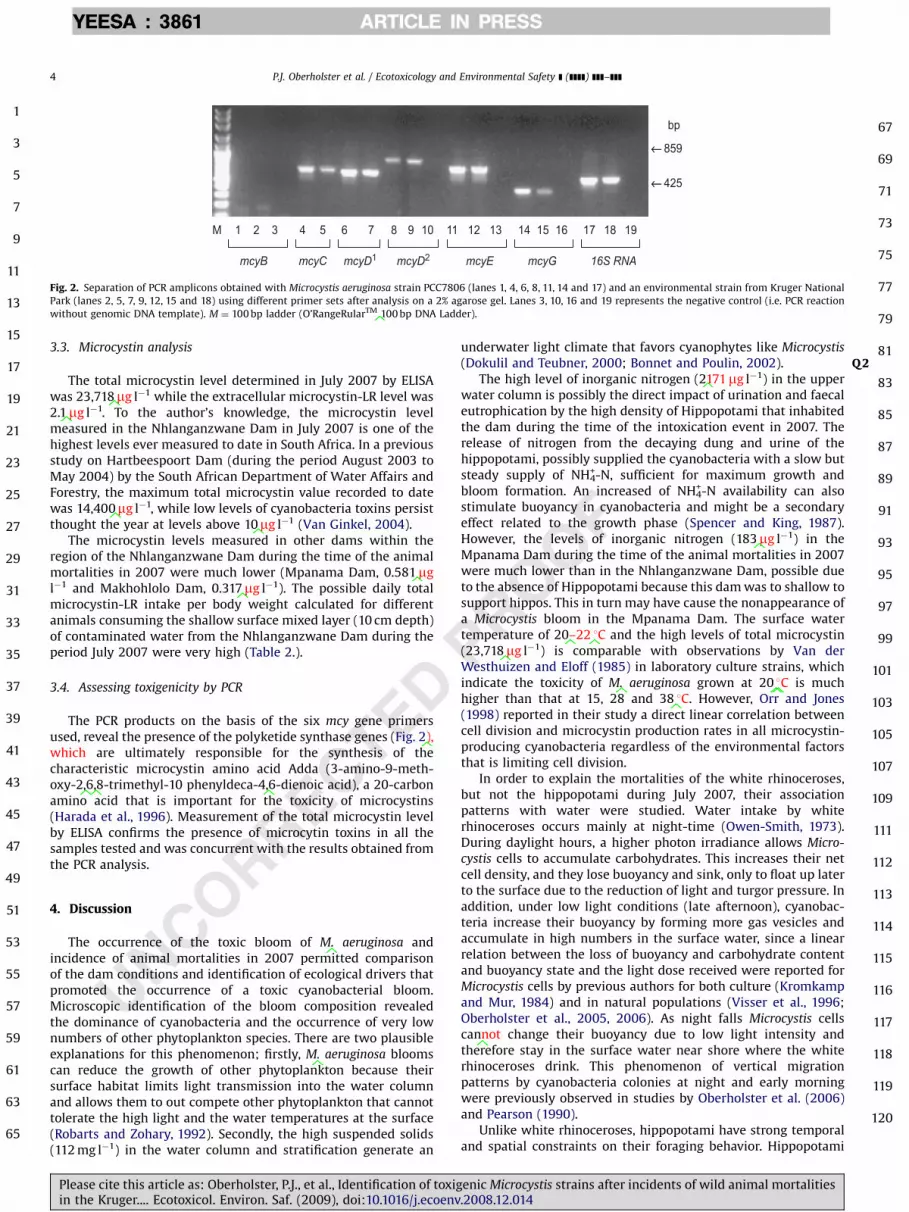
Fig. 2. Separation of PCR amplicons obtained with Microcystis aeruginosa strain PCC7806 (lanes 1, 4, 6, 8, 11, 14 and 17) and an environmental strain from Kruger National
Park (lanes 2, 5, 7, 9, 12, 15 and 18) using different primer sets after analysis on a 2% agarose gel. Lanes 3, 10, 16 and 19 represents the negative control (i.e. PCR reaction
without genomic DNA template). M ¼ 100 bp ladder (O’RangeRularTM 100 bp DNA Ladder).
P.J. Oberholster et al. / Ecotoxicology and Environmental Safety ] (]]]]) ]]]–]]]4
RECTED
3.3. Microcystin analysis
The total microcystin level determined in July 2007 by ELISAwas 23,718mg l�1 while the extracellular microcystin-LR level was2.1mg l�1. To the author’s knowledge, the microcystin levelmeasured in the Nhlanganzwane Dam in July 2007 is one of thehighest levels ever measured to date in South Africa. In a previousstudy on Hartbeespoort Dam (during the period August 2003 toMay 2004) by the South African Department of Water Affairs andForestry, the maximum total microcystin value recorded to datewas 14,400mg l�1, while low levels of cyanobacteria toxins persistthought the year at levels above 10mg l�1 (Van Ginkel, 2004).
The microcystin levels measured in other dams within theregion of the Nhlanganzwane Dam during the time of the animalmortalities in 2007 were much lower (Mpanama Dam, 0.581mgl�1 and Makhohlolo Dam, 0.317mg l�1). The possible daily totalmicrocystin-LR intake per body weight calculated for differentanimals consuming the shallow surface mixed layer (10 cm depth)of contaminated water from the Nhlanganzwane Dam during theperiod July 2007 were very high (Table 2.).
3.4. Assessing toxigenicity by PCR
The PCR products on the basis of the six mcy gene primersused, reveal the presence of the polyketide synthase genes (Fig. 2),which are ultimately responsible for the synthesis of thecharacteristic microcystin amino acid Adda (3-amino-9-meth-oxy-2,6,8-trimethyl-10 phenyldeca-4,6-dienoic acid), a 20-carbonamino acid that is important for the toxicity of microcystins(Harada et al., 1996). Measurement of the total microcystin levelby ELISA confirms the presence of microcytin toxins in all thesamples tested and was concurrent with the results obtained fromthe PCR analysis.
113
114
115
116
117
118
119
120
UNCOR4. Discussion
The occurrence of the toxic bloom of M. aeruginosa andincidence of animal mortalities in 2007 permitted comparisonof the dam conditions and identification of ecological drivers thatpromoted the occurrence of a toxic cyanobacterial bloom.Microscopic identification of the bloom composition revealedthe dominance of cyanobacteria and the occurrence of very lownumbers of other phytoplankton species. There are two plausibleexplanations for this phenomenon; firstly, M. aeruginosa bloomscan reduce the growth of other phytoplankton because theirsurface habitat limits light transmission into the water columnand allows them to out compete other phytoplankton that cannottolerate the high light and the water temperatures at the surface(Robarts and Zohary, 1992). Secondly, the high suspended solids(112 mg l�1) in the water column and stratification generate an
Please cite this article as: Oberholster, P.J., et al., Identification of toxigin the Kruger.... Ecotoxicol. Environ. Saf. (2009), doi:10.1016/j.ecoenv
PROOF
underwater light climate that favors cyanophytes like Microcystis
(Dokulil and Teubner, 2000; Bonnet and Poulin, 2002).The high level of inorganic nitrogen (2171mg l�1) in the upper
water column is possibly the direct impact of urination and faecaleutrophication by the high density of Hippopotami that inhabitedthe dam during the time of the intoxication event in 2007. Therelease of nitrogen from the decaying dung and urine of thehippopotami, possibly supplied the cyanobacteria with a slow butsteady supply of NH4
+-N, sufficient for maximum growth andbloom formation. An increased of NH4
+-N availability can alsostimulate buoyancy in cyanobacteria and might be a secondaryeffect related to the growth phase (Spencer and King, 1987).However, the levels of inorganic nitrogen (183mg l�1) in theMpanama Dam during the time of the animal mortalities in 2007were much lower than in the Nhlanganzwane Dam, possible dueto the absence of Hippopotami because this dam was to shallow tosupport hippos. This in turn may have cause the nonappearance ofa Microcystis bloom in the Mpanama Dam. The surface watertemperature of 20–22 1C and the high levels of total microcystin(23,718mg l�1) is comparable with observations by Van derWesthuizen and Eloff (1985) in laboratory culture strains, whichindicate the toxicity of M. aeruginosa grown at 20 1C is muchhigher than that at 15, 28 and 38 1C. However, Orr and Jones(1998) reported in their study a direct linear correlation betweencell division and microcystin production rates in all microcystin-producing cyanobacteria regardless of the environmental factorsthat is limiting cell division.
In order to explain the mortalities of the white rhinoceroses,but not the hippopotami during July 2007, their associationpatterns with water were studied. Water intake by whiterhinoceroses occurs mainly at night-time (Owen-Smith, 1973).During daylight hours, a higher photon irradiance allows Micro-
cystis cells to accumulate carbohydrates. This increases their netcell density, and they lose buoyancy and sink, only to float up laterto the surface due to the reduction of light and turgor pressure. Inaddition, under low light conditions (late afternoon), cyanobac-teria increase their buoyancy by forming more gas vesicles andaccumulate in high numbers in the surface water, since a linearrelation between the loss of buoyancy and carbohydrate contentand buoyancy state and the light dose received were reported forMicrocystis cells by previous authors for both culture (Kromkampand Mur, 1984) and in natural populations (Visser et al., 1996;Oberholster et al., 2005, 2006). As night falls Microcystis cellscannot change their buoyancy due to low light intensity andtherefore stay in the surface water near shore where the whiterhinoceroses drink. This phenomenon of vertical migrationpatterns by cyanobacteria colonies at night and early morningwere previously observed in studies by Oberholster et al. (2006)and Pearson (1990).
Unlike white rhinoceroses, hippopotami have strong temporaland spatial constraints on their foraging behavior. Hippopotami
enic Microcystis strains after incidents of wild animal mortalities.2008.12.014

P
Q3
Q4
1
3
5
7
9
11
13
15
17
19
21
23
25
27
29
31
33
35
37
39
41
43
45
47
49
51
53
55
57
59
61
63
65
67
69
71
73
75
77
79
81
83
85
87
89
91
93
95
97
99
101
103
105
107
109
111
112
113
114
115
116
117
118
119
120
ARTICLE IN PRESSYEESA : 3861
P.J. Oberholster et al. / Ecotoxicology and Environmental Safety ] (]]]]) ]]]–]]] 5
UNCORRECTED
are temporally contained in that they forage primarily at night(Laws, 1968). This is the time period when cyanobacterial cellconcentrations are the highest in the surface water and exposureto cyanobacteria by oral ingestion is most likely. Althoughhippopotamus populations normally spend a large proportion ofday time immersed in water (Schwarm et al., 2003) theycongregate in deeper water where cyanobacteria colonies aresuspended in the water column. Generally microcystin concentra-tions are much higher at sites where toxic cyanobacteriaaccumulate, rather than in the open water. The accumulation ofcyanobacterial colonies is the result of their positive buoyancy andwind-driven hydrodynamics, with leeward shorelines and em-bankments being the likely sites for surface scum accumulation.
Furthermore, the common hippopotamus represents thelargest extant terrestrial foregut fermenter (Owen-Smith, 1988).Their daily intake and gut capacity per body weight is lower thanother megaherbivores of comparable size, which most likelystems from their very long ingesta retention times recorded byFoose (1982). Due to the tubular nature of the forestomach andthe long ingesta retention time, cyanobacterial cells ingestedwhile drinking or swimming have sufficient time to mix withdigestible nutrient-fiber and general organic matter which couldreduce the toxicity levels of the toxic Microcystis cells. Thepossible total average microcystin-LR daily intake for a malewhite rhinoceros, consuming contaminated cyanobacterial waterfrom the Nhlanganzwane Dam in July 2007 was 754.29mg kg�1
bw. In a previous study conducted by Falconer et al. (1994) theydetermine that the lowest observed adverse effecting level(LOAEL) of microcystin in pigs were 280mg kg�1 bw, with generalliver injury (evident from histopathology and changes in serumenzymes) occurring at two higher dose levels. Laboratory studiesby Fawell et al. (1994, 1999) indicate that the lowest observedeffecting level (LOEL) of microcystin-LR by oral route in mice was(LD50) 5000mg kg�1 bw. We assume from the above data in thisstudy, that the high level of 23,718mg l�1 measured with ELISA aswell as the microcystin LOAEL data established for pigs byFalconer et al. (1994), indicate that the possible cause of themortalities of the white rhinoceroses, zebra, wildebeest and otherspecies, in the region of the Nhlanganzwane Dam, was most likelydue to acute rather than chronic exposure to microcystin toxins.
Although the mentioned microcystin intake value of differentanimals in this study is a (realistic) rough estimate, there are otherfactors that could have played a role e.g. the water intake ofanimal’s increases during their gestation period. Hence, fewstudies of this nature exist and it is known that the water intakeof cattle increases by about 50% in the last 4 months of theirgestation period (Meyer et al., 1996). Furthermore, we speculatedthat the wild animals that died in July 2007 of cyanobacterialintoxication, has drunk dam water down wind to avoid theattention of predators. It is usually in these areas wherecyanobacterial scum accumulates. In addition, Lopez Rodas andCostas (1999) found in their study that mice preferred to consumerather dense cultures of a toxic strain of M. aeruginosa than low-density cultures or clear water. They have confirmed their findingsin the field with observations from several reservoirs in Spain.
A shortfall of this study however, was that only a singlesampling trip was undertaken during the occurrence of the wildanimal intoxications in July 2007, and we are aware thatcyanobacterial blooms can vary substantially between seasons,weeks or even days. These variations might be caused by changesin species composition, production of different toxins withvarying toxicity by one clone or other reasons influenced byenvironmental factors (Benndorf and Henning, 1989). However,the only time there is assessment of surface water in conservationareas like the Kruger National Park, is when there are deaths ofwild animals. This is also a major problem when it comes to
Please cite this article as: Oberholster, P.J., et al., Identification of toxigin the Kruger.... Ecotoxicol. Environ. Saf. (2009), doi:10.1016/j.ecoenv
diagnosis of cyanobacterial poisoning in wildlife, since carcassesof these animals are usually found decomposed or partiallyconsumed by scavengers. However, the detection of fresh animalcarcasses in June 2007 made it possible to associate theMicrocystis bloom with the wildlife mortalities.
In the present study, six mcy gene primers where used to helpimprove toxigenicity typing of M. aeruginosa strains, which is thedominant genus causing most cyanobacterial-related animalmortalities in South Africa (Oberholster et al., 2006). These sixprimers were selected, since in a previous study conducted on 12dams by Botha and Oberholster (2007) they concluded that not allexisting published primers available in literature were competentunder South African environmental conditions. All the primersused in this study showed that they were competent under SouthAfrican environmental conditions and were existing primers thatwere designed to amplify gene fragments that included aconsensus sequence for a characteristic domain (nonribosomalpeptide sythetase operon and polyketide synthase operon) plusregions flanking that sequence (Dittmann et al., 1997; Nishizawaet al., 1999, 2000; Tillett et al., 2000, 2001). The outcome of thePCR products confirms the occurrence of various mcy genes in theM. aeruginosa strains isolated from the Nhanganzwane Dam in2007 that could be correlated with their ability to synthesizemicrocystins (Hui et al., 2002).
ROOF5. Conclusion
In the Kruger National Park setting we found that conditionswhich favor the excessive cyanobacterial growth such as theabnormal high winter temperatures, high levels of nutrients in thewater caused by defecation and urination of a relatively largeresident hippopotamus population as well as stagnant water allplayed a role in the development of the toxic cyanobacterialbloom that occurred in the Nhanganzwane Dam. Under suchconditions, artificial dams in the Kruger National Park need to bemonitored in order to predict these biotoxicity events. The presentstudy also shows that existing reliable and simple PCR methodol-ogy can be used for the rapid screening of the presence ofgenetoxic strains in artificial water points in conservation areas.Monitoring by PCR methodology could be used as a proactivehazard identification technique to alert animal health profes-sionals and wildlife managers to improve their preparedness andassist in the management of toxic Microcystis bloom events, aswas experienced in the case of the Nhlanganzwane Dam.
Uncited reference
SPSS Inc. (1997).
Acknowledgments
The authors express their sincere gratitude to the South AfricanWeather Bureau for providing meteorological data. We also wouldlike to thank the National Research Foundation for provision offinding and the two unknown referees for critically reviewing themanuscript and suggesting useful changes.
References
American Public Health Association, American Water Works Association andWater Environment Association, 1998. Standard Methods for the Examinationof Water and Wastewater, 20th ed. American Public Health Association,Washington, DC.
enic Microcystis strains after incidents of wild animal mortalities.2008.12.014

1
3
5
7
9
11
13
15
17
19
21
23
25
27
29
31
33
35
37
39
41
43
45
47
49
51
53
55
57
59
61
63
65
67
69
71
73
75
77
79
81
83
85
87
89
91
93
95
97
99
101
103
105
107
109
111
112
113
114
115
116
117
ARTICLE IN PRESSYEESA : 3861
P.J. Oberholster et al. / Ecotoxicology and Environmental Safety ] (]]]]) ]]]–]]]6
UNCORRECTED
Bengis, R.G., Govender, D., Keet, D.F., 2008. Multi-species mortality events relatedto cyanobacterial bio-intoxication in the Kruger National Park. In: Proceedingsof the Forth South African Veterinary and Para-Veterinary Conference, Sun City,South Africa, 7–11 July 2008, pp. 1–3.
Benndorf, J., Henning, M., 1989. Daphnia and toxic blooms of Microcystis aeruginosain Bautzen Reservoir (GDR). Int. Rev. Gesamt. Hydrobiol. 74, 233–248.
Bolch, C.J.S., Blackburn, S.I., Jones, G.J., Orr, P.T., Crewe, P.M., 1997. Plasmid contentand distribution in the toxic cyanobacterial genus Microcystis Kutzing exLemmermann (Cyanobacteria: Chroococcales). Phycology 36, 6–11.
Bonnet, M.P., Poulin, M., 2002. Numerical modeling of the planktonic succession ina nutrient-rich reservoir: environmental and physiological factors leading toMicrocystis aeruginosa dominance. Ecol. Model. 156, 93–112.
Bomchul, K., Park, J.-H., Hwang, G., Jun, M.-S., Choi, K., 2001. Eutrophication ofreservoirs in South Korea. Limnology 2, 223–229.
Botha, A.-M., Oberholster, P.J., 2007. PCR based markers for detection andidentification of toxic cyanobacteria. Water Research Commission Report No.K5/1502/01/07, Pretoria, ZA.
Dittmann, E., Neilan, B.A., Erhard, M., von Dohren, H., Borner, T., 1997. Insertionalmutagenesis of a peptide synthetase gene that is responsible for hepatotoxinproduction in the cyanobacterium Microcystis aeruginosa PCC7806. Mol.Microbiol. 26, 779–787.
Dokulil, M.T., Teubner, K., 2000. Cyanobacterial dominance in lakes. Hydrobiology438, 1–12.
Eckhardt, H.C., van Wilgen, B.W., Biggs, H.C., 2000. Trens in woody vegetation coverin the Kruger National Park, South Africa, between 1940–1998. Afr. J. Ecol. 38,108–115.
Falconer, I., Burch, M., Steffensen, D., Choice, M., Coverdale, O., 1994. Toxicity of theblue-green alga (cyanobacterium) Microcystis aeruginosa in drinking water togrowing pigs, as an animal model for human injury and risk assessment. J.Environ. Toxicol. Water Qual. 9, 131–139.
Fawell, J.K., James, C.P., James, H.A., 1994. Toxin from blue green algae: toxicologicalassessment of microcystin-LR and a method for its determination in water.Report No. FR 0359/2/DoE 3358/2. Foundation of Water Research, Marlow, UK,pp. 1–46.
Farwell, J.K., Mitchell, R.E., Everett, D.J., Hill, R.E., 1999. The toxicity ofcyanobacterial toxins in the mouse: I. Microcystin-LR. Hum. Exp. Toxicol. 18,162–167.
Foose, T., 1982. Trophic strategies of ruminant versus nonruminant ungulates.Ph.D. Dissertation, University of Chicago, Chicago.
Forsberg, C., Ryding, S.O., 1980. Eutrophication parameters and trophic stateindices in 30 Swedish waste-receiving lakes. Arch. Hydrobiol. 89, 189–207.
Gaylard, A., Owen-Smith, N., Redfern, J.F., 2003. Surface water availability:implications for heterogeneity and ecosystem processes. In: du Toit, J.T.,Rogers, K.H., Biggs, H.C. (Eds.), The Kruger Experience: Ecology and Manage-ment of Savanna Heterogeneity. Island Press, Washington, pp. 171–188.
Harada, K.-I., Kondo, F., Lawton, L., 1996. Laboratory analysis of cyanotoxins. In:Chorus, I., Bartram, J. (Eds.), Toxic Cyanobacteria in Water: A Guide to TheirPublic Health Consequences, Monitoring and Management. E & FN Spon,London, UK, pp. 369–405.
Hui, P., Song, L., Lui, Y., Borner, T., 2002. Detection of hepatotoxic Microcystis strainsby PCR with intact cells from both culture and environmental samples. Arch.Microbiol. 178, 421–427.
Kromkamp, J.C., Mur, L.R., 1984. Buoyant density changes in the cyanobacteriumMicrocystis aeruginosa due to changes in the cellular carbohydrate content.FEMS Microbiol. Lett. 25, 105–109.
Kurmayer, R., Christiansen, G., Chorus, I., 2003. The abundance of microcystin-producing genotypes correlates positively with colony size in Microcystis sp.and determines its microcystin net production in Lake Wannsee. Appl. Environ.Microbiol. 69, 787–795.
Laws, R.M., 1968. Dentition and ageing in the hippopotamus. E. Afr. Wildl. J. 6,19–52.
Lund, J.W.G., Kipling, C., Le Cren, E.O., 1958. The inverted microscope method ofestimating algal numbers and the statistical basis of estimations by counting.Hydrobiology 11, 143–170.
Lopez Rodas, V., Costas, E., 1999. Preference of mice to consume Microcystisaeruginosa (toxin-producing cyanobacteria): a possible explanation fornumerous fatalities of livestock and wildlife. Res. Vet. Sci. 67, 107–110.
Meissner, K., Dittmann, E., Borner, T., 1996. Toxic and non-toxic strains of thecyanobacterium Microcystis aeruginosa contain sequences homologous topeptide synthetase genes. FEMS Micro. Lett. 135, 295–303.
Meyer, J.A., Casey, N.H., du Toit, J.G., 1996. Game ranch planning Part 3. In: Bothma,J.P. (Ed.), Game Ranch Management. JL van Scaik Publishers, South Africa, pp.95–99.
Mole, J., Chow, C., Burch, M., Drikas, M., 1997. In: proceeding of the 13thAustralasian Society for Phycology and Aquatic Botany Annual Conference,Hobart, Tasmania.
Nishizawa, T., Ueda, A., Asayama, M., Fujii, K., Harada, K., Ochi, K., Shirai, K., 2000.Polyketide synthase gene coupled to the peptide synthetase module involvedin the biosynthesis of the cyclic heptapeptide microcystin. J. Biochem. (Tokyo)127, 779–789.
Please cite this article as: Oberholster, P.J., et al., Identification of toxigin the Kruger.... Ecotoxicol. Environ. Saf. (2009), doi:10.1016/j.ecoenv
PROOF
Nishizawa, T., Fujii, M., Harada, K., Shirai, M., 1999. Genetic analysis of the peptidesynthetase genes for a cyclic heptapeptide microcystin in Microcystis spp. J.Biochem. (Tokyo) 126, 520–529.
Oberholster, P.J., Botha, A.-M., Cloete, T.E., 2005. An overview of toxic freshwatercyanobacteria in South Africa with special reference to risk, impact anddetection by molecular marker tools. Biokhimiya 17, 57–71.
Oberholster, P.J., Botha, A.-M., Cloete, T.E., 2006. Toxic cyanobacterial blooms in ashallow, artificially mixed urban lake in Colorado, USA. Lakes Reservoirs: Res.Manage. 11, 111–123.
Oberholster, P.J., Botha, A.-M., 2007. Use of PCR based technologies for riskassessment of a winter cyanobacterial bloom in Lake Midmar, South Africa. AfrJ. Biotechnol. 6, 14–21.
Orr, P.T., Jones, G.J., 1998. Relationship between microcystin production and celldivision rates in nitrogen-limited Microcystis aeruginosa cultures. Limnol.Oceanogr. 43, 1604–1614.
Ouahid, Y., Perez-Silva, G., del Campo, F.F., 2005. Identification of potentially toxicenvironmental Microcystis by individual and multiple PCR amplification ofspecific microcystin synthetase gene regions. Environ. Toxicol. 20, 235–242.
Ouahid, Y., Sanz-Alferez, S., Perez-Silva, G., del Campo, F.F., 2004. Cyanobacteriaand microcystin monitorization of Pinilla Reservoir (Madrid). Abstract Book ofIV Iberian Conference of Limnology, Porto, pp. 44–45.
Owen-Smith, N., 1988. Megaherbivores. The Influence of Very Large Body Size onEcology. Cambridge University Press, Cambridge.
Owen-Smith, N., 1973. The behavioral ecology of the white rhinoceros. Ph.D. Thesis,University of Wisconsin, Wisconsin.
Padisak, J., 1993. Microscopic examination of phytoplankton samples. In:Proceedings of the International Training Course on Limnological Bases ofLake Management, 24 May–5 June 1993, Tihany, Hungary.
Pearson, M.J., 1990. Toxic blue-green algae. Report of the National Rivers Authority.Water Quality Series No. 2. National River Authority, London, UK.
Pienaar, U.deV., 1970. Water resources of the Kruger National Park. Afr. Wildl. 24,180–191.
Pitois, S., Jackson, M.H., Wood, B.J.B., 2001. Sources of the Eutrophication problemsassociated with toxic algae: an overview. J. Environ. Health 64, 25–30.
Porra, R.J., Thompson, W.A., Kriedemann, P.E., 1989. Determination of accurateextinction coefficient and simultaneous equations for assaying chlorophyll aand b extracted with four different solvents: verification of the concentrationof chlorophyll standards by atomic absorption spectrometry. Biochim. Biophys.Acta 975, 384–394.
Rast, W., Thornton, J.A., 1996. Trends in eutrophication research and control. Hydro.Proc. 10, 295–313.
Robarts, R.D., Zohary, T., 1992. The influence of temperature and light on the upperlimit of Microcystis aeruginosa production in a hypertrophic reservoir. J. PlankRes. 14, 235–247.
Schwarm, A., Clauss, M., Flach, E.J., 2003. Passage rate and digestibility coefficientsin captive hippopotamidae, a pilot study. Verhandlungsber. Erkrank. Zootiere41, 413–418.
SPSS Inc., 1997. Systat 7.0.1 for Windows: Statistics. SPSS Inc., Chicago, IL.Spencer, C.N., King, D.L., 1987. Regulation of blue-green algal buoyancy and bloom
formation by light, inorganic nitrogen, CO2, and trophic level interactions.Hydrobiology 144, 183–192.
Tillett, D., Parker, D.L., Neilan, B.A., 2001. Detection of toxigenicity by a probe forthe microcystin synthetase A gene (mcyA) of the cyanobacterial genusMicrocystis: comparison of toxicities with 16S rRNA and phycocyanin operon(Phycocyanin Intergenic Spacer) phylogenies. Appl. Environ. Microbiol. 67,2810–2818.
Tillett, D., Dittmann, E., Erhard, M., von Dohren, H., Borner, T., Neilan, B.A., 2000.Structural organization of microcystin biosynthesis in Microcystis aeruginosaPCC7806: an integrated peptidepolyketide synthetase system. Chem. Biol. 7,753–764.
Van der Westhuizen, A.J., Eloff, J.N., 1985. Effect of temperature and light on thetoxicity and growth of the bluegreen alga Microcystis aeruginosa (UV-006).Planta 163, 55–59.
Van Ginkel, C.E., 2004. A national survey of the incidence of cyanobacterial bloomsand toxin production in major impoundments. Internal Report No. N/0000/00/DEQ/0503, Resource Quality Services, Department of Water Affairs andForestry, Pretoria, South Africa, pp. 1–44.
Visser, P.M., Ibelings, B.W., Van der Veer, B., Koedood, J., Mur, L.R., 1996. Artificialmixing prevents nuisance blooms of the cyanobacterium Microcystis in LakeNieuwe Meer, The Netherlands. Fresh Biol. 36, 435–450.
Vollenweider, R.A., 1968. Scientific fundamentals of the eutrophication of lakes andflowing waters, with particular reference to nitrogen and phosphorus asfactors in eutrophication. Technical Report DAS/CSI/68.27. Paris: Org. for Econ.Cooperation and Dev.
Wasson, R., Banens, R., Davies, P., Maher, W., Robinson, S., Volker, R., Tait, D.,Watson-Brown, S., 1996. Inland waters. In: Taylor, R. (Ed.), Australia: State ofthe Environment. Commonwealth Scientific and Industrial Research Organiza-tion, Collingwood, Australia, pp. 7.1–7.55.
Wehr, J.D., Sheath, R.G., 2003. Freshwater Algae of North America: Ecology andClassification. Academic Press, Massachusetts, USA, pp. 1–834.
118
enic Microcystis strains after incidents of wild animal mortalities.2008.12.014
Recommended


