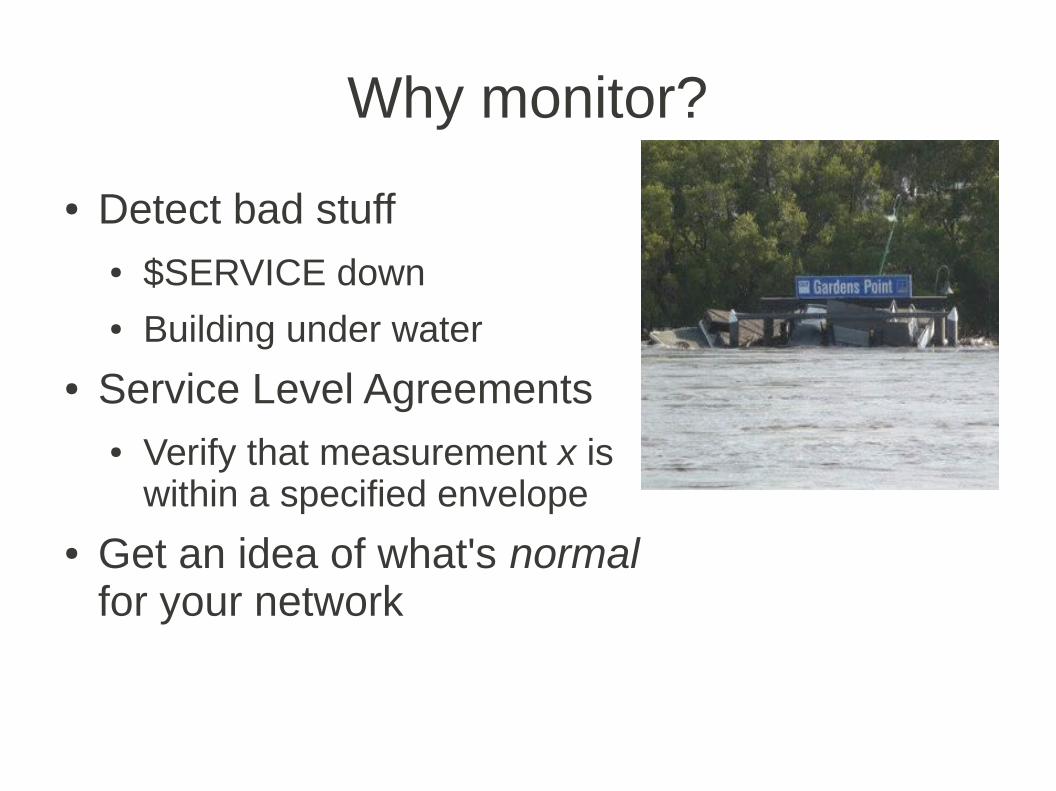
Why monitor?
● Detect bad stuff● $SERVICE down● Building under water
● Service Level Agreements● Verify that measurement x is
within a specified envelope
● Get an idea of what's normal for your network
Basic monitoring
● Host is Up● Responds to ICMP ping
● Service Availability● Can connect to 80● DNS resolution of domain x.y.z
● Application level statistics● Database Query Execution Time
● All of these checks occur on “Smart Devices”
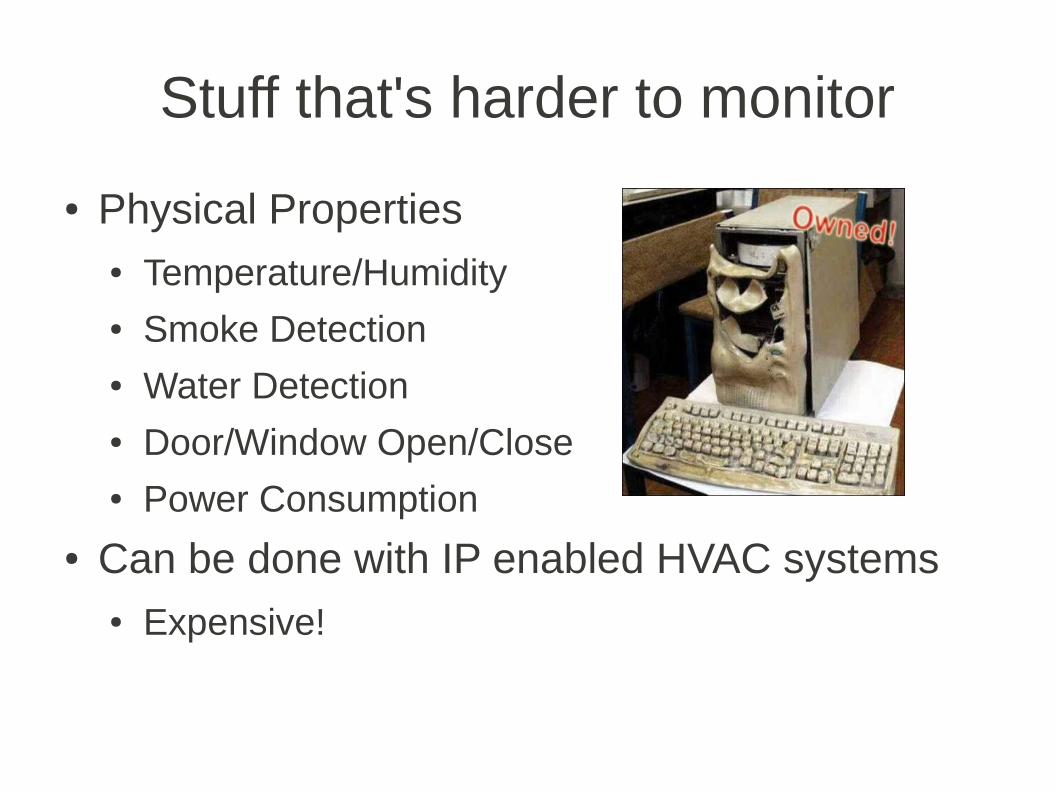
Stuff that's harder to monitor
● Physical Properties● Temperature/Humidity● Smoke Detection● Water Detection● Door/Window Open/Close● Power Consumption
● Can be done with IP enabled HVAC systems● Expensive!
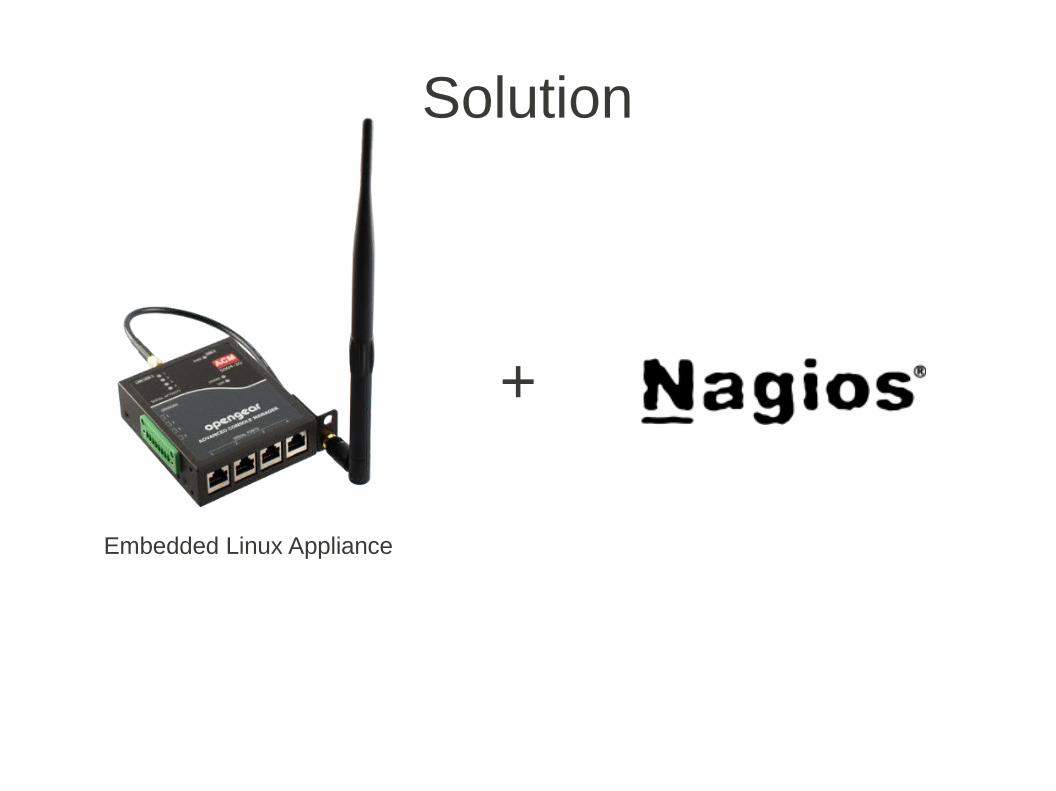
Solution
+
Embedded Linux Appliance
Nagios
● De-facto standard for Open-Source IT Infrastructure Monitoring
● Based on the idea of checks● A check (an executable) performs a test, then
reports a status back to Nagios● Simple
– Ping x.y.z with 10 packets. Warn if latency is greater than 40 ms, and if any packets are dropped
● Complex– Check the production web server SSL certificate.
Warn if it will expire in less than 2 weeks.
Nagios - continued
● Checks are either at a service level, or at a host level.
● Supports dependencies – used to represent network topologies● Important if you don't want 15 alerts when one router
dies
● Mostly concerned with alerting, not logging● Logging and graphing can be done with plugins
● PNP4Nagios - http://docs.pnp4nagios.org
● Integrated into many other commercial monitoring systems● Groundwork
● Centreon
● Opsview
Opengear Embedded Linux Appliances
● Provide connectivity and monitoring for both “dumb” and “smart” infrastructure
● Micrel ARM SoCs
● RS232/422/485 from 1 to 48 ports
● Ethernet, 802.11, Analogue PSTN and 3G connectivity
● Plug-in devices for Temperature/Humidity and TTL Input/Outputs
● All running Linux (2.4.34 on SD400x/CM400x, 2.6.30 on all others)
● Automatically generated Nagios configuration and check support for
– Serial Events
– Temp/Humidity/TTL Alarms
– UPS Status/Battery Level (via NUT)
– Service/Host checks for connected network devices
● Write your own checks in Bash, or C!
Getting results back to Nagios
● Nagios has two types of checks● Active
– Nagios forks and executes the check
– Easily configured
– Concentrate bandwidth/CPU requirements for checks at the server
● Passive– Nagios accepts check results using
Nagios Service Check Acceptor (NSCA)
– Checks must be configured on distributed nodes
– Scales better (check logic not performed by server)
– Allows check results from remote disconnected networks
How we do it – Opengear CMS
● x86 appliance running Linux, available as hardware, or as a VM (VMware and KVM)
● Running Nagios 3.0 with our own layer that:
● Imports Nagios configuration from the console servers
● Sets up SSH tunnels from the devices back to the CMS
● Imports users from devices, and sets up basic Nagios permissions and groups
● Provides remote access to services on the devices
● SSH?
● We use passive checks, and SSH port forwards to the NSCA daemon on CMS
– Only 2 ports required to be open (443, 22)
– SSH is well understood, and robust
– Provides an extra layer of security and authorisation for the NSCA daemon
● SSH lets us “Call-Home” to the CMS, letting devices which are on private networks, or behind NAT still push check results, and allow us access to devices connected to them.
Do it Yourself!
● Everything that we do with our CMS is script-able on a normal *nix box● Its just more work.
– Buy our stuff :)
● If you wish to have other devices contributing checks, you're best to set up your own Nagios server anyway.● Opticomm use Opengear ACM series devices
with 3G uplinks to monitor both networked devices and physical properties (Temp/Water/Fire). The ACM's push check results back to a centralised Centreon installation.

Traps for the unwary
● Set up dependencies correctly.
● Don't forget to monitor your Nagios installation
● Make sure your notification mechanisms are reliable● No point emailing yourself to notify you that your
email server is not responding...
● Understand the effect that monitoring will have on your infrastructure
● Data limits on 3G● Might not seem like much data, but when you're
on telemetry style plans, it can add up.

Questions/Other Approaches
Recommended


